Where’s My Refund? A Look at Tax Refund Trends over Time and Across Income Levels
The issue of tax refunds has received robust media attention as 2018 tax returns are filed in early 2019. For individual income tax filers, 2018 was the first year in which the major changes signed into law by President Trump at the end of 2017 (P.L. 115-97) became effective.
What Determines Tax Refunds?
A taxpayer's tax refund (or payment) in a given year is determined by
- income tax liability: what a taxpayer owes in federal income tax; and
- income tax withholding: the amount that the taxpayer has paid toward that tax bill during the year, often through their employer withholding income taxes from their paychecks.
The refund (or amount owed) is the liability less the amount already paid through withholding. For many low-income taxpayers, the amount of their refund is largely determined by refundable credits. Refundable credits, unlike nonrefundable credits, are not limited to a taxpayer's tax liability. Thus, taxpayers with little to no income tax liability—including many low-income taxpayers—can receive the full value of the credit. The amount of the refundable credit that exceeds tax liability is received as a refund.
Income Tax Liability
Income tax liability depends on several factors—including where a taxpayer lives, the number of children they have, and whether they own their home, for example. Although some taxpayers experienced no changes in their economic or personal circumstances, the numerous changes that P.L. 115-97 made to the tax code could result in these same taxpayers experiencing a change in their tax liability. The Tax Policy Center estimates that approximately 80% of taxpayers will have a lower income tax liability in 2018 as a result of P.L. 115-97, while 5% will experience a tax increase.
Income Tax Withholding
The amount of income tax withheld from employees' paychecks is determined by withholding tables that the IRS provides employers. Employees can adjust this amount (both upward and downward) by filing IRS Form W-4 with their employer. A 2018 Government Accountability Office (GAO) report provides a detailed overview of the withholding process and examples of withholding tables. Taxpayers who do not withhold enough throughout the year to pay their income tax in full are said to be "underwithheld" and owe tax to settle the balance, while those whose total withholdings are greater than their liability are said to be "overwithheld" and receive a tax refund. Generally, a taxpayer's federal income tax refund has no bearing on their tax liability. However, a change in tax liability can affect a taxpayer's refund.
Trends in Tax Refunds
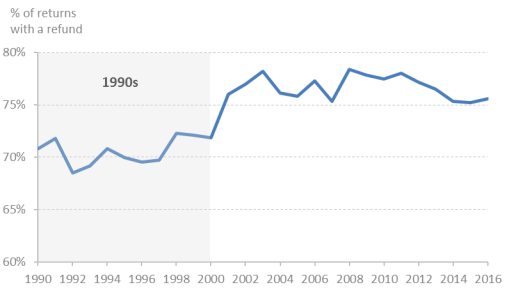
Most taxpayers receive a federal tax refund after filing their individual income tax returns. Throughout the 1990s, about 70% of tax returns filed resulted in a refund (see Figure 1). The share of tax returns filed resulting in a refund increased following the tax cuts of the early 2000s. Over the past decade, on average, 77% of returns filed have resulted in a refund.
 |
|
Source: Internal Revenue Service (IRS), Individual Statistics of Income (SOI), Table A: Selected Income and Tax Items for Selected Years. Note: The shaded region includes returns filed in the 1990s before tax cuts were enacted in the early 2000s (e.g., P.L. 107-16). |
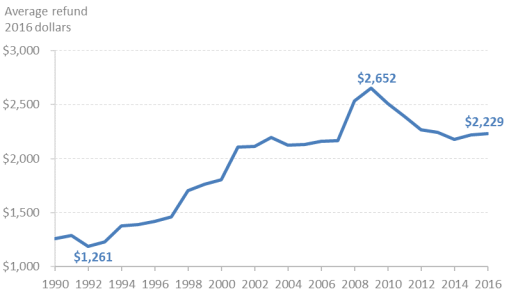
While the share of taxpayers receiving a refund has remained relatively stable over time, the average refund amount has increased, even after adjusting for inflation. The average tax refund in 1990 was $1,261 in 2016 dollars (see Figure 2). By 2016, the average tax refund was $2,229. Refunds were higher following the start of the Great Recession, reflective of lower incomes and stimulus-oriented tax policies. Refunds subsequently declined as the economy recovered and many tax stimulus policies expired.
 |
|
Source: IRS, Individual SOI, Table A: Selected Income and Tax Items for Selected Years. Note: Nominal dollars adjusted for inflation using the CPI-U. |
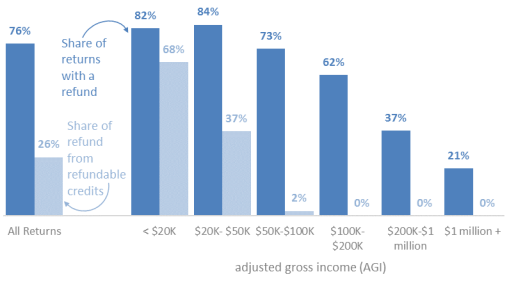
Lower-income taxpayers are more likely to receive a tax refund than higher-income taxpayers (see Figure 3). The amount of refund, however, generally increases for higher-income taxpayers (see Table 1). The composition of the refund also tends to change across the income distribution. Specifically, for lower-income taxpayers, a larger share of their refund is due to the refundable portion of refundable tax credits (the earned income tax credit or the additional child tax credit, for example). Higher-income taxpayers generally cannot claim refundable tax credits. For these taxpayers, their tax refund is a function of the amount of tax withheld.
|
Figure 3. Share of Returns with Refunds and Share of Refund from Refundable Credits |
 |
|
Source: CRS calculations using data from IRS Individual SOI, All Returns: Tax Liability, Tax Credits, and Tax Payments. |
|
AGI Category |
Number of Returns |
Number of Returns with Refund |
Number of Returns with Refundable Portion of Refundable Credits |
Average Refund |
Average Refundable Credit |
||||||
|
|
|
|
|
|
|
||||||
|
|
|
|
|
|
|
||||||
|
|
|
|
|
|
|
||||||
|
|
|
|
|
|
|
||||||
|
|
|
|
|
|
|
||||||
|
|
|
|
|
|
|
||||||
|
|
|
|
|
|
|
Source: CRS calculations using data from IRS Individual SOI, All Returns: Tax Liability, Tax Credits, and Tax Payments.
Notes: All returns include returns with no adjusted gross income. Thus, the sum of the values in each income category is not necessarily equal to the value for all returns.
Filing 2018 Tax Returns: Observations for the 2019 Tax Filing Season
There is limited information regarding the effect of P.L. 115-97 and the subsequent changes in withholdings on tax refunds. The 2018 GAO report indicated that the percentage of taxpayers overwithheld (receiving refunds) could decline by 3 percentage points in 2018, while the number of taxpayers underwithheld (owing taxes) could increase by 3 percentage points. The report did not, however, provide any information on how the value of tax refunds might change for taxpayers filing their 2018 taxes. The first filing statistics of the 2019 tax filing season suggest that refunds are down. In a tweet, the Department of the Treasury warned that this information was based on a small sample, suggesting that the actual effects of recent changes on 2018 tax refunds will not be known until the filing season is over.