What Share of Taxpayers Would See a Tax Decrease or a Tax Increase Under the 2017 Tax Revision, P.L. 115-97?
An analysis of the major provisions of the 2017 tax revision, P.L. 115-97, by the Tax Policy Center (TPC) indicates that the legislation would result in some taxpayers paying more in taxes, some paying less in taxes, and some seeing little or no change in their tax liability. Similar analysis done by the Joint Committee on Taxation (JCT) examined the impact of the Senate bill before conference, finding generally similar trends. However, an updated JCT analysis has not been done for the final law. In addition, the definitions of income and tax increase and decrease used by JCT differ from those used by TPC, making a comparison between the two analyses difficult.
TPC's analysis, dated December 18, 2017, examined the percentage of taxpayers who would face a tax increase or tax cut (and the average amount of that increase or cut) in 2018 and 2027 as a result of the major provisions of the Conference Agreement to H.R. 1. The Conference Agreement to H.R. 1 and P.L. 115-97 are virtually identical save for minor changes made before final passage to provisions of the bill that were not in line with budget reconciliation rules. These differences would likely have little or no impact on the distribution of the tax changes.
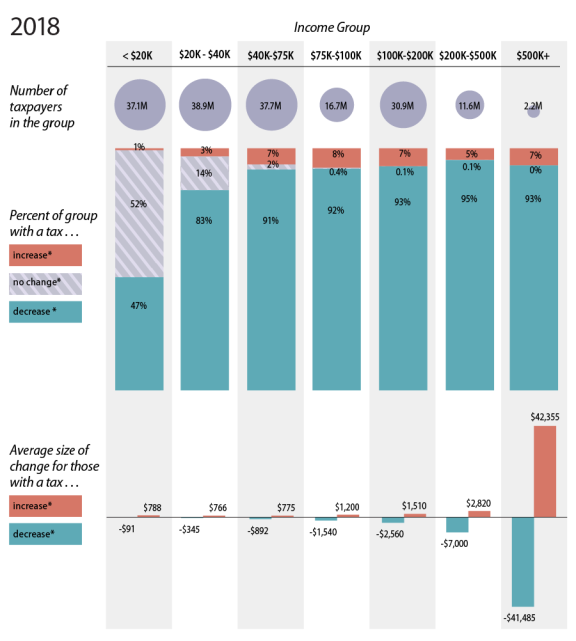
As illustrated in Figure 1, TPC estimates that in 2018
- more than half of the lowest-income taxpayers would see little or no change in their tax liability (i.e., an increase or decrease in tax liability of less than $10);
- as income increases, a greater proportion of taxpayers would see a tax cut (i.e., a decrease in tax liability $10 or more). Among those taxpayers who receive a tax cut, the average amount of that cut would range from $91 per taxpayer for the lowest-income taxpayers to $41,485 per taxpayer for the highest-income taxpayers;
- as income increases, generally an increasing, though relatively small proportion of taxpayers would see their taxes increase (a tax increase of $10 or more). Among those taxpayers who face a tax increase, the average amount of that increase would range from $788 for the lowest-income taxpayers to $42,355 for the highest income taxpayers.
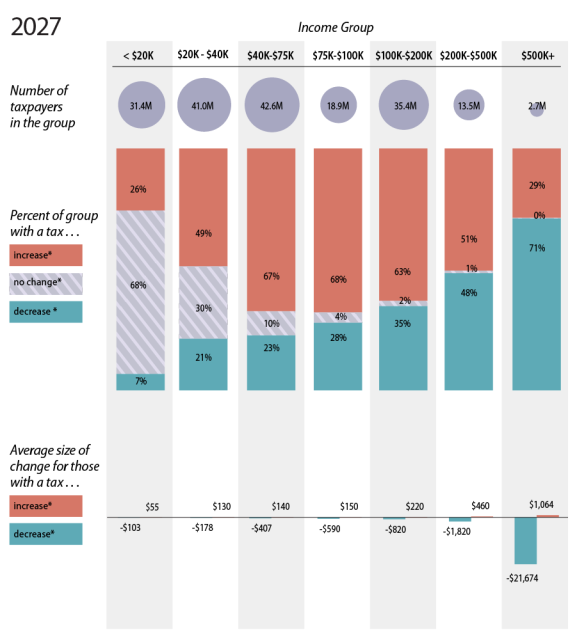
Over time, according to the TPC, the share of taxpayers receiving a tax cut would fall, and the share paying more in taxes would increase, as would the share seeing little or no change, as illustrated in Figure 2. This is primarily the result of the expiration of many of the individual income tax changes at the end of 2025.
|
Figure 1. Proportion of Taxpayers Receiving a |
 |
|
Source: Tax Policy Center T17-0317 Notes: * An increase or decrease in tax liability of $10 or more. Changes (either increases or decreases) of less than $10 are categorized as "no-change." Income is defined as expanded cash income, which is equal to adjusted gross income (AGI) plus certain tax preferences. |
|
Figure 2. Proportion of Taxpayers Receiving a |
 |
|
Source: Tax Policy Center T17-0321 Notes: * An increase or decrease in tax liability of $10 or more. Changes (either increases or decreases) of less than $10 are categorized as "no-change." Income is defined as expanded cash income, which is equal to adjusted gross income (AGI) plus certain tax preferences. |
There are several limitations with these estimates. First, these estimates look at the major provisions of the 2017 tax revision and do not include every provision. Second, these estimates do not provide information about the variance in the size of tax increases or decreases faced by taxpayers at different income levels. While TPC does provide information on the average tax increase or decrease for each group, averages cannot illustrate any variation in tax liability change that could result within a large cohort. Finally, these estimates do not provide information about the underlying factors that result in taxpayers receiving a cut or an increase.
Other analyses—like one done by the New York Times using TaxBrain—illustrate the broad constellation of factors that can result in taxpayers receiving a cut or an increase including (but not limited to) where they live, the number of children they have, whether they incurred significant medical expenses, and whether they own a home. (TaxBrain is an open-source tax model sponsored by the American Enterprise Institute.)
The TPC estimates that the majority of taxpayers in 2018 (80.4%) would initially see a tax cut (a reduction in taxes of $10 or more), but many lower-income taxpayers would see little or no change in their tax burden and some would actually see a tax increase. And these estimates suggest that once the individual income tax provisions expire (on December 31, 2025, for most), nearly three-quarters of taxpayers would see either little or no change in their tax liability (21.4%) or would face a tax increase (53.4%).