The Distribution of the Tax Policy Changes in H.R. 1 and the Senate’s Tax Cuts and Jobs Act
Distributional analysis can be used to illustrate how changes in tax policy would affect the economic well-being of taxpayers. The Joint Committee on Taxation (JCT) regularly prepares distributional analyses of major tax proposals. On November 14, 2017, the JCT released a distributional analysis of the Tax Cuts and Jobs Act (H.R. 1). H.R. 1 passed a vote in the House on November 16, 2017. The JCT has also released a distributional analysis of the Senate's version of the Tax Cuts and Jobs Act.
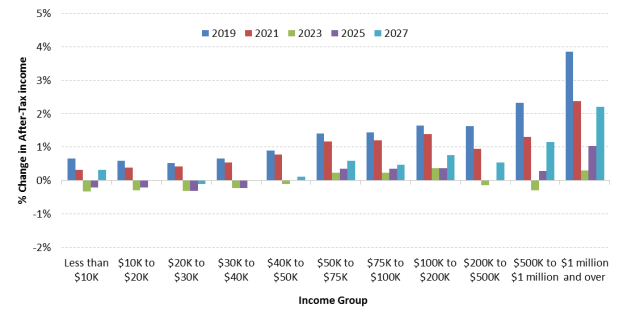
When the goal of distributional analysis is to look at taxpayers' economic well-being, one useful metric is the percentage change in after-tax income. Figure 1 illustrates the estimated percentage change in after-tax income that would result from the Tax Cuts and Jobs Act (the House proposal). Several observations can be made examining the distribution in Figure 1, including the following:
- H.R. 1 would have the largest benefits in 2019 and 2021, in terms of percentage increases to after-tax income, for all income groups.
- Higher-income taxpayers, and taxpayers with incomes over $1 million, tend to experience the greatest percentage increase in after-tax income under H.R. 1.
- For low- and moderate-income taxpayers (taxpayers in income groups of $40,000 or less), after-tax income would be expected to fall in 2023 and 2025.
Several factors help explain the trends observed in Figure 1. First, the House-passed version of H.R. 1 contains a temporary "family flexibility credit." The family flexibility credit is a nonrefundable $300 per taxpayer (or $600 in the case of married taxpayers filing a joint return) that phases-out for higher-income taxpayers. The credit would expire at the end of 2022. After this provision expires, the change in after-tax income would be negative, on average, for taxpayers in the lower and into the middle part of the income distribution. The effects can be seen in the middle and upper-middle portions of the income distribution, as the percentage increase in after-tax income under H.R. 1 falls sharply in 2023. Second, using a chained Consumer Price Index (CPI) to adjust parameters in the tax code for inflation would cause tax burdens to increase over time. This effect would be larger for taxpayers in the lower part of the income distribution. A third factor likely contributing to the distributional effects of H.R. 1 is the reduced tax rate (reduced to 25%) on certain pass-through business income. CRS research has shown that pass-through income tends to be earned by taxpayers with higher incomes. Thus, reduced tax rates on pass-through income would tend to increase after-tax incomes for taxpayers in the upper part of the income distribution. Reductions in the corporate tax rate would also tend to benefit higher-income taxpayers.
|
Figure 1. Estimated Percentage Change in After-Tax Income Under H.R. 1, as Reported, by Year and Income Group |
 |
|
Source: CRS calculations based on Joint Committee on Taxation, "Distributional Effects of H.R. 1, As Ordered Reported by the Committee on Ways and Means on November 9, 2017," JCX-55-17, November 13, 2017. Notes: JCT provided estimates for odd years only. JCT's distributional analysis does not reflect the increased exemption amounts and later repeal of the estate tax. The percentage change in after-tax income is calculated using JCT's average tax rate estimates as [(1 – proposal average tax rate) – (1 – present law average tax rate)] / (1 – present law average tax rate). |
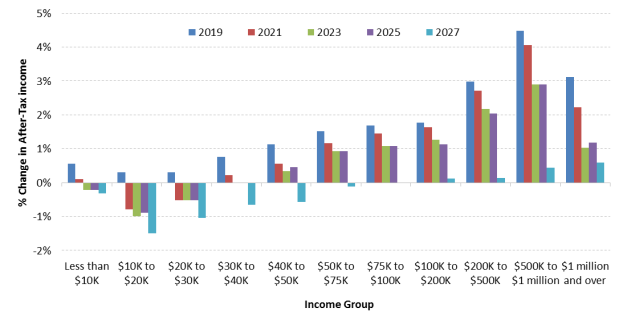
The distributional impacts of the Senate's version of the Tax Cuts and Jobs Act differ from those of the House proposal, reflecting the differences in each chamber's legislation. Observations related to the estimated distribution of the Senate proposal, as illustrated in Figure 2, include the following:
- Like H.R. 1, the Senate proposal is estimated to produce the largest percentage increases in after-tax income in the years following enactment, with the percentage increase in after-tax income tending to decline over time, for all income groups.
- Similar to H.R. 1, higher-income groups tend to have the largest percentage increase in after-tax income. The group with the largest percentage increase under the Senate proposal is the $500,000 to $1 million income group in most years.
- For low- and moderate-income taxpayers (taxpayers in income groups of $40,000 or less), after-tax income would generally be estimated to fall in 2023 and later years.
|
Figure 2. Estimated Percentage Change in After-Tax Income Under the Chairman's Modification to the Chairman's Mark of the Senate's Tax Cuts and Jobs Act, by Year and Income Group |
 |
|
Source: CRS calculations based on Joint Committee on Taxation, "Distribution Effects of the Chairman's Modification to the Chairman's Mark of the "Tax Cuts and Jobs Act," Scheduled for Markup by the Committee on Finance on November 15, 2017 (1)," JCX-58R-17, November 17, 2017. Notes: JCT provided estimates for odd years only. JCT's distributional analysis does not reflect the increased exemption amounts for the estate tax. The percentage change in after-tax income is calculated using JCT's average tax rate estimates as [(1 – proposal average tax rate) – (1 – present law average tax rate)] / (1 – present law average tax rate). |
A key difference between the House and Senate proposals is that most of the individual and non-corporate business Senate proposals are scheduled to expire at the end of 2025 (a notable exception is the adoption of chained CPI, which would be permanent). As a result, by 2027, only taxpayers in the $100,000 and above income groups would have estimated increases in after-tax income, and those increases are relatively modest (0.1% to 0.6%). The estimated decline in after-tax income for taxpayers in the $10,000 to $30,000 income range before 2027 is mainly due to provisions in the Senate proposal that eliminate the individual mandate (or more precisely, reduce the fee for not having health insurance to zero). Specifically, these taxpayers would no longer benefit from the premium tax credit.