U.S. Gasoline Prices: An Introduction
Retail gasoline prices in the United States reflect numerous global, national, regional, state, and local variables. Generally, the U.S. gasoline pricing system is mostly linked to petroleum commodity prices—namely crude oil and gasoline blending components—that change daily. As such, gasoline prices at more than 120,000 retail locations can adjust quickly to reflect changing market conditions. Figure 1 illustrates daily, national average retail gasoline prices from January 2005 to June 2026. In 2025, U.S. drivers consumed approximately 137 billion gallons of gasoline. Price changes affect licensed U.S. drivers operating more than 240 million gasoline vehicles registered in all states and the District of Columbia.
|
Source: American Automobile Association (AAA). Bloomberg L.P. Notes: Nominal values, not adjusted for inflation. |
Gasoline Price Components
Finished motor gasoline that consumers purchase is a blend of several liquid hydrocarbons, most of which are produced by refining crude oil. Generally, the gasoline supply chain includes (1) producing, storing, and transporting crude oil; (2) refining crude oil into gasoline components; (3) transporting and storing gasoline components; (4) blending gasoline components with ethanol and other additives; (5) distributing finished motor gasoline to retail fuel stations; and (6) selling motor gasoline to retail consumers.
Retail gasoline prices reflect several costs throughout the supply chain. On a monthly basis, the U.S. Energy Information Administration (EIA) provides estimates for national average, retail gasoline price components, including crude oil, refining, taxes, and distribution and marketing (see Figure 2). Federal policies and regulations can affect these price components.
Crude Oil
Typically, crude oil is the largest retail gasoline price component (see Figure 2). Crude oil is a globally traded commodity subject to international supply, demand, inventory, trade, and other market dynamics. During calendar year 2025, the United States produced approximately 13.6 million barrels per day (bpd) of crude oil, roughly 16% of global crude oil production and more than any other country. For reference, one barrel is equal to 42 gallons. However, the United States also imports and exports crude oil. Crude oil trade—motivated by geography, refinery configurations, infrastructure, and oil quality considerations—integrates the United States with the global crude oil market.
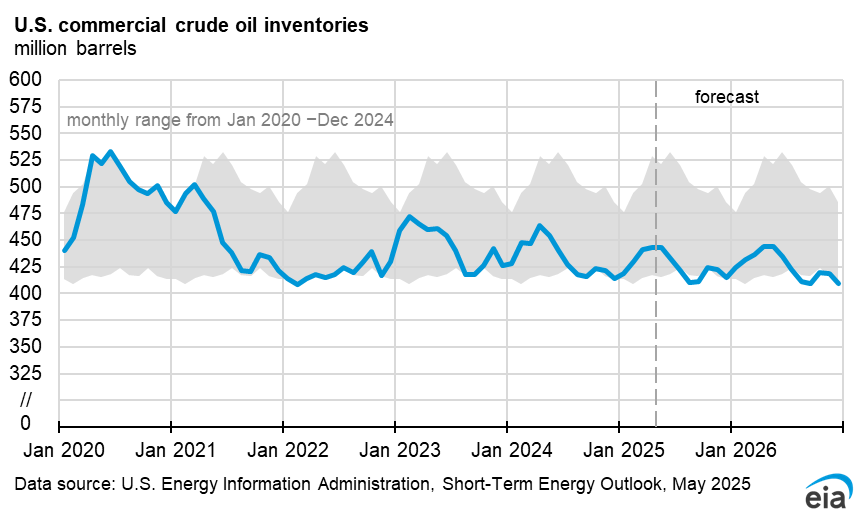
Crude oil supply/demand balance, generally reflected in commercial inventories, is an important indicator of oil market conditions. Supply and/or demand disruptions anywhere in the world can affect U.S. crude oil markets and prices. Congress established the Strategic Petroleum Reserve, which contains crude oil, in 1975 to minimize effects from severe energy supply interruptions.
|
Source: CRS analysis of Energy Information Administration data. Notes: Nominal values, not adjusted for inflation. |
Crude oil prices are linked to futures markets (e.g., financial traders buy/sell futures contracts and other derivatives) and physical markets (e.g., oil producers sell and deliver crude oil to buyers). Typically, crude oil prices reported by U.S. news media represent end-of-day settlement prices for prompt-month, crude oil futures traded on the New York Mercantile Exchange (NYMEX). The Commodity Futures Trading Commission (CFTC) regulates oil futures and derivatives markets. Futures prices can serve as a reference for physical crude oil prices, which are assessed daily by price reporting agencies (PRAs such as Argus and Platts). Physical spot prices, sometimes assessed as either a premium or discount to futures, can reflect factors such as crude oil quality, regional and local supply/demand conditions, and infrastructure constraints.
Crude oil values in Figure 2 represent a composite refiner acquisition cost (RAC) of crude oil on a dollars per gallon basis. RAC values include physical crude oil spot prices plus transportation costs and other fees required to deliver crude oil to a refinery location. Crude oil prices, the largest input cost for an oil refinery, generally pass through to retail gasoline prices.
Refining
Crude oil has limited use in its raw form. Oil refineries convert crude oil, and other inputs, into gasoline, distillate/diesel fuel, jet fuel, and other petroleum products. As of January 1, 2025, 132 operable refineries with a combined crude oil distillation capacity of 18.4 million bpd were located in the United States. Each refinery is uniquely configured in terms of capacity and complexity. During calendar year 2025, U.S. refineries processed approximately 16.7 million bpd of crude oil. Approximately 46% of U.S. refinery yield in 2025 was gasoline.
Similar to crude oil, prices for gasoline components produced at U.S. oil refineries (i.e., wholesale spot prices) are linked to futures markets and physical markets. Further, the U.S. gasoline market is also integrated with global gasoline markets through trade (imports and exports). Physical gasoline spot prices, also assessed by PRAs, often differ at each location to reflect gasoline specifications, refinery outages, supply/demand balance, inventories, and other state/regional variables. Generally, wholesale gasoline spot prices transfer directly to retail prices.
Refining values in Figure 2 represent the difference between national average, wholesale gasoline spot prices and crude oil RAC values. This differential, which indicates refinery gross profit margins for gasoline production, tends to expand and contract over time to reflect market conditions. Crude oil costs and gasoline spot prices do not always move at either the same rate of change or in the same direction.
Taxes
The federal government, state governments, the District of Columbia, and U.S. territories impose and collect gasoline taxes and fees, which transfer directly to retail gasoline prices. As of January 2026, federal taxes totaled $0.184 per gallon for gasoline purchased in all states and the District of Columbia. Federal taxes can be imposed when gasoline is removed from a refinery, or at other points along the supply chain. Most of these tax collections are deposited into the Highway Trust Fund. U.S. territories are exempt from federal gasoline taxes.
From time to time, typically when retail gasoline prices rise, Congress considers legislation that would suspend federal gasoline tax collections. Retail gasoline prices could decline at the time a suspension takes effect. Also, the cost basis for gasoline retailers could be lower during the suspension period. However, the volatile and unpredictable nature of petroleum commodity markets could, within a short period of time, either offset or more than offset any realized retail price reduction. Furthermore, reinstating federal gasoline taxes would likely increase retail gasoline prices when tax collections resume.
Tax values in Figure 2 include federal taxes and average state taxes and fees applicable for each monthly period. As of January 2026, national average gasoline taxes and fees were approximately $0.517 per gallon.
Distribution and Marketing
Gasoline components are transported from refineries to regional distribution facilities. Generally, distribution facilities store gasoline components, ethanol, and other additives onsite. Tanker trucks pick up finished motor gasoline for delivery to retail locations.
Generally, retailers are invoiced for gasoline deliveries. Invoices can include charges for gasoline commodities, federal taxes, state taxes, transportation costs, and other fees. Invoiced values typically represent the cost basis for retail gasoline prices. Retail stations typically mark up the invoiced value to cover costs and capture profits for providing retail services. Retailer markups, which can vary based on retail strategy and local retail competition, ultimately determine the gasoline price posted at retail locations. The Federal Trade Commission monitors retail prices, investigates possible antitrust violations, and conducts competition research. Additionally, several states have enacted laws aimed at preventing gasoline "price gouging." Gasoline profit margins, monitored by firms such as Oil Price Information Service (OPIS), vary at the regional, state, and local level.
Distribution and marketing values in Figure 2 are estimated by subtracting crude oil, refining, and tax components from average retail prices collected in EIA surveys.
Regional Considerations
The U.S. gasoline market consists of several regional markets that differ in terms of crude oil access, pipeline network integration, refinery infrastructure, consumption volumes, and trade patterns. See CRS Infographic IG10051, United States Oil, for additional context.
Retail gasoline prices vary by region. The Gulf Coast, which produces and refines more crude oil than other regions, tends to have the lowest retail gasoline prices. The West Coast, with limited connectivity to other U.S. crude oil production and refining regions, consistently has the highest retail gasoline prices. Retail gasoline prices in California are often higher than prices in all other states. California gasoline prices are influenced by the state's gasoline requirements, crude oil and gasoline imports needed to balance refinery and consumer demand, higher-than-average state gasoline taxes, and the state's Cap and Trade and Low Carbon Fuel Standard programs.
Regional differences may also be relevant when evaluating policies that could affect U.S. oil trade. In 2015, Congress repealed a statutory crude oil export prohibition and enacted a "National Policy on Oil Export Restriction." When gasoline prices rise, Congress sometimes considers legislation that would either prohibit or restrict crude oil and/or gasoline exports from the United States.
Most U.S. crude oil and gasoline exports depart from the Gulf Coast region. Restricting exports could create regional oversupply and put downward pressure on Gulf Coast prices. Oil production and refining in the region could recalibrate to restrictions by lowering output and/or increasing inter-regional movements. Some regions that import crude oil and gasoline components could experience upward price pressure should U.S. export restrictions reduce total global supply. The International Emergency Economic Powers Act (IEEPA) authorizes the President to restrict exports during emergencies.