Introduction
Electric vehicle (EV) technology has emerged as a potential alternative to the internal combustion engine with an increasing variety and volume of electric vehicles sold since the 1990s.1 Numerous policies and incentives are in place or have been proposed to encourage the production, purchase, and use of alternative fuel vehicles (including EVs). These proposals have been at times alongside efforts to reduce fuel consumption and subsequent emissions, support U.S. vehicle manufacturing, and address the growing shortfall in the Highway Trust Fund.2 Since 2010, some incentives and grant programs have expired, and other legislative options have been proposed.3 Underlying these policies are congressional interests such as reducing reliance on foreign sources of petroleum, encouraging rural development, promoting domestic manufacturing, and addressing environmental concerns.
The electric car was first created in the early 1800s as a simple electrified buggy. It was considered to be quiet, easy to drive, and did not emit exhaust like its gasoline- and steam-powered counterparts. According to the U.S. Department of Energy (DOE), by the early 1900s, electric cars had enjoyed a brief popularity, accounting for one-third of cars on the road. Within a few decades, however, electric cars were practically obsolete. Electric starters and increasing availability of gasoline fueling stations made gasoline-powered cars as easy to start and drive as electric cars. Neither type of car required the use of a cumbersome hand-crank system, but gasoline-powered cars gained the edge since electricity availability was slow to expand relative to gasoline fueling stations. The Model T, first produced in 1908, came to dominate the market due to its affordability and driving range.4
Growing concerns in the late 20th century over the environmental impact of fossil fuels and greenhouse gas and other emissions sparked renewed interest in electric vehicles. EVs may support ongoing efforts to address environmental concerns through reducing petroleum consumption in transportation. Support for EV deployment stems from, among other things, federal and state policies establishing manufacturing rebates, tax credits for purchase, funding for research and development, and standards for fuel economy and emissions standards. National standards include Corporate Average Fuel Economy (CAFE) standards promulgated by the U.S. Department of Transportation (DOT) National Highway Traffic Safety Administration (NHTSA) under the authority of the Energy Policy and Conservation Act (EPCA; P.L. 94-163; as amended by the Energy Independence and Security Act of 2007 (EISA; P.L. 110-140)), and the Environmental Protection Agency (EPA) standards for greenhouse gas emissions from motor vehicles as air pollutants under authority of the Clean Air Act (CAA; P.L. 88-206).5 In 2012, NHTSA and EPA coordinated these standards under a joint rule establishing the National Program;6 standards applicable to model years 2021-2026 are currently under reconsideration under the proposed Safer Affordable Fuel-Efficient (SAFE) Vehicles Rule.7
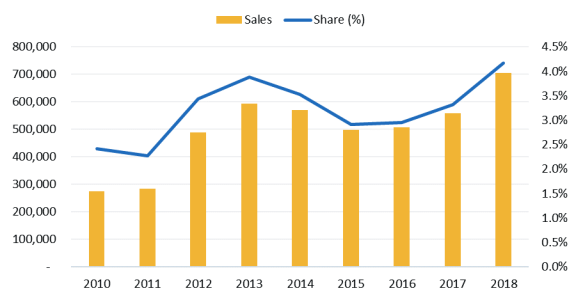
In the 1990s, the first contemporary hybrid-electric vehicle (HEV) debuted on the global market, the Toyota Prius, while General Motors released (and terminated) the first contemporary all-electric vehicle (AEV), the EV-1. From 2000 to 2010, a few more electric vehicles emerged, including the first commercially available plug-in hybrid-electric (PHEV), the Chevrolet Volt, the all-electric Nissan Leaf, and Tesla's line of dedicated all-electric vehicles.8 Many of these EVs were made possible by DOE support for research and development of EV technology, in particular battery technology, as well as DOE-sponsored loans made available to EV automakers and investments in nationwide charging infrastructure. More manufacturers followed, contributing models to a growing electric vehicle market. From 2010 to 2018, EV sales increased from 275,000 to 705,000, making up 4.2% of all new light-duty vehicles sales in 2018 in the United States (Figure 1).9 Charging infrastructure has also grown in response to rising electric vehicle ownership, increasing from 3,394 non-residential chargers in 2011 to 78,301 in 2019.10 However, many locations have sparse or no public charging infrastructure.11
This report provides a primer on the expansion of the market for electric passenger, or light-duty, vehicles.12 This discussion will address some of the factors influencing EV adoption, the broad categories of EVs and related technology, and the current federal policy landscape.
Shift Toward Vehicle Electrification
Most of the more than 92 million new light-duty vehicles sold worldwide in 2018 are conventional vehicles, or those powered by internal combustion engines. Worldwide sales of new plug-in electric vehicles totaled 2.0 million in 2018.13 In the same year, 16.9 million new light-duty vehicles were sold in the United States, with sales of new plug-in electric vehicles totaling 362,000—2.1% of all new vehicle sales.14 When sales of new hybrid-electric vehicles are included, EV sales totaled 705,000, making up 4.2% of all new light-duty vehicle sales in 2018.15
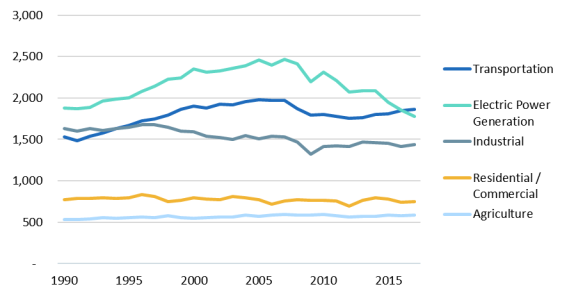
One factor shaping interest in vehicle electrification is its potential to reduce the transportation sector's overall emissions from greenhouse gases, particulate matter, and other air pollutants by reducing the use of petroleum products; the extent of any such reduction would depend on a number of factors, including the mix of regional electricity generation sources. At 1,866 million metric tons of carbon dioxide equivalent in 2017,16 transportation sector emissions have increased more than any other sector since 1990 (Figure 2), along with increasing demand for travel.17 Light-duty vehicles contributed 59% of total transportation emissions, with the remainder coming from trucks and other highway vehicles, aircraft, trains, and ships and boats.18 Light-duty vehicles also consumed 53% of petroleum-based fuels in the transportation sector in 2017.19 Other sectors exhibited reductions in carbon dioxide emissions while making improvements in energy efficiency and reducing consumption of coal and petroleum products. In the electricity generation sector, electric power generated is observed to be relatively flat from 2013 to 2017, while emissions decreased and natural gas and renewable energy consumption replaced coal consumption.20
What Are Electric Passenger Vehicles?
 |
|
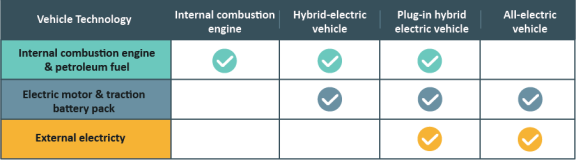
Source: CRS from U.S. Department of Energy (DOE); DOE, Office of Energy Efficiency and Renewable Energy (EERE), Electric-Drive Vehicles, September 7, 2017. |
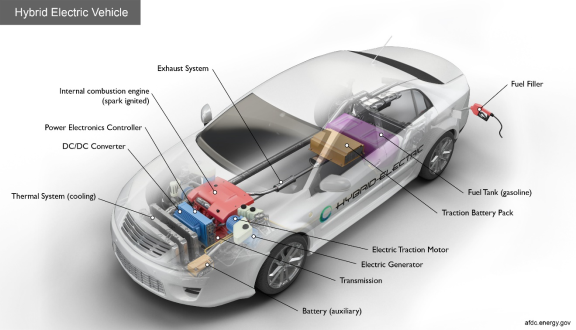
An electric vehicle (EV) is characterized by its electric motor and traction battery pack, comprising numerous battery cells, most commonly lithium-ion. EV batteries provide power that drives the vehicle and are distinct from the lead-acid batteries that are used in the ignition process of most internal combustion engine vehicles (ICEVs).21 At times, the motor acts as a generator, sending electricity to the battery, which is later used to power the motor. The broad categories of EVs can be identified by whether they have an internal combustion engine (i.e., hybrids) and whether the battery can be charged by external electricity (i.e., plug-ins). Figure 3 demonstrates the differentiations between the three broad categories of EVs: hybrid-electric vehicles (HEVs), plug-in hybrid-electric vehicles (PHEVs), and all-electric vehicles (AEVs).
 |
|
Source: U.S. Department of Energy. |
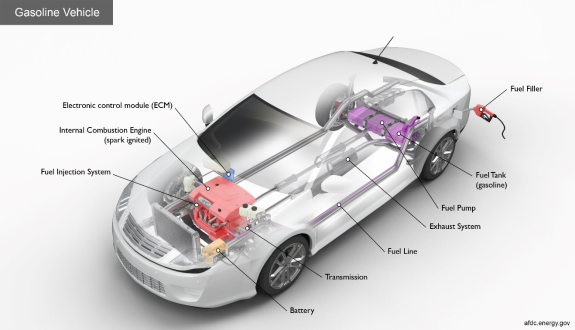
Internal combustion engine vehicles are the most common passenger vehicles on the road. They rely primarily on petroleum-based fuel (typically gasoline), which is injected into a small chamber in the internal combustion engine where a spark ignites the fuel to produce the power that propels the vehicle (Figure 4).22 The ICEV powertrain can have more than 100 moving parts between the engine, the transmission, and other components.23 Fuel efficiency in new ICEVs has increased, with some vehicle models achieving a rating of up to 39 miles per gallon (mpg) for model year 2019.24 Table 1 summarizes various aspects of ICEVs and the different electric vehicle types.
|
Internal Combustion Engine (ICEV) |
Hybrid-Electric (HEV) |
Plug-In Hybrid-Electric (PHEV) |
All-Electric (AEV) |
|
|
Fuel Economy Ratinga |
29 mpg (average)b Up to 39 mpg |
45 mpg (average)b Up to 58 mpg |
60 mpge (average)c Up to 133 mpge |
107 mpge (average)c Up to 136 mpge |
|
Driving Ranged |
Up to 640 miles |
Up to 690 miles |
Up to 640 miles (combined) Up to 130 miles (battery only) |
Up to 370 miles (single charge) |
|
Fuel Costse |
10¢-15¢ per mile |
5¢-10¢ per mile |
5¢-10¢ per mile 2¢-4¢ per mile (battery only) |
2¢-4¢ per mile |
|
Battery Pack and Sizef |
None |
Lithium ion or nickel-metal hydride Up to 1.6 kWh |
Lithium ion 7.6-42 kWh |
Lithium ion 18-100 kWh |
|
Greenhouse Gas Emissionsg and Fuel Type |
4.1-14.7 metric tons per year Gasoline/diesel |
2.8-9.0 metric tons per year Gasoline/diesel |
2.5-7.0 metric tons per yearh Gasoline/diesel; electricity |
1.8-3.5 metric tons per yearh Electricity |
|
Types of Existing Policies |
— |
State incentives |
Federal tax credits State incentives |
Federal tax credits State incentives |
|
Examples |
Ford Mustang Jeep Wrangler |
Hyundai Ioniq Toyota Prius |
Chevrolet Volt Chrysler Pacifica Hybrid |
Nissan Leaf Tesla Model 3 |
Source: U.S. Department of Energy (DOE) and Environmental Protection Agency (EPA), FuelEconomy.gov, Fuel Economy Guide: Model Year 2019 [datafile], modified December 18, 2019. EPA, The 2018 EPA Automotive Trends Report: Greenhouse Gas Emissions, Fuel Economy, and Technology Since 1975, March 2019. DOE, Office of Energy Efficiency and Renewable Energy (EERE), Electric-Drive Vehicles. DOE, Alternative Fuels Data Center (AFDC), "Vehicle Cost Calculator Assumptions and Methodology," updated May 18, 2017, https://afdc.energy.gov/calc/cost_calculator_methodology.html. InsideEVs, "Compare EVs: Guide to Range, Specs, Pricing and More," July 22, 2019, https://insideevs.com/reviews/344001/compare-evs/.
Notes: Typical values presented for comparison purposes. Model year (MY) 2019 except where noted.
a. Miles per gallon (mpg) or miles per gallon of gasoline equivalent (mpge; a quantity of fuel with same energy content as gallon of gasoline). Ratings based on laboratory testing and vary from real-world fuel economy due to a range of factors, including driving conditions, vehicle load, etc. FuelEconomy.gov, Fuel Economy 2019.
b. Production-weighted average for MY2017 includes sedan/wagons and car SUVs, but not light-duty trucks. EPA, 2018 Trends Report, p. 52.
c. Highest combined fuel economy for MY2017 from CRS estimation from EPA figure; EPA, 2018 Trends Report, figure 4.14.
d. ICEV includes flex-fuel vehicles; DOE does not provide ranges for all ICEVs. FuelEconomy.gov, Fuel Economy 2019.
e. Annual fuel costs divided by annual mileage based on vehicles and assumptions at the time of publication of EERE's Electric-Drive Vehicles in 2017: $3.08 per gallon of gasoline, 11¢ per kilowatt hour (kWh) of electricity, and 12,000 annual miles. AFDC, "Assumptions and Methodology," table 6 and table 9.
f. CRS calculation of HEV battery voltage multiplied by capacity in ampere-hours from FuelEconomy.gov; FuelEconomy.gov, Fuel Economy 2019. PHEV and AEV from InsideEVs; InsideEVs, "Compare EVs."
g. Metric tons of carbon dioxide (CO2) equivalent uses global warming potential to compare different greenhouse gas emissions: CO2, methane (CH4), and nitrous oxide (N2O). Total upstream and downstream emissions from fuel production to final use for 15,000 annual miles from FuelEconomy.gov comparison tool. Lowest and highest identified by combined CO2 from FuelEconomy.gov; FuelEconomy.gov, Fuel Economy 2019.
h. CRS calculation from grams per mile from FuelEconomy.gov national average, which uses recent electricity generation data regardless of model year selected and assumes a ratio of electric to gasoline operation based on individual vehicle design and average driving habits for PHEVs. Greenhouse gas emissions associated with electric operation vary based on fuel sources. Electric-only operation produces upstream but not downstream emissions.
|
An EV's distinctive electric motor and traction battery pack are designed to conserve energy and work together to charge the battery pack while the vehicle is in use. Idling stop powers down the vehicle at complete stops (e.g., at stop lights) in order to conserve energy and reduce greenhouse gas emissions for hybrids. Following a stop, some hybrids can move with just the stored electricity, delaying ignition of the engine until the vehicle reaches a higher speed, further conserving fuel. Regenerative braking allows the vehicle to convert the friction from deceleration into stored energy that can power the electric motor. Since friction energy would otherwise go to waste, this feature makes cars more fuel efficient. |
 |
|
Source: U.S. Department of Energy. |
Of the electric vehicle alternatives, HEVs are most similar to ICEVs, but with higher fuel economy due to a traction battery pack,25 electric motor, and regenerative braking system. Like ICEVs, HEVs require gasoline to initiate the engine that powers the car, but once running, HEVs supplement that initial power through the electric motor using electricity stored in the battery (Figure 5). The battery is continuously recharged while the car is in use, either by the internal combustion engine or regenerative braking (see shaded box on Features of Electric Vehicles).26 HEVs cannot run without a petroleum product, but they are generally more fuel efficient than ICEVs, achieving up to a 58 mpg rating.27
 |
|
Source: U.S. Department of Energy. |
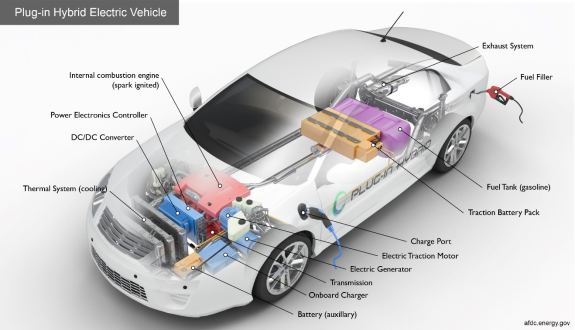
PHEVs combine the technology of HEVs with the ability to charge the traction battery pack via an external source of electricity (Figure 6). As a result, PHEVs can be operated without external charging over a driving range similar to HEVs or in electric-only operation over a certain driving range, especially with regular access to charging facilities.28 To accommodate this electric driving range, PHEVs require more electricity and batteries with greater electricity storage capacity than HEVs—up to 42 kilowatt hours (kWh) for PHEVs versus up to 1.6 kWh for HEVs.29 In a PHEV, the internal combustion engine and the electric motor may both be enabled to power the wheels directly in a parallel configuration. The internal combustion engine may also be used in a series configuration only to generate electricity to store in the battery, which is then used by the motor to power the wheels (other configurations are also possible). PHEVs offer higher fuel economy than both HEVs and ICEVs, up to 133 miles per gallon of gasoline equivalent (mpge).30
 |
|
Source: U.S. Department of Energy. |
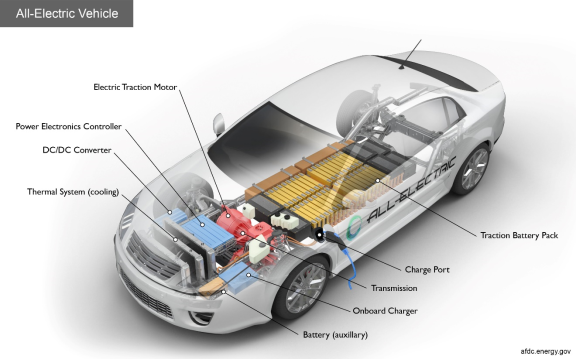
AEVs (also called battery-electric vehicles or BEVs), run entirely on electricity stored in a large traction battery pack (Figure 7)—the largest among EVs with a capacity of up to 100 kWh.31 The battery must be charged via an external source of electricity. Regenerative braking alone is insufficient to generate the quantity of electricity needed to power the motor and all other functionality of a car. AEVs offer the highest fuel economy ratings, up to 136 mpge.32 AEVs do not use gasoline and have no internal combustion engine.33 The result is fewer moving and wearing parts in the powertrain and more electronic components.34 Consequently, a manufacturing shift toward AEVs may disrupt parts manufacturing and maintenance in the automotive industry due to changing demands for parts and differing required skillsets for laborers in the production and maintenance of AEV parts.35
How to Charge Plug-In Electric Vehicles
Batteries in plug-in electric vehicles—PHEVs and AEVs—can be charged using a standard residential outlet. Providing a full charge in this manner takes hours due to the low voltage available from a home electrical service. The slow pace of charging is one factor currently affecting consumer acceptance of EVs; most motorists are used to filling up a tank with gas in a matter of minutes.
Current technology (Table 2) offers three rates of charging, differentiated by the voltage of the electrical current: Level 1 at 120 volts alternating current (AC; see shaded box on Alternating Current Versus Direct Current); Level 2 at 240 volts AC; and Level 3 (also called DC fast charging) at 500 volts direct current (DC). Level 1 and Level 2 are the most widely accessible, with both voltages often available in a standard home. Connectors and charge ports for AC charging use the SAE J1772 standard, a result of the SAE International standards process documenting common engineering practices.36 Most plug-in electric vehicles come with a Level 1 cordset with a standard three-prong plug on one end and a J1772 connector on the other that plugs into a vehicle's corresponding charge port.37 Some vehicles come with a Level 2 cordset, which has a plug for a 240-volt outlet, such as that used for a clothes dryer. For drivers charging at home, no additional cost is required if the selected outlet is served by a dedicated circuit.
|
Alternating Current Versus Direct Current38 Alternating current (AC) is electrical current that reverses direction regularly. The majority of electricity in the United States is generated and distributed in AC at a frequency of 60 Hertz (i.e., cycles per second). AC lends itself to repeated conversion to different voltages, a characteristic that enabled its initial use in the distribution of electricity across long distances. Direct current (DC) is electrical current that flows constantly in a single direction. Batteries and many distributed generation systems generate electricity in DC, and many electronic devices and appliances (including EVs) operate in DC. Since conversion between AC and DC results in energy loss, certain applications may benefit from DC distribution.39 Despite some debate, neither current appears to pose a greater health or safety risk over the other. Instead, the magnitude of the electrical current (measured in amperes) is the primary determinant of risk, where current is a function of the voltage.40 |
Lower voltages mean longer charging times. Level 3 offers the highest voltages and faster charging rates than Level 1 and Level 2. The Level 3 charging unit has a charger that converts AC from the electric grid to DC, enabling direct charging of the battery pack. Ordinarily, EVs use an on-board charger to perform this conversion.41 As an emergent technology, Level 3 connectors and charge ports are not currently standardized and include CHAdeMO (used by Kia, Mitsubishi, and Nissan);42 SAE combined charging system (CCS; used by BMW and Chevrolet); and Tesla Supercharger (proprietary to Tesla vehicles).43 Due to the high voltage, Level 3 is not available for residential installation and is only accessible at charging stations.
|
Level 1 |
Level 2 |
Level 3 |
|
|
Voltage |
120 volts AC |
240 volts AC |
500 volts DC |
|
Outlet Type |
Standard home outlet |
Clothes dryer or stove outlet |
Only accessible at charging stations, not available for households |
|
Vehicle Connector and Charge Port |
|
|
|
|
Charge Rateb |
Up to 80 miles in 16 hours Up to 5 miles per hour |
Up to 80 miles in 4 hours Up to 20 miles per hour |
Up to 80 miles in 20 minutes Up to 240 miles per hour |
|
Equipment |
Cordset, outlet, dedicated circuit, wall or pedestal mount (optional) |
Cordset, outlet, dedicated circuit, wall or pedestal mount (optional) |
Public charging station |
|
Equipment Costsc |
|||
|
Residentiald |
$400-$900 |
$680-$4,100 |
Not available |
|
Non-Residentiale |
$300-$1,500 |
$400-$6,500 |
$10,000-$140,000 |
 SAE J1772
 SAE J1772 CCS
 CHAdeMO
 Tesla Supercharger
Source: U.S. Department of Energy (DOE), Alternative Fuels Data Center "Developing Infrastructure to Charge Plug-In Electric Vehicles," accessed January 29, 2020, https://afdc.energy.gov/fuels/electricity_infrastructure.html. DOE, Office of Energy Efficiency and Renewable Energy (EERE), "Vehicle Charging," accessed January 29, 2020, https://www.energy.gov/eere/electricvehicles/vehicle-charging. EERE, Costs Associated with Non-Residential Electric Vehicle Supply Equipment, November 2015, pp. 11-18. Michael Nicholas, Estimating Electric Vehicle Charging Infrastructure Costs Across Major U.S. Metropolitan Areas, The International Council on Clean Transportation, Working Paper 2019-14, August 2019, p. 6.
Notes: Typical values presented for comparison purposes.
a. Combined charging system (CCS).
b. Approximate charge capacity; does not reflect real-world driving range. Actual charge times depend on battery's state of charge and charge acceptance rate.
c. Cost for single charging unit. Does not include potential government incentives.
d. Average additional costs, including installation. Costs may be $0 with ready access to a suitable outlet for the manufacturer-provided Level 1 or Level 2 cordset. Further costs are incurred for a new cordset or installation of a new circuit or outlet for various housing types (e.g., standalone house, apartment).
e. Range of potential costs for public or workplace charging stations, not including installation costs, which vary regionally with labor, materials, permits, and taxes. Equipment costs depend on power level, mounting style, additional technology features, and how many charging units are grouped on a single pedestal or wall mount.
Fast Charging and Battery Performance
Level 3 charging introduces potential challenges to the longevity of batteries in plug-in electric vehicles—PHEVs and AEVs. While the lithium-ion batteries used in PHEVs and AEVs are known to lose charging capacity over time, some studies suggest that fast charging contributes to elevated rates of capacity loss and decreased charging cycles.44 In 2019, many EVs with fast-charging capabilities are equipped with a variety of systems to address capacity loss, including cooling systems, as well as battery management systems that monitor battery health, track frequency of fast charging, and adjust the charge rate to prevent damage to the battery, potentially addressing some of these concerns.45 Meanwhile, researchers have continued to probe ways to improve fast charging while mitigating its potential impacts.46
Considerations
Since the first modern EVs were introduced in the 1990s, use of EV technology and supporting infrastructure has grown. As an emergent technology area, a number of factors remain under consideration.
Emissions and Electric Vehicle Charging
On average, a fleet of EVs could reduce air emissions compared to a fleet of ICEVs, but the extent of the reduction and any associated benefits depend on a variety of factors, in particular when, where, and how plug-in EVs are driven and charged. These emissions include greenhouse gases and other pollutants that contribute to smog and other air quality problems.47 Transportation emissions can be divided into upstream emissions and downstream emissions. Upstream emissions are associated with the processes of fuel extraction and production, including the production of gasoline and diesel for combustion in ICEVs, and the generation of electricity for charging plug-in EVs. Downstream emissions are emitted while the car is in use, including those emitted from the tailpipe or from evaporation during fueling. PHEVs operating on electricity and AEVs produce few downstream emissions, but they are not emissions free. Determining the emissions from charging a plug-in EV relative to an ICEV depends largely on the sources of the electricity used to charge the vehicle. Research has also shown that emissions are further impacted by charging and usage patterns as well as the efficiency of an individual vehicle.48
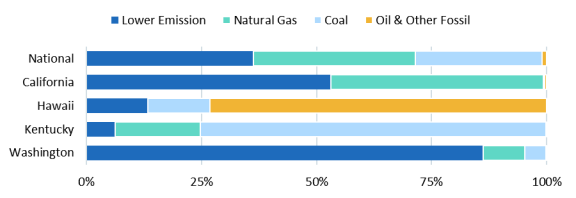
Electricity generation in the United States produced more greenhouse gases and other pollutants than any other sector between 1990 and 2017.49 Nationally, as fuel sources have changed—decreased use of coal and increased use of natural gas and other lower-emission or renewable sources—and energy efficiency has increased, greenhouse gas emissions from electricity generation have declined by 4.8% since 1990, even as demand for electricity has increased over the same period.50 However, national averages obscure regional variation in potential emissions from the mix of fuel sources used for electricity generation (Figure 8).
|
Figure 8. Regional Variation in Electricity Generation Sources Shares of Primary Electricity Sources Nationally and in Select States |
 |
|
Source: Department of Energy, Alternative Fuels Data Center, "Emissions from Hybrid and Plug-In Electric Vehicles," interactive figure, accessed January 29, 2020, https://afdc.energy.gov/vehicles/electric_emissions.html. Notes: Average energy sources in 2018. States selected to highlight regional variability compared to national average. Lower-emission fuels include nuclear, hydropower, wind, solar, biomass, and geothermal. |
For plug-in EVs, per-mile emissions attributed to upstream sources vary geographically. An AEV would be expected to produce fewer emissions on average if charged in the state of Washington where 70% of electricity is produced with hydropower than if charged in Hawaii where 69% of electricity is produced with oil.51 Additionally, sources for electricity may change over time, resulting in changing emissions for PHEVs and AEVs—new and otherwise.
Emissions attributed to upstream sources also depend on the time of day and year when charging takes place. Typically, electrical power systems leverage different electricity generation units to meet electricity demand, shifting electricity generation sources throughout the day or year as demand changes.52 An increase in electricity demand from charging EVs may require additional generation which may use sources with greater or fewer emissions.
Battery Materials Management
Batteries are a crucial component of EVs and introduce novel supply chain considerations to the overall vehicle market. As electric vehicles increase in market share, the overall material requirements of the vehicle market shift from fuels for combustion to minerals and other materials for battery production. Using a comparison of the material compositions of an AEV (Chevrolet Bolt) and an ICEV (Volkswagen Golf), UBS estimated increases in global demand for battery materials such as lithium, cobalt, and graphite, for a fleet entirely made up of AEVs with existing battery technology.53 On the other hand, the lightweight body typically preferred by EV manufacturers is estimated to result in decreased global demand for materials such as iron and steel in favor of aluminum. Potential considerations for electric vehicle batteries include
- supply of minerals and other raw materials and subsequent refining capabilities;54
- ability to manufacture battery cells and assemble into battery packs; and
- end-of-life management by recycling and disposal of batteries composed of chemicals that may be hazardous to humans and the environment.
Like any other type of battery, EV batteries' performance will decline through repeated use, but such batteries may be eligible for second and third uses. EV batteries are expected to last at least eight years in a motor vehicle, with most manufacturers offering eight-year or 100,000-mile warranties.55 When batteries are no longer suitable for use in EVs, they are expected to have approximately 70% capacity.56 Strategies to extend the useable life of EV batteries include
- reconditioning for continued use in EVs by replacing specific modules experiencing uneven decline in performance;57 and
- repurposing for use in stationary energy storage systems.58
Lastly, materials within batteries may be recycled for other uses (including making new batteries). Less than 5% of lithium-ion batteries—the most common type of EV battery—are currently being recycled, due in part to the complex technology of the batteries and cost of such recycling.59 Growing interest in improving lithium-ion battery recycling, such as DOE's 2019 announcement of the Battery Recycling Prize and investment in the Lithium Battery R&D Recycling Center, may elevate recycling rates.60
Existing Authorities and Incentives
A range of federal policies affect the purchase and use of EVs. Vehicle manufacturers have used EV sales to help meet the coordinated standards for Corporate Average Fuel Economy (CAFE) set by the National Highway Traffic Safety Administration (NHTSA) and greenhouse gas emissions under the Clean Air Act (CAA) set by the EPA.61 Future regulatory action under the Safe Affordable Fuel-Efficient (SAFE) Vehicles Rule may result in changes to these standards for automakers to take into account. A number of other programs, such as the Clean Cities Program, have promoted research and development of batteries and energy storage, charging infrastructure, and other vehicle technologies, exemptions, and deployment. For a fuller list of these programs see CRS Report R42566, Alternative Fuel and Advanced Vehicle Technology Incentives: A Summary of Federal Programs, by Lynn J. Cunningham et al.
Selected Incentive Programs
Certain federal programs active during the 116th Congress aim to promote the production and purchase of EVs through service and tax credit incentives.
Corporate Average Fuel Economy (CAFE) Program Alternative Fuel Vehicle Credits.62 Establishes a credit system for automakers for selling alternative fuel vehicles. The program promotes the production and sale of alternative fuel vehicles and provides flexibility for automakers to comply with fuel economy standards. Credits are unlimited for dedicated vehicles (e.g., AEVs) and were phased out after model year 2019 for dual-fueled vehicles (e.g., PHEVs). Proposed regulatory action in 2018 may result in changes to this program for model years 2021 and beyond.
High Occupancy Vehicle (HOV) Lane Exemption.63 The statute governing HOV lanes allows states to establish programs to exempt certain alternative fuel vehicles (including PHEVs and AEVs) from HOV lane requirements. The exemption expires September 30, 2025. States were also able establish programs to allow other low-emissions and energy-efficient vehicles to pay a toll to access HOV lanes, but this authority expired September 30, 2019.
National Alternative Fuels Corridor.64 Directs the Department of Transportation to designate strategic locations along major highways for developing plug-in electric vehicle charging and hydrogen, propane, and natural gas fueling. Infrastructure is to be deployed by the end of 2020.
Plug-In Electric Vehicle Tax Credit.65 Provides a federal income tax credit of up to $7,500 per vehicle for buyers of qualifying plug-in electric vehicles—including PHEVs and AEVs. The credit begins to phase out after an automaker has sold 200,000 qualifying vehicles; currently, Tesla and General Motors have reached this threshold. The tax credit helps offset the cost of electric vehicles, which are on average more expensive than ICEVs.
Selected Proposed Federal Legislation
Several bills pending in the 116th Congress would affect existing policy and incentives, and some bills would establish new programs or policies. The following bills were selected to demonstrate a few facets of the current discussion over the future of federal policy on the deployment of vehicle electrification. Other bills have been introduced in the 116th Congress that would establish rebate programs for electric charging infrastructure, expand the Plug-In Electric Vehicle Tax Credit to include previously-owned vehicles, and reinstate the tax credit for the cost of alternative fuel refueling property.
Renew or Repeal the Plug-In Electric Vehicle Tax Credit
Driving America Forward Act (H.R. 2256/S. 1094). Would expand the tax credit for plug-in electric vehicles, which would allow the buyers of 600,000 total vehicles per automaker (currently capped at 200,000) to be eligible for a credit of up to $7,000 (currently $7,500) before the credit is phased out. This bill was referred to committee in both chambers.
Electric Credit Access Ready at Sale (Electric CARS) Act of 2019 (H.R. 2042/S. 993). Would extend the tax credit for plug-in electric vehicles through December 31, 2029, and repeal the cap for automakers (currently set at 200,000). This bill was referred to committee in both chambers.
Fairness for Every Driver Act (H.R. 1027/S. 343). Would repeal the tax credit for plug-in electric vehicles (currently capped at 200,000 per automaker for up to $7,500 per vehicle) and impose an annual fee on alternative fuel vehicles (i.e., vehicles with electric motors that draw significant power from a source not subject to certain fuel taxes) to be transferred to the Highway Trust Fund. This bill was referred to committee in both chambers.
Establish New Programs or Policies
American Cars, American Jobs Act of 2019 (H.R. 2510/S. 683). Would establish a voluntary program at NHTSA to encourage the purchase or lease of new automobiles made in the United States. The program would provide $3,500 vouchers to purchasers of new passenger vehicles (of any type) produced domestically and $4,500 vouchers to purchasers or lessees of new qualified plug-in electric drive vehicles. The vehicles must be assembled in the United States and contain at least 45% U.S. or Canadian parts. This bill was referred to committee in both chambers.
Clean Corridors Act of 2019 (H.R. 2616/S. 674). Would establish a grant program for state, tribal, or local government authorities to install electric vehicle charging and hydrogen fueling infrastructure along the National Highway System. This bill was referred to committee in both chambers.
Leading Infrastructure for Tomorrow's America Act (H.R. 2741). Would direct the Department of Energy to develop model building codes for integrating electric vehicle charging infrastructure and direct states to authorize utilities to recover from ratepayers expenditures from the deployment of electric vehicle charging equipment, in addition to other policies promoting the deployment of electric vehicle charging infrastructure. This bill was referred to committee in the House.
Vehicle Innovation Act of 2019 (H.R. 2170/S. 1085). Would authorize appropriations through FY2024 to the Department of Energy for research, development, engineering, demonstration, and commercial application of vehicles and related technologies, including vehicle electrification. This bill was referred to committee in the House, and placed on the Senate Legislative Calendar under General Orders (Calendar No. 186).
Zero-Emissions Vehicles Act of 2019 (H.R. 2764/S. 1487). Would amend CAA to create a national zero-emissions vehicle standard for automakers whereby zero-emissions vehicles (e.g., all-electric vehicles, hydrogen fuel cell vehicles) are required to comprise 50% of new car sales by 2030 and 100% by 2040. Referred to committee in both chambers.