Introduction
Legislative proposals have been introduced since the 105th Congress to create a national electricity portfolio standard that would require electric utilities to procure a certain share of the electricity they sell from specified sources. Twenty-nine states, three U.S. territories, and the District of Columbia are currently implementing mandatory portfolio standards, and an additional eight states and one territory have voluntary versions.1
Various existing and proposed portfolio standards use a range of terms for similar concepts. A renewable portfolio standard (RPS) typically means a requirement to procure electricity from renewable sources. A clean energy standard (CES) typically means a variant of an RPS that includes some nonrenewable sources, such as nuclear or selected fossil fuels, in the requirement. Some lawmakers and stakeholders use these terms interchangeably, and some use the term CES or "clean energy" to refer only to renewable sources. This report uses the more general term "portfolio standard" to avoid confusion between RPS and CES.
At both the federal and state level, lawmakers express multiple goals for portfolio standards. These include greenhouse gas reduction, technology innovation, and job creation. Policy design choices, as discussed in this report, can influence the extent to which portfolio standards might achieve those or other goals.
Other policies could potentially achieve the same goals as portfolio standards. For example, tax incentives or funding for technology research, development, and deployment could promote the use of certain types of electricity generation sources by reducing their costs. This report does not compare portfolio standards with other policy options, nor does it fully examine the costs and benefits of establishing a national portfolio standard compared to business-as-usual trends in the electric power sector.
This report provides background on portfolio standards and an overview of policy design elements to inform debate around proposals introduced in the 116th Congress, building on previous CRS reports addressing this topic.2 This report also analyzes potential effects of portfolio standard design choices, with an emphasis on economic effects, environmental effects, and potential interactions with state energy policies. Other potential effects that may be of congressional interest, but are outside the scope of this report, include public health, considerations regarding critical minerals used in some energy sources, electric reliability, cybersecurity, and geopolitics.
U.S. Electricity Generation Profile
A number of government agencies, nongovernmental organizations, academic researchers, and private sector entities analyzed potential effects of a national portfolio standard in 2011 and 2012 because of congressional interest at that time.3 Since 2012, the U.S. electric power sector has seen several changes in its generation profile that were unanticipated in those analyses. These include an increase in generation from sources using natural gas and renewable energy, along with a decrease in coal-fired generation. The current U.S. electricity generation profile and market trends may be important context for any congressional debate about a potential national portfolio standard.
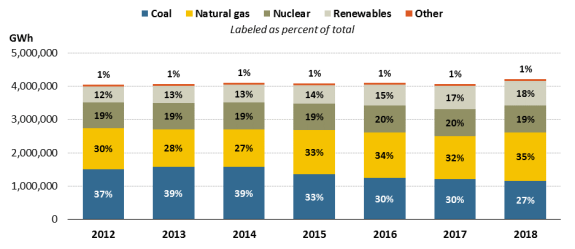
The U.S. Energy Information Administration (EIA) reports that total electricity generation was 4,047,766 gigawatt-hours (GWh) in 2012 and 4,207,353 GWh in 2018, an increase of 4%.4 Most of this increase occurred between 2017 and 2018, as shown in Figure 1.
|
Figure 1. Total National Electricity Generation by Source, 2012 - 2018 |
 |
|
Source: EIA, Electricity Data Browser, https://www.eia.gov/electricity/data/browser/. Notes: Renewables = utility scale and small-scale solar, wind, wood and wood-derived fuels, landfill gas, biogenic municipal solid waste, other waste biomass, geothermal, and hydroelectric facilities. Other = petroleum liquids, petroleum coke, other gas, nonbiogenic municipal solid waste, and other miscellaneous energy sources. EIA did not report data for small-scale solar in 2012 or 2013. In 2014, small-scale solar accounted for 0.3% of total U.S. electricity generation. |
Between 2012 and 2018, the share of electricity generation from different sources has changed. Coal generated 37% of total generation in 2012 and 27% in 2018. Natural gas generated 30% of total generation in 2012 and 35% in 2018. Renewable sources, including hydropower, wind, solar, geothermal, and biomass, generated 12% of total generation in 2012 and 18% in 2018. Many expect these trends to continue. For example, EIA's projection of current laws, regulations, and market trends show coal contributing 17% of total generation in 2050, natural gas contributing 39%, and renewable sources contributing 31%.5
Electric power sector observers generally agree on the factors causing these trends, although the relative importance of each factor is subject to some debate. The changes from 2012 to 2018 are due to a combination of (1) continued low natural gas prices and low wholesale electricity prices; (2) federal environmental regulations, especially on coal-fired power plants; (3) declining capital costs for wind and solar sources; (4) federal tax incentives for wind and solar sources; (5) state portfolio standards and other policies; (6) changing consumer preferences, especially large corporations' and institutions' commitments to procure more electricity from renewable sources; and (7) natural turnover as generators age.6
Differing perspectives over the relative influence of these factors could affect stakeholder views on the merits of a federal policy to promote greater use of certain energy sources for electricity generation. Some might argue that sources that are now cost competitive (e.g., natural gas, wind) may not require policy support to increase their share of the electricity generation profile. Others may see electricity generation as solely an area for state policy as discussed further in the section "Interaction with Other State Energy Policies," below. A related consideration may be whether increasing the pace of change in the U.S. electricity portfolio could pose reliability risks.7
Key Portfolio Standard Concepts
Key concepts in portfolio standard policymaking may or may not have identical meaning when used in other contexts. For convenience and clarity, this section introduces key concepts used in this report.
As noted above, lawmakers and observers are not consistent in their use of terms related to portfolio standards. Renewable portfolio standard (RPS) is the most frequently used term to describe a portfolio standard, though renewable energy standard, alternative energy portfolio standard, and others are in use.8 The term clean energy standard (CES) is frequently used to refer to a variant of RPS in which certain nonrenewable sources are eligible in addition to renewable sources, but some federal legislative proposals have used the term "clean energy" to refer only to renewable sources.9 The Appendix provides more information about previously introduced bills.
Banking refers to the extent to which credits issued in the program may be used for compliance after their vintage year (see definition, below). Banking provisions can equivalently be described in terms of expiration. For example, if credits expire after two years, then banking for two years is allowed. A related concept is borrowing which allows credits of future vintage years to be used for compliance.
Base quantity of electricity is the sales volume to which the portfolio standard applies. The base quantity could equal total electricity sales, but it need not. Excluding sources from the calculation of the base quantity changes the required amount of generation from eligible sources in absolute terms. The base quantity to which the portfolio standard applies also affects the financial incentive that different sources receive. Even sources deemed ineligible under the portfolio standard could receive some policy support if they were excluded from the base quantity of electricity. This concept is discussed further in the section "Base Quantity of Electricity."
Carve outs, tiers, multipliers, partial crediting, and usage limits are all policy options for influencing the relative support that different types of eligible sources receive under a portfolio standard. Eligible sources will be available at different costs. Policymakers may want to avoid a situation where compliance is achieved mostly through the use of a single, low-cost source. A carve out is a requirement within the overall policy requirement to achieve a minimum level of compliance by using a certain source. Carve outs have been used, for example, to require use of solar energy even when that was more expensive than other eligible sources. The same goal might be accomplished through use of tiers. Typically, a carve out will apply to a single source type while a tier might apply to multiple source types. A related concept is that of usage limits that set maximum levels for compliance from certain sources. Multipliers are rules under which selected sources receive more than the usual amount of credit for generating electricity, but the credits are completely fungible (see definition, below) with others. Sources that are eligible for multipliers would receive extra policy support, relative to other sources. Multipliers could be used, for example, to encourage demonstration and commercialization of new technologies. Partial crediting would give selected sources less than the usual amount of credit and could be applied to sources lawmakers wanted to give less policy support.
Clean energy, as used in this report, refers to the set of sources that lawmakers might choose to include in a portfolio standard. These sources could include wind, solar, geothermal, biomass, hydropower, marine energy, nuclear, natural gas combined cycle generators, or fossil fuel-fired generators equipped with carbon capture and sequestration technology (herein, CCS). Lawmakers could also choose to include nongenerating sources such as energy storage or energy efficiency. Other considerations about the choice of eligible sources are discussed in the section "Source Eligibility."
Covered entities are the entities with a compliance obligation under a portfolio standard. Most portfolio standards being implemented by states or proposed at the federal level have electricity distribution utilities as the covered entities. These utilities may or may not own electricity generators, depending on state and local regulatory regimes.10 Typically, a utility procures electricity from a number of different generators using a variety of energy sources (its portfolio). Other considerations about the choice of covered entities are discussed in the section "Utility Applicability."
Credits are the unit of accounting for portfolio standards and other market-based policies. Electricity cannot easily be traced from its point of generation to its point of consumption, so accounting measures are required to assess compliance with a portfolio standard. In many existing portfolio standards, credits are issued by an administrator to a generator that uses a clean energy source.11 The number of credits issued is based on actual measured electricity generation (i.e., ex post).12 The generator can then sell credits to a utility, and the utility surrenders them to the program administrator to demonstrate compliance. If a generator sells both electricity and associated credits to the same entity, the credit is bundled. If a generator sells electricity and associated credits to different entities, the credit is unbundled. Lawmakers could allow entities other than generators and utilities (e.g., financial institutions) to buy and sell credits, or they could allow only utilities with a compliance obligation to purchase credits. The price that utilities would pay for credits would depend on the portfolio standard stringency, the overall volume of electricity generated by clean energy sources, and other market factors. The sale of credits could create an additional source of revenue for a generator, potentially improving its economic performance relative to a business-as-usual scenario with no portfolio standard. In some cases, the ability to sell credits might be the deciding factor for whether a new generator would be constructed (or, for existing generators, whether a generator would remain operational instead of being retired). In other cases, generators may be profitable without the sale of credits, and the credits might create a windfall profit.13 The requirement to buy credits would likely increase the overall costs for a utility. Typically, a utility's costs for complying with a portfolio standard would be passed on to its customers.14 If a utility were unable to fully pass on its compliance costs, it might see reduced profitability.
Fungibility is the attribute of credits allowing them to be used interchangeably and without penalty. Since many state portfolio standards already exist, federal policymakers would have to decide if these state credits would be fungible with federal credits under a federal portfolio standard. If they were, then current holders of state-issued credits could use them for compliance with a federal portfolio standard or sell them to another entity for that purpose. If they were not, then state-issued credits could potentially lose value, depending on the relative stringency of a national portfolio standard and the state portfolio standard. Some states have implemented cap-and-trade programs in addition to portfolio standards, both of which aim to reduce greenhouse gas emissions from the electricity generation. Like portfolio standards, cap-and-trade uses credits (also called allowances) as an accounting mechanism and for compliance purposes. Under existing state policies and federal proposals, credits under portfolio standards are not fungible with allowances under cap-and-trade programs for greenhouse gases.15
Market-based policies attempt to use financial incentives to achieve policy goals. Many discussions contrast them with command-and-control policies that set specific permissions or prohibitions.16 Portfolio standards indirectly provide financial incentives because they create demand for generation from certain eligible sources in electricity markets, even if those eligible sources are more expensive than ineligible sources. Some observers argue this mechanism is a disruption of market forces.17 In comparison, tax credits, grants, and loan guarantees provide direct financial incentives for eligible sources and therefore lower the cost of those sources in the market. Most portfolio standard proposals do not expressly prohibit use of ineligible sources, but they do create a financial disincentive to use them.18
Monitoring, reporting, and verification (MRV) are three distinct steps that ensure that market-based policies achieve the desired goals. In the case of portfolio standards, MRV practices would measure the amount of electricity generated by eligible sources and verify that each unit of electricity from eligible sources was used only once for the purpose of compliance. Monitoring and reporting electricity generation is commonplace in the industry, at least for large-scale generators connected to the electricity transmission system.19 Verification for market-based policies is often completed by an independent third party.
Qualifying facilities (QFs) are established in the Public Utility Regulatory Policies Act of 1978 (P.L. 95-617; PURPA) as certain small power production facilities and cogeneration facilities that receive special treatment. Utilities must purchase electricity from QFs at a price determined by what the utility would otherwise have to pay for electricity.20 There is no direct relationship between QFs under PURPA and sources that would be eligible under a portfolio standard, though the term "qualifying source" is sometimes used in both contexts. To avoid confusion, this report refers to sources defined as clean energy under a portfolio standard as "eligible sources."
Registries, sometimes called tracking systems, are electronic databases used to facilitate credit issuance and transfer. State portfolio standards typically make use of registries in the following way. After an administrator verifies the amount of electricity generated from an eligible source, the administrator creates an appropriate number of credits. These credits are assigned a serial number and placed in the account of the appropriate entity in the registry. If the credit owner agrees to sell the credits to another entity, the owner files the necessary documentation with the administrator, who then authorizes the credits to be transferred to a different account in the registry. A covered entity would demonstrate compliance by transferring the required number of credits from its account to the administrator's account. The administrator would take action to retire the submitted credits to make sure they cannot be used again for compliance. Cybersecurity measures can help prevent theft of portfolio standard credits or other fraudulent activity. Some government agencies currently operate registries that could potentially be used to administer a national portfolio standard, and some private firms operate registries as well.
Vintage refers to the time period in which a tradeable credit in a market-based policy is issued. Portfolio standards typically have annual compliance periods, with vintage expressed in years. In policies with shorter or longer compliance periods, the vintage could be associated with a specific month or a series of years. For example, if an eligible source generated electricity in the year 2025, it would receive a vintage 2025 credit. The banking and borrowing rules (see definitions, above) determine the years in which credits of a given vintage may be used for compliance.
Portfolio Standard Design Elements
If Congress chose to establish a national portfolio standard, lawmakers would face choices about the design of the policy. This section discusses some key design elements and potential effects of different choices. Often, design choices reflect a balance between increasing the certainty of achieving policy goals and decreasing the likelihood that consumers will experience undesirable cost increases. Design elements can interact with each other, so the potential effect of a choice about one element may be influenced by choices about others.
Not all portfolio standard design choices must be made in legislation. Congress could direct an agency to promulgate regulations that implement a portfolio standard. The previous federal proposals summarized in the Appendix take different approaches. Some proposals made very few design choices and left most decisions to an agency, while others specified most design choices and left few decisions to an agency. Specifying details in legislation could add complexity that potentially impedes the legislative process or creates challenges in policy implementation. On the other hand, specifying details in legislation would give lawmakers greater control over policy design decisions.
Source Eligibility
Portfolio standards achieve their policy goals by increasing electricity generation from certain eligible energy sources, as defined by lawmakers. The various energy sources used for electricity generation have many different attributes that lawmakers might weigh in determining which sources could be eligible under a national portfolio standard. Recent state policy debates and many current discussions at the federal level have centered around three attributes: carbon intensity, technology maturity, and market competitiveness (i.e., cost).21
The debate around carbon intensity has focused on whether to include sources with a carbon intensity less than conventional coal-fired generators (i.e., low carbon sources), such as natural gas combined-cycle power plants, or include only those with a carbon intensity of zero (i.e., zero carbon sources).22 This debate closely relates to the desired environmental outcome of a portfolio standard. All else being equal, a portfolio standard that includes low carbon sources would likely result in higher greenhouse gas emissions from the electric power sector than a portfolio standard under which only zero carbon sources were eligible. Advocates for substantial greenhouse gas reductions disagree about whether all zero carbon sources should be eligible, with nuclear energy and CCS being particularly contentious.23 Advocates who support nuclear energy and CCS often present cost arguments, while advocates who oppose those sources often present arguments about environmental quality and environmental justice.24
The debates around technology maturity and market competitiveness both focus on the desired balance between supporting new technologies and supporting existing technologies. These debates closely relate to the desired economic and technological outcomes of a portfolio standard. Many mature technologies are less expensive than new technologies, so including them as eligible sources might achieve the policy goals at a lower overall cost.25 Mature technologies may be easier to deploy, from an operational point of view, since industry best practices and standards for their use are established. At the same time, a portfolio standard that includes mature technologies might not encourage the desired level of investment in new technologies. A compromise may be the use of carve outs, tiers, multipliers, partial crediting, or usage limits, as described above, to attempt to influence the extent to which covered entities used new or mature technologies for compliance.26
Energy storage and energy efficiency are not electricity sources, in the usual sense, because they do not generate electricity. Their supporters argue their deployment helps achieve similar policy goals as portfolio standards, namely technology innovation, greenhouse gas reduction, and job creation. Portfolio standards could incentivize energy storage and energy efficiency directly, for example, by defining them as eligible sources and providing an accounting methodology for issuing credits to them. Such accounting methodologies may be more complex than those used for electricity generation, especially for energy efficiency since energy savings cannot be directly measured.27 Alternatively, portfolio standards could indirectly incentivize deployment of energy storage or energy efficiency in the setting of the base quantity, as discussed in the section "Base Quantity of Electricity." If lawmakers wanted to incentivize their deployment, another option could be to establish separate targets for energy storage deployment and energy efficiency alongside a portfolio standard. Some states with portfolio standards have taken that approach, and some previous federal proposals took that approach as well.
Distributed energy resources (DER) are located near the point of consumption in the electric power sector (e.g., an individual home, commercial facility, or manufacturing plant). Federal portfolio standard proposals to date put a compliance obligation on electric utilities; however, utilities do not always own or operate DER. From the perspective of an electric utility, many DER are like energy efficiency in that they reduce electricity sales. Some, but not all, DER use renewable sources, so lawmakers might consider whether to include these as eligible sources.28 The electric power industry does not have established methodologies for measuring generation from DER, so these would need to be developed if DER were to receive credits. Alternatively, the setting of base quantities can influence the incentive DERs receive as discussed below.
Other energy source attributes may be of interest to Congress. These include energy density, which can affect land requirements, and the geographic variability in resource quality. As is also the case for other topics, geographic variability in natural resources can potentially raise concerns about uneven wealth impacts in portfolio standard policymaking. For example, the nation's wind resources most suitable for wind energy development are concentrated in the central United States and offshore of the Northeast and Mid-Atlantic.29 The nation's largest solar resources are concentrated in the Southwest.30 If eligible sources under a portfolio standard were all concentrated in one region (or, similarly, if a lack of eligible sources were concentrated in one region), wealth transfer could occur, raising potential concerns over fairness. Relatedly, some regions have developed some resources more than others, for example via implementation of state portfolio standards. Including existing sources, such as those incentivized under state policies, could potentially result in wealth transfer from states that had not previously implemented supportive policies. On the other hand, excluding existing sources could be perceived as penalizing early actors.
Utility Applicability
Most homes, businesses, and other consumers acquire electricity from the electric grid and pay electric utilities to provide that electricity to them. Over 3,200 electric utilities operate in the United States, and they are generally classified by three ownership models.31
- Investor-owned utilities (IOUs) are operated by private companies on a for-profit basis, and they deliver electricity in at least portions of every state except Nebraska.32
- Publicly owned utilities (POUs, sometimes municipal utilities or munis) are owned by local governments and operated on a not-for-profit basis.
- Electric co-operatives (co-ops, sometimes rural co-ops) are member-owned organizations operated on a not-for-profit basis, typically located in rural areas.
State governments allow IOUs to act as monopolies in their service territory, with no competition on electricity distribution, in exchange for accepting electricity rates as determined by state regulators.33 Similar to IOUs, POUs and co-ops are allowed to operate as monopolies with respect to electricity distribution. Unlike IOUs, they are generally exempt from regulation by state governments regarding electricity rates, investment decisions, and other operations. POUs and co-ops together serve about 27% of Americans.34
Lawmakers would have to decide to which type of utility a national portfolio standard would apply, if they chose to implement such a policy. If one class of utilities, such as co-ops, were excluded, then the overall effect of the policy might be reduced, since the excluded utilities could still procure electricity from ineligible sources above the levels set by the portfolio standard. On the other hand, excluding some utilities based on ownership model might be desirable in order to address concerns about overall compliance costs and cost distribution. POUs and co-ops often serve fewer customers than IOUs, so any fixed administrative costs associated with compliance must be shared by a smaller number of customers, resulting in relatively larger shares of administrative costs.35 Some state portfolio standards establish different (usually less stringent) targets for POUs and co-ops, while some exclude them altogether.
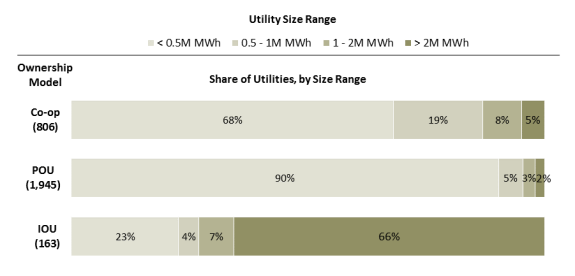
Utility size, expressed as annual electricity sales, could be a more precise characteristic than ownership model in addressing concerns about higher administrative costs for smaller utilities, since some IOUs are small and some POUs are large. Figure 2 shows the share of utilities of each ownership model for selected utility size ranges. Table 1 shows the total number of utilities of each ownership model in the selected size ranges.
Previous legislation has included different utility size thresholds for inclusion. Utilities that did not meet the specified size threshold would not have had a compliance obligation under those proposals. For example, S. 2146 in the 112th Congress would have initially included utilities with at least 2 million megawatt-hours (MWh) of sales and then phased in smaller utilities of at least 1 million MWh of sales. The provisions of Title I of the Public Utility Regulatory Policies Act of 1978 (PURPA; P.L. 95-617) apply to utilities with at least 0.5 million MWh of sales.
|
Figure 2. Share of U.S. Distribution Utilities for Selected Size Ranges Based on 2017 Electricity Sales |
 |
|
Source: CRS analysis of data from EIA, Annual Electric Power Industry Report, https://www.eia.gov/electricity/data/eia861/. Notes: M MWh = million megawatt-hours; POU = publicly owned utility; IOU = investor-owned utility. Numbers in parentheses show the number of utilities of each ownership model included in this analysis. POUs include EIA categories "municipal," "political subdivision," and "state." Electricity sales from EIA categories "behind the meter providers," "community choice aggregators," "federal power marketing authorities," "retail energy providers," and "wholesale power marketer" are not included in this analysis because those entities are generally not distribution utilities. This analysis does not account for utilities owned by the same holding company (i.e., affiliated utilities). The sales thresholds in this analysis were selected because they were used in previous legislation, but they are for illustration only. |
Table 1. Count of U.S. Distribution Utilities for Selected Size Ranges
Based on 2017 Electricity Sales
|
|
|
|
|
|
|||||||
|
|
|
|
|
|
|||||||
|
|
|
|
|
|
|||||||
|
|
|
|
|
|
Source: CRS analysis of data from EIA, Annual Electric Power Industry Report, https://www.eia.gov/electricity/data/eia861/.
Notes: M MWh = million megawatt-hours; POU = publicly owned utility; IOU = investor-owned utility. Numbers in parentheses show the number of utilities of each ownership model included in this analysis. POUs include EIA categories "municipal," "political subdivision," and "state." Electricity sales from EIA categories "behind the meter providers," "community choice aggregators," "federal power marketing authorities," "retail energy providers," and "wholesale power marketer" are not included in this analysis because those entities are generally not distribution utilities. This analysis does not account for utilities owned by the same holding company (i.e., affiliated utilities). The sales thresholds in this analysis were selected because they were used in previous legislation, but they are for illustration only.
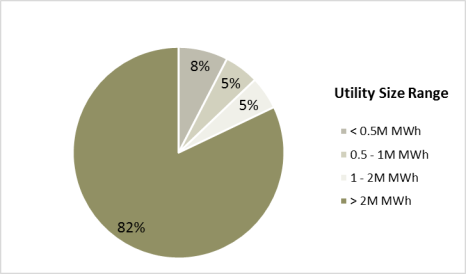
A potential consideration is the share of total U.S. electricity sales that would be covered by a portfolio standard if utility size thresholds were established. Figure 3 shows the share of total U.S. electricity sales associated with utilities of different sizes, for all ownership models. In 2017, 82% of U.S. electricity sales came from distribution utilities that had annual sales volumes greater than 2 million MWh, 87% came from utilities with sales greater than 1 million MWh, and 92% came from utilities with sales greater than 0.5 million MWh.
|
Figure 3. U.S. Electricity Sales by Distribution Utility Size Based on 2017 Electricity Sales |
 |
|
Source: CRS analysis of data from EIA, Form EIA-861, https://www.eia.gov/electricity/data.php. Notes: M MWh = million megawatt-hours. Electricity sales from EIA categories "behind the meter providers," "community choice aggregators," "federal power marketing authorities," "retail energy providers," and "wholesale power marketer" are not included in this analysis because those entities are generally not distribution utilities. The sales thresholds in this analysis were selected because they were used in previous legislation, but they are for illustration only. |
Target and Stringency
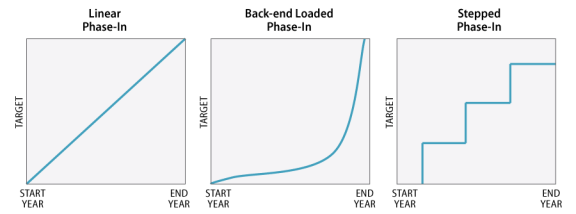
The target of a portfolio standard refers to "how much?" and "by when?" A target might be defined for a single year (e.g., 50% of electricity sales in 2050), or it might be phased in over multiple interim periods (e.g., 25% of electricity sales in 2020–2029; 40% of electricity sales in 2030–2039; 80% of electricity sales in 2040–2049). Target phase-in can be implemented in different approaches, as shown in Figure 4. Each of these approaches has different implications for how individual source types might be affected, though actual outcomes would be influenced by other factors such as future technology costs and electricity demand.36 Linear phase-in would tend to benefit existing sources and mature technologies with relatively short development timelines, such as wind and solar. These sources could be available to generate electricity and meet near-term compliance obligations. A back-end loaded phase-in might avoid near-term electricity price increases and allow time for commercialization of new technologies, but it might not result in desired environmental results in the near term. A stepped phase-in could balance the advantages and disadvantages of the other two options. It might also lead to uneven investment patterns, with periods of relatively high project development associated with target increases followed by periods of relatively low project development during target plateau periods.
|
Figure 4. Examples of Conceptual Approaches to Phasing in Targets |
 |
|
Source: CRS. |
The stringency of a policy indicates the changes the policy might make in generation profile compared to a business-as-usual scenario. Generally, the stringency of the policy will be positively correlated to the costs and benefits of implementing the policy, so as policy stringency increases, the costs and benefits will also increase.37 For example, a portfolio standard target of 50% of electricity sales by 2050 would likely cost more to implement than a target of 25% of electricity sales by 2050, all else being equal. Similarly, a portfolio standard target of 30% of electricity sales by 2030 would likely cost more to implement than a target of 30% of electricity sales by 2050. At the same time, the more stringent options (i.e., the higher target percentage or the earlier target date) could result in greater technology innovation and lower greenhouse gas emissions than the less stringent options.
Another way to describe portfolio standards' stringency is the net change in generation from eligible sources.38 This approach acknowledges that the national electricity generation profile is currently quite diverse with many types of sources. The net change is the difference between the final requirement of the portfolio standard (i.e., the target) and the share of generation from eligible sources before the policy is implemented. Suppose a portfolio standard required 20% of generation to come from wind and solar sources by 2020. These sources contributed 9% of electricity generation in 2018,39 so the net change required by such a portfolio standard would be 11%. The different ways to describe portfolio standard stringency could influence public perception of it. In this example, the same target could either be described as 20% or 11%, with potentially different implications for perceived costs and benefits.
Base Quantity of Electricity
For portfolio standards that express compliance obligation as the percentage of electricity sales coming from clean energy sources, the base quantity is the denominator used to calculate the compliance obligation. The base quantity of electricity can determine the amount of generation from eligible sources a portfolio standard requires in absolute terms. It has been described as "perhaps the most important and least understood concept in the design of a [portfolio standard]."40 The base quantity could equal total electricity sales, but it need not. The base quantity could instead be a specified subset of total sales. Some portfolio standard proposals have excluded electricity generated from certain sources in the base quantity calculation (see Appendix). Under such an approach, a utility with a compliance obligation would be incentivized to procure electricity from sources excluded from the base quantity because doing so would lower the amount of electricity from clean sources it would have to procure.
To illustrate this point, consider a hypothetical portfolio standard with a 50% clean energy requirement. The compliance obligation for this portfolio standard would be expressed as
 |
If a utility sold 10 million MWh annually and the base quantity of electricity equaled the total sales, then the utility would have to procure 5 million MWh from clean energy sources.
If electricity from certain sources were excluded from the base quantity, the required procurement changes. If a utility procured 1 million MWh of the 10 million MWh it sold from sources excluded from the base quantity, then the utility would have to procure 4.5 million MWh from clean energy sources. The portfolio standard, in this case, would incentivize the utility to procure electricity from both kinds of sources, namely those excluded from the base quantity and those defined as clean energy by the policy.
The utility's incentive to procure electricity from sources excluded from the base quantity would generally be less than the incentive to procure electricity from clean energy sources, depending upon the cost of different energy sources and the overall portfolio standard stringency.41 If policymakers wanted to provide some policy support to certain sources, but less support than other sources receive, they might exclude certain sources from the base quantity calculation.
A related consideration is the treatment of energy efficiency (EE) and DER (including, potentially, customer-sited energy storage). These result in reduced utility sales, so, to some extent, they are inherently included in the base quantity calculation. Utility investments that increased EE or generation from DER could also help the utility achieve compliance with a portfolio standard by reducing the amount of electricity it would have to procure from clean energy sources. For many utilities, reducing sales reduces the company's profitability, but some regulatory models are being developed and implemented in which profitability can be maintained or can increase as use of EE and DER increases.42
Cost Containment Mechanisms
Future electricity demand, technology development, and technology costs are all uncertain. Ultimately, these uncertainties result in uncertainties around the cost to consumers of a portfolio standard, which could be an important consideration for lawmakers. To protect consumers from undesirably high electricity costs, portfolio standards can include provisions that reduce stringency in response to high costs. These various provisions are sometimes called safety valves.
Safety valves need not be included in legislation, since Congress could amend a law establishing a portfolio standard in response to any concerns that developed. Including safety valves in legislation could, however, promote regulatory certainty for covered entities and consumers, because legislative action to address any concerns that might arise could potentially be a lengthy process. Another option could be for Congress to explicitly authorize an agency to implement safety valves.
An alternative compliance payment (ACP) allows a utility to pay a fee in lieu of surrendering credits. The degree of cost control it might provide would depend on the level at which an ACP were set. For example, if electricity generation from eligible sources were available at 5 cents per kilowatt-hour (cents/kWh) and an ACP were 10 cents/kWh, utilities would likely procure electricity from the eligible sources instead of paying the ACP. If, however, the ACP were 3 cents/kWh, utilities would likely pay the ACP and procure electricity from ineligible sources. Use of ACP could be unlimited, or it could be limited to a certain share of overall compliance.
If an ACP were included in a national portfolio standard, lawmakers would also have to decide how any collected revenue would be disbursed. One option would be to use the revenue to further desired policy goals, for example by funding greenhouse gas reduction programs or technology research and development. Another option would be to return the revenue to electricity consumers as a way of further reducing the cost impacts of a portfolio standard. Other options include treating it as general fund revenue, deficit or debt reduction, or other spending.43
Portfolio standards could include provisions to suspend or delay compliance with targets under certain conditions. These conditions could include compliance costs reaching a specified threshold or identification of reliability risks.
Some cost containment for portfolio standards comes from the use of tradable credits to demonstrate compliance, especially if a portfolio standard allows unbundled credits. A low cost eligible source might be located outside of a utility's service territory. When utilities can use unbundled credits, they can demonstrate compliance by surrendering credits from this low cost source. The alternative, namely, disallowing tradable credits, could require utilities to procure electricity from high cost sources or could require the development of more sources than would be required to meet electricity demand, resulting in overall higher costs for consumers. One argument against unbundled credits is that they might not address concerns over localized concentrations of co-pollutants from conventional generators, known as hot spots. For example, if a utility procured electricity from an ineligible source that also emitted harmful air pollutants such as particulate matter or nitrogen dioxide, and the utility complied with the portfolio standard with credits associated with eligible sources located outside its service territory, hot spots might not be reduced to the extent they might be if unbundled credits were not allowed.
Banking or borrowing could also decrease overall compliance costs. For instance, in years when utilities had access to many credits from low cost eligible sources, relative to what were required by the target, utilities might bank credits. If fewer credits were available in future years, relative to what were required by the target, a utility could surrender the banked credits, resulting in lower compliance costs. Banking could reduce a utility's exposure to volatility that can occur in electricity markets. This reduced risk can also reduce overall compliance costs, since a utility would not have to take other actions to reduce its risk exposure.44 To the extent that banking or borrowing could reduce the net change in generation, it might lead to reduced environmental benefits and reduced incentive for technology innovation.
Alternatively, lawmakers could establish mechanisms to increase the stringency of a portfolio standard if certain thresholds were passed. Stringency could be increased by increasing the target to a higher percentage of electricity sales or moving the deadline to achieve the target to an earlier year. The trigger for such an action could be credit price, greenhouse gas emissions levels, technology development, or other thresholds.45 This might be one way to increase the desired benefits of a portfolio standard in cases where compliance costs were unexpectedly low. It might also create uncertainty for covered entities and potentially result in unintended consequences such as market participants avoiding actions they might otherwise take in order to avoid triggering a change in stringency.
Selected Policy Considerations
The previous section discussed some potential effects of different choices about design elements for a portfolio standard. A key theme in discussion of design elements is the balance between achieving policy objectives and minimizing electricity cost increases for consumers, assuming a portfolio standard were implemented. The potential effects discussed in this section might be characterized instead as the potential effect of a portfolio standard compared to business as usual. While the previous section addressed the question "How can a portfolio standard be designed?," this section addresses the question "What might happen if a portfolio standard were implemented?"
Any projections of the effects of a policy on the U.S. electric power sector are subject to uncertainty around various factors. These include future economic activity, electricity demand, energy costs (e.g., natural gas prices), and technology costs. Some factors may be more strongly influenced by decisions made by foreign governments than by the federal government. For example, international demand for electricity from solar energy could lower the cost to produce solar panels, or countries with large critical mineral resources could impose export bans, increasing the cost in the United States of any technology using those minerals.46
Potential Economic Effects
The overall effect on the American economy of a national portfolio standard would be influenced by multiple factors. Increased electricity costs could reduce economic activity, depending on the price response throughout the economy. Potential price responses are reduced electricity consumption, increased investment in efficiency measures, or reduced spending on other goods or services. Some price responses might have minimal effect on overall economic activity, for example if consumers shifted spending from electricity consumption to energy efficiency improvements.
Potential economic effects might not be uniformly distributed. There could be regional differences in electricity price changes, given the geographic variability in energy resources. Utilities in regions with relatively less potential to develop eligible sources (i.e., regions in which eligible sources are relatively costlier) might buy credits from eligible generators in other regions. The cost of credits might result in higher electricity prices for customers of the utility buying credits. At the same time, customers of any utilities selling credits might see lower electricity prices.47 As discussed above, the ability to use unbundled credits for compliance could reduce overall compliance costs relative to the case where only bundled credits were allowed because utilities across the country could take advantage of low cost eligible sources. At the same time, unbundled credits could result in wealth transfer between different regions of the country.48 Policy design choices might affect any potential wealth transfer. Electricity prices already vary across the country as a result of differences in resource availability, electricity demand, and utility regulatory models.49
There might also be differences in cost distribution among household income levels. Generally, poorer Americans spend a larger portion of their income on electricity than wealthier Americans, so electricity cost increases could disproportionately affect them.50
Within the electric power sector, businesses associated with eligible sources might be positively affected while businesses associated with ineligible sources might be negatively affected. The affected businesses might be individual generators and also firms associated with their supply chains. For negatively affected businesses, the potential impacts might include loss of capital investment (sometimes referred to as stranded costs) and reduced employment. Communities surrounding a negatively affected generator might experience negative effects such as loss of tax revenue base and increased demands on social services.51 For positively affected businesses and communities, the opposite might be true, namely increased capital investment, increased employment, and other positive economic effects. Additionally, American businesses that develop goods or services used to comply with a portfolio standard could potentially expand into international markets, depending on whether eligible sources also experienced demand growth internationally. Depending on policy design details, local electricity market factors, and local energy resources, some existing businesses in the electric power sector could experience negligible effects of a potential national portfolio standard.
Potential Environmental Effects
Proponents of portfolio standards describe multiple environmental benefits, such as reduced greenhouse gas (GHG) emissions (i.e., climate change mitigation) and reduced air pollutants (i.e., improved air quality). The extent to which a portfolio standard might produce potential environmental benefits would depend in part on choices about source eligibility and stringency.52 Potential eligible sources vary in their GHG and air pollutant emissions, as well as other attributes such as water consumption and power density (which can affect land requirements). Implementation could affect environmental outcomes too. For example, some eligible sources might be deployable in either large-scale or small-scale installations, with differing effects on environmental factors such as land use. Some would argue these potential effects should be compared with potential effects of other energy options. A comprehensive comparison of potential environmental effects of various energy sources is beyond the scope of this report.
Interaction with State Portfolio Standards
The conditions under which federal law preempts state law can vary, and determination of federal preemption can be complex.53 Twenty-nine states, three U.S. territories, and the District of Columbia are currently implementing mandatory portfolio standards, and an additional eight states and one territory have voluntary versions.54 As of September 6, 2019, nine of these have targets of 100%.55 If Congress implemented a national portfolio standard, it could expressly preempt existing state portfolio standards. If a national portfolio standard were enacted that did not preempt state portfolio standards, utilities in states with existing portfolio standards might have to comply with both simultaneously.56 In practice, whichever standard had the higher stringency would determine the amount of eligible sources in a utility's portfolio. In this case, the relevant stringency could be either the required percentage of generation from eligible sources or the set of eligible sources itself. For example, some existing state portfolio standards include nuclear energy as an eligible source. If a national portfolio standard did not include nuclear energy, then a utility might be out of compliance with the federal standard even if it were in compliance with the state standard and the state and federal standard required the same amount of electricity from eligible sources. Assuming a generator were eligible for both a state and national program, a utility could procure electricity (or credits) from that generator to demonstrate compliance with both. In other words, the presence of two portfolio standards would not necessarily double the amount of procurement from eligible sources required. A utility covered under two portfolio standards might, however, face increased administrative costs associated with compliance.57
Although few technical barriers exist to the simultaneous operation of state and federal portfolio standards,58 other concerns may make this undesirable. Administrative cost burden for covered entities is one such concern. Another might be confusion for eligible sources about whether and how to receive credits for two portfolio standards. If Congress chose to preempt state programs, this could potentially disrupt project finances for recently developed or proposed sources and lead to investment losses in clean energy industries. Congress might also consider exempting utilities facing state portfolio standards of equal or greater stringency than the federal portfolio standards. Congress could also allow credits issued by states to be used for compliance with a federal program. This option would, effectively, allow a utility to use one credit to demonstrate compliance with two portfolio standards, though it could also reduce the policy outcomes relative to a utility having two distinct compliance obligations. An option included in some of the bills listed in the Appendix is to compensate utilities facing a state standard with a specified number of federal credits. Alternatively, Congress could choose not to explicitly address the question, and instead let state governments or judicial review decide whether state programs would be suspended if a national one were implemented.
Interaction with Other State Energy Policies
Under current law, state and local governments have authority for approving electricity generation and transmission assets.59 Compliance with a national portfolio standard might require new generation and transmission assets, but it is unclear to what extent state approval processes would consider national clean energy policy goals. Some stakeholders have argued that state approval processes for new electricity transmission lines, in particular, create barriers for deployment of certain electricity generation sources, especially wind.60 To the extent that a national portfolio standard required new transmission capacity, interest might increase in a stronger federal role in approving electricity transmission infrastructure. Congress has considered this in the past. For example, the Energy Policy Act of 2005 (P.L. 109-58) authorized federal approval for some transmission infrastructure under certain conditions, though this authority has never been used.61 As noted in "Potential Environmental Effects" a national portfolio standard might alternatively incentivize distributed energy development or projects in other locations that might not require new transmission capacity.
Some states have adopted policies to create competition among electricity generators, an effort known as deregulation or restructuring. In these states (and some portions of states), competitive electricity markets create price signals meant to, among other things, drive long-term investment decisions. Congress demonstrated support for restructuring efforts in the Energy Policy Act of 1992 (P.L. 102-486). Portfolio standards require utilities to purchase electricity from sources that might be more expensive than other sources. This creates so-called out-of-market payments, sometimes characterized as subsidies, for eligible sources that could distort the operation of electricity markets.62 Eligible sources would still compete with each other for market share, creating some competitive pressure on prices among eligible sources.
Appendix. Legislative Proposals in the 105th-116th Congresses
This section lists previously introduced legislation that would have established national portfolio standards. CRS searched congress.gov using the phrases "renewable portfolio standard," "clean energy standard," "renewable energy standard," "renewable electricity standard," "renewable energy," and "clean energy," in full bill text or bill summaries for all Congresses. The earliest bill identified in this search was introduced in the 105th Congress. Search results were refined by including only the Subject-Policy Area terms "Energy" and "Environmental Protection." Table A-1 provides selected policy design elements of the bills that would have established national portfolio standards that were identified using this search methodology. Bills are listed in order of introduction by Congress, with House bills listed first and Senate bills listed second. This table only provides information related to the bills' portfolio standards. Some of the bills in the table had multiple provisions, including some that might also affect the electric power sector, but those are not described here.
Table A-1. Renewable Portfolio Standard and Clean Energy Standard Bills from the 105th Through 116th Congresses
|
Bill, Sponsor, |
Short Title |
Final Target |
Eligible Sources |
|
116th Congress (as of September 6, 2019) |
|||
|
Lieu |
Climate Solutions Act of 2019 |
100% in 2035 and thereafter |
Renewable sources (no further specification) |
|
Luján |
Clean Energy Standard Act of 2019 |
100%, target date varies by utility (behind-the-meter generation included in base quantity) |
Solar, wind, ocean, current, wave, tidal, geothermal, qualifying biomass, hydropower, nuclear, qualifying waste-to-energy, qualifying low-carbon fuels, qualifying combined heat and power, any other source with a carbon intensity less than 0.4 metric tons of carbon dioxide equivalent per megawatt-hour |
|
Smith |
Clean Energy Standard Act of 2019 |
100%, target date varies by utility (behind-the-meter generation included in base quantity) |
Solar, wind, ocean, current, wave, tidal, geothermal, qualifying biomass, hydropower, nuclear, qualifying waste-to-energy, qualifying low-carbon fuels, qualifying combined heat and power, any other source with a carbon intensity less than 0.4 metric tons of carbon dioxide equivalent per megawatt-hour |
|
Udall |
Renewable Electricity Standard Act |
1.5 percentage points greater than 2019 levels in 2020; increasing by 2 percentage points annually for 2021-2029 and by 2.5 percentage points annually for 2030-2035 (voluntary customer purchases of electricity from renewable sources excluded from base quantity) |
Solar, wind, ocean, tidal, geothermal, qualifying biomass, landfill gas, qualifying hydropower, hydrokinetic, qualifying energy efficiency |
|
115th Congress (2017-2018) |
|||
|
H.R. 2746 |
American Renewable Energy and Efficiency Act |
35% in 2032-2042, and provides option that FERC could set higher requirements during those years (existing hydropower and waste-to-energy using municipal solid waste excluded from base quantity) |
Wind, solar, geothermal, qualifying biomass, qualifying biogas, qualifying biofuels, qualifying hydropower, ocean, landfill gas |
|
H.R. 2958 |
Climate Solutions Act of 2017 |
80% in 2050 and thereafter |
Renewable sources (no further specification) |
|
114th Congress (2015-2016) |
|||
|
H.R. 1971 |
Climate Solutions Act of 2015 |
80% in 2050 and thereafter |
Renewable sources (no further specification) |
|
H.R. 3426 |
American Renewable Energy and Efficiency Act |
30% in 2030-2040, and provides option that FERC could set higher requirements during those years (existing hydropower and waste-to-energy using municipal solid waste excluded from base quantity) |
Wind, solar, geothermal, qualifying biomass, qualifying biogas, qualifying biofuels, qualifying hydropower, ocean, landfill gas |
|
S. 1264 |
Renewable Electricity Standard Act |
30% in 2030-2039 (existing hydropower and waste-to-energy using municipal solid waste excluded from base quantity) |
Solar, wind, ocean, geothermal, qualifying biomass, landfill gas, qualifying hydropower |
|
113th Congress (2013-2014) |
|||
|
H.R. 3654 |
Renewable Electricity Standard Act of 2013 |
25% in 2025-2039 (existing hydropower and waste-to-energy using municipal solid waste excluded from base quantity) |
Solar, wind, ocean, geothermal, qualifying biomass, landfill gas, qualifying hydropower |
|
H.R. 5072 |
American Renewable Energy and Efficiency Act |
25% in 2025-2040, and provides option that FERC could set higher requirements during those years (existing hydropower and waste-to-energy using municipal solid waste excluded from base quantity) |
Wind, solar, geothermal, qualifying biomass, qualifying biogas, qualifying biofuels, qualifying hydropower, ocean, landfill gas |
|
H.R. 5301 |
American Renewable Energy and Efficiency Act |
25% in 2025-2040, and provides option that FERC could set higher requirements during those years (existing hydropower and waste-to-energy using municipal solid waste excluded from base quantity) |
Wild, solar, geothermal, qualifying biomass, qualifying biogas, qualifying biofuels, qualifying hydropower, ocean, landfill gas |
|
S. 1595 |
Renewable Electricity Standard Act of 2013 |
25% in 2025-2039 (existing hydropower and waste-to-energy using municipal solid waste excluded from base quantity) |
Solar, wind, ocean, geothermal, qualifying biomass, landfill gas, qualifying hydropower |
|
S. 1627 |
American Renewable Energy and Efficiency Act |
25% in 2025-2040, and provides option that FERC could set higher requirements during those years (existing hydropower and waste-to-energy using municipal solid waste excluded from base quantity) |
Wind, solar, geothermal, qualifying biomass, qualifying biogas, qualifying biofuels, qualifying hydropower, ocean, landfill gas |
|
112th Congress (2011-2012) |
|||
|
H.R. 5967 |
American Renewable Energy and Efficiency Act |
50% in 2035-2040 (existing hydropower, waste-to-energy using municipal solid waste, new nuclear excluded from base quantity) |
Wind, solar, geothermal, qualifying biomass, qualifying biogas, qualifying biofuels, qualifying hydropower, ocean, landfill gas |
|
S. 559 |
Securing America's Future with Energy and Sustainable Technologies Act |
25% in 2025 (existing hydropower excluded from base quantity) |
Solar, wind, geothermal, ocean, qualifying biomass, landfill gas, waste-to-energy using municipal solid waste, qualifying hydropower |
|
S. 741 |
N/A |
25% in 2025-2039 (existing hydropower and waste-to-energy using municipal solid waste excluded from base quantity) |
Solar, wind, ocean, geothermal, qualifying biomass, landfill gas, qualifying hydropower |
|
S. 2146 |
Clean Energy Standard Act of 2012 |
84% in 2035 (existing hydropower and existing nuclear excluded from base quantity) |
Solar, wind, ocean, current, wave, tidal geothermal, qualifying biomass, natural gas, hydropower, nuclear, qualifying waste-to-energy, qualifying combined heat and power, CCS, "a source of energy, other than biomass, with lower annual carbon intensity than 0.82 metric tons of carbon dioxide equivalent per megawatt-hour" |
|
111th Congress (2009-2010) |
|||
|
H.R. 890 |
American Renewable Energy Act |
25% in 2025-2039 (existing hydropower and waste-to-energy using municipal solid waste excluded from base quantity) |
Wind, solar, geothermal, qualifying biomass, landfill gas, qualifying hydropower, ocean |
|
H.R. 2454 |
American Clean Energy and Security Act of 2009 |
20% in 2021-2039 (some hydropower, new nuclear, and CCS excluded from base quantity) |
Wind, solar, geothermal, qualifying biomass, qualifying biogas, qualifying biofuels, qualifying hydropower, marine and hydrokinetic |
|
S. 20 |
Clean Energy Standard Act of 2010 |
50% in 2050 (existing hydropower and waste-to-energy using municipal solid waste excluded from base quantity) |
Solar, wind, geothermal, ocean, qualifying biomass, landfill gas, qualifying hydropower, coal-mined methane, qualifying waste-to-energy, new nuclear, advanced coal, eligible retired fossil fuel, "another clean energy source based on innovative technology as determined by the Secretary through rulemaking" |
|
S. 433 |
N/A |
25% in 2025-2039 (existing hydropower and waste-to-energy using municipal solid waste excluded from base quantity) |
Solar, wind, ocean, geothermal, qualifying biomass, landfill gas, qualifying hydropower |
|
S. 826 |
American Renewable Energy Act of 2009 |
25% in 2025 (existing hydropower excluded from base quantity) |
Solar, wind, geothermal, ocean, qualifying biomass, landfill gas, waste-to-energy using municipal solid waste, qualifying hydropower |
|
S. 1462 |
American Clean Energy Leadership Act of 2009 |
15% in 2021-2039 (existing hydropower, waste-to-energy using municipal solid waste, qualifying fossil fuel with CCS, new nuclear excluded from base quantity) |
Solar, wind, geothermal, ocean, qualifying biomass, landfill gas, qualifying hydropower, coal-mined methane, qualifying waste-to-energy, other sources as determined by the Secretary via rulemaking |
|
S. 3464 |
Practical Energy and Climate Plan Act of 2010 |
50% in 2050 (existing hydropower excluded from base quantity) |
Advanced coal, biomass, coal mine methane, efficiency, geothermal, landfill gas, biogas, ocean, qualified hydropower, new nuclear, solar, waste-to-energy, wind, "any other source that will result in at least a 80% reduction in greenhouse gas emissions compared to average emissions of freely emitting sources in the calendar year prior to certification of the Secretary" |
|
S. 3576 |
Securing America's Future with Energy and Sustainable Technologies Act |
25% in 2025 (existing hydropower excluded from base quantity) |
Solar, wind, geothermal, ocean, qualifying biomass, landfill gas, waste-to-energy using municipal solid waste, qualifying hydropower |
|
S. 3813 |
Renewable Electricity Promotion Act of 2010 |
15% in 2021-2039 (existing hydropower, CCS, new nuclear excluded from base quantity) |
Solar, wind, geothermal, ocean, qualifying biomass, landfill gas, qualifying hydropower, coal-mined methane, qualifying waste-to-energy, other sources as determined by the Secretary via rulemaking |
|
110th Congress (2007-2008) |
|||
|
Energy Independence and Security Act of 2007 |
15% in 2020-2039 (existing hydropower and waste-to-energy using municipal solid waste excluded from base quantity) |
Solar, wind, ocean, tidal, geothermal, qualifying biomass, landfill gas, incremental hydropower, hydrokinetic energy, qualifying energy efficiency |
|
|
H.R. 969 |
N/A |
20% in 2020 and thereafter (existing hydropower excluded from base quantity) |
Solar, wind, ocean, geothermal, qualifying biomass, landfill gas, qualifying hydropower |
|
H.R. 1133 |
Freedom through Renewable Energy Expansion (FREE) Act |
20% in 2016-2031 (existing hydropower and waste-to-energy using municipal solid waste excluded from base quantity) |
Solar, wind, geothermal, ocean, qualifying biomass, landfill gas, qualifying hydropower |
|
H.R. 1590 |
Safe Climate Act of 2007 |
20% in 2020 and thereafter |
Renewable sources (no further specification) |
|
H.R. 2809 |
New Apollo Energy Act of 2007 |
20% in 2020-2030 (existing hydropower and waste-to-energy using municipal solid waste excluded from base quantity) |
Solar, wind, geothermal, ocean, qualifying biomass, landfill gas, qualifying hydropower |
|
H.R. 2950 |
Renewable Fuels, Consumer Protection, and Energy Efficiency Act of 2007 |
15% in 2020-2030 (existing hydropower excluded from base quantity) |
Solar, wind, geothermal, ocean, qualifying biomass, landfill gas, qualifying hydropower |
|
H.R. 3221(Engrossed House bill) |
Housing and Economic Recovery Act of 2008 |
15% in 2020-2039 (existing hydropower and waste-to-energy using municipal solid waste excluded from base quantity) |
Solar (including solar water heating), wind, ocean, tidal, geothermal, qualifying biomass, landfill gas, incremental hydropower, qualifying energy efficiency |
|
H.R. 6899 |
Comprehensive American Energy Security and Consumer Protection Act |
15% in 2020-2039 (existing hydropower and waste-to-energy using municipal solid waste excluded from base quantity) |
Solar, wind, ocean, geothermal, qualifying biomass, landfill gas, qualifying hydropower, hydrokinetic |
|
H.R. 7239 |
American Energy, American Innovation Act of 2008 |
20% in 2020 and thereafter (existing hydropower excluded from base quantity) |
Solar, wind, ocean, geothermal, qualifying biomass, landfill has, qualifying hydropower |
|
S. 309 |
Global Warming Pollution Reduction Act |
20% in 2020 and thereafter |
Solar, wind, qualifying biomass, landfill gas, ocean, geothermal, qualifying hydropower |
|
S. 485 |
Global Warming Reduction Act of 2007 |
20% in 2021 and thereafter |
Solar, wind, qualifying biomass, landfill gas, ocean, geothermal, qualifying hydropower |
|
S. 1201 |
Clean Power Act of 2007 |
20% in 2020 and thereafter |
Solar, wind, qualifying biomass, landfill gas, ocean, geothermal, qualifying hydropower |
|
S. 1554 |
Energy Independence, Clean Air, and Climate Security Act of 2007 |
20% in 2020-2030 (existing renewables and existing hydropower excluded from base quantity) |
Solar, wind, ocean, geothermal, qualifying biomass, landfill gas, qualifying hydropower |
|
S. 1567 |
N/A |
25% in 2025 (waste-to-energy using municipal solid waste and existing hydropower excluded from base quantity) |
Solar, wind, geothermal, ocean, qualifying biomass, landfill gas, qualifying hydropower |
|
S. 1602 |
Clean, Reliable, Efficient and Secure Energy Act of 2007 |
20% in 2030 and thereafter |
Solar, wind, ocean, geothermal, fuel cells, solid waste, renewable natural gas, landfill gas, qualifying hydropower, qualifying coal- or gas-fired generation facility capable of future CCS, new nuclear |
|
S. 2642 |
American Renewable Energy Act of 2008 |
20% in 2024 (waste-to-energy using municipal solid waste and existing hydropower excluded from base quantity) |
Solar, wind, geothermal, ocean, qualifying biomass, landfill gas, qualifying hydropower |
|
109th Congress (2005-2006) |
|||
|
H.R. 983 |
N/A |
20% in 2027 and thereafter |
Solar, wind, ocean, geothermal, qualifying biomass, landfill gas, qualifying hydropower |
|
H.R. 2828 |
New Apollo Energy Act of 2005 |
10% in 2022; Secretary may establish regulations requiring not less than 10% for 2022-2030 (existing renewables and existing hydropower excluded from base quantity) |
Solar, wind, ocean, geothermal, qualifying biomass, landfill gas, qualifying hydropower |
|
H.R. 4384 |
Energy for Our Future Act |
20% in 2030 (existing renewables and hydropower excluded from base quantity) |
Solar, wind, ocean, geothermal, qualifying biomass, landfill gas, qualifying hydropower |
|
H.R. 5642 |
Safe Climate Act of 2006 |
20% in 2020 and thereafter |
Renewable sources (no further specification) |
|
H.R. 5926 |
Freedom through Renewable Energy Expansion (FREE) Act |
20% in 2015 and thereafter (existing hydropower and waste-to-energy using municipal solid waste excluded from base quantity) |
Solar, wind, geothermal, ocean, qualifying biomass, landfill gas, qualifying hydropower |
|
H.R. 5927 |
American Energy Independence Act |
25% in 2020 and thereafter (existing hydropower excluded from base quantity) |
Solar, wind, geothermal, ocean, qualifying biomass, landfill gas, qualifying hydropower |
|
S. 427 |
Renewable Energy Investment Act of 2005 |
20% in 2020 and thereafter (existing hydropower excluded from base quantity) |
Wind, ocean, qualifying biomass, solar, landfill gas, qualifying hydropower, geothermal, hydrogen produced from one of the above energy sources |
|
S. 2747 |
Enhanced Energy Security Act of 2006 |
10% in 2020-2030 (existing hydropower and waste-to-energy using municipal solid waste excluded from base quantity) |
Solar, wind, geothermal, ocean, qualifying biomass, landfill gas, qualifying hydropower |
|
S. 3698 |
Global Warming Pollution Reduction Act |
20% in 2020 and thereafter |
Solar, wind, qualifying biomass, landfill gas, ocean, geothermal, qualifying hydropower |
|
S. 4039 |
Global Warming Reduction Act |
20% in 2020 and thereafter |
Solar, wind, geothermal, ocean, qualifying biomass, landfill gas, qualifying hydropower |
|
108th Congress (2003-2004) |
|||
|
H.R. 6 |
Energy Policy Act of 2003 |
10% in 2020; Secretary may establish regulations requiring not less than 10% for 2020-2030 |
Solar, wind, ocean, geothermal, qualifying biomass, landfill gas, qualifying hydropower |
|
H.R. 1294 |
N/A |
20% in 2025 |
Solar, wind, ocean, geothermal, qualifying biomass, landfill gas, qualifying hydropower |
|
S. 944 |
Renewable Energy Investment Act of 2003 |
20% in 2020 and thereafter (hydropower excluded from base quantity) |
Wind, ocean, qualifying biomass, solar, landfill gas, qualifying hydropower, geothermal, hydrogen produced from one of the above sources |
|
107th Congress (2001-2002) |
|||
|
H.R. 4 |
Energy Policy Act of 2002 |
10% in 2020; Secretary may establish regulations requiring not less than 10% for 2020-2030 |
Solar, wind, biomass, geothermal |
|
H.R. 2478 |
Comprehensive Renewable Energy and Energy Efficiency Act of 2001 |
20% in 2020 and thereafter (existing hydropower excluded from base quantity) |
Wind, qualifying biomass, geothermal, solar, incremental hydropower |
|
H.R. 3037 |
Renewable Energy and Energy Efficiency Investment Act of 2001 |
20% in 2020 and thereafter |
Wind, qualifying biomass, landfill gas, geothermal, solar, hydrogen produced from one of the above sources |
|
H.R. 3274 |
Comprehensive Energy Conservation Act for the 21st Century |
20% in 2020 and thereafter |
Solar, wind, geothermal, biomass |
|
H.R. 5756 |
N/A |
20% in 2025 |
Solar, wind, ocean, geothermal, qualifying biomass, landfill gas, qualifying hydropower |
|
S. 1333 |
Renewable Energy and Energy Efficiency Investment Act of 2001 |
20% in 2020 and thereafter |
Wind, qualifying biomass, landfill gas, geothermal, solar, hydrogen produced from one of the above sources |
|
Energy Policy Act of 2002 |
20% in 2020 (existing solar, existing wind, existing biomass, existing ocean, existing geothermal, waste-to-energy using landfill gas, and hydropower excluded from base quantity) |
Solar, wind, biomass, ocean, geothermal, distributed renewable energy, qualifying hydropower |
|
|
106th Congress (1999-2000) |
|||
|
H.R. 1828 |
Comprehensive Electricity Competition Act |
7.5% in 2010-2015 |
Solar, wind, geothermal, biomass |
|
H.R. 2050 |
Electric Consumers' Power to Choose Act of 1999 |
3% in 2005 and thereafter |
Solar, wind, geothermal, biomass |
|
H.R. 2569 |
Fair Energy Competition Act of 1999 |
7.5% in 2010 and thereafter (hydropower excluded from base quantity) |
Wind, qualifying waste-to-energy, biomass, landfill gas, geothermal, solar |
|
H.R. 2645 |
Electricity Consumer, Worker, and Environmental Protection Act of 1999 |
8 percentage points greater than the 1997 baseline by 2010; increasing by 1 percentage point annually thereafter |
Waste-to-energy, energy crops, landfill gas, geothermal, solar, wind |
|
H.R. 4861 |
Clean Power Act |
6% in 2010 and thereafter |
Solar, wind, geothermal, biomass |
|
S. 1369 |
Clean Energy Act of 1999 |
20% in 2020 and each year thereafter (hydropower excluded from base quantity) |
Wind, qualifying biomass, geothermal, solar |
|
S. 2904 |
Energy Security Tax and Policy Act of 2000 |
5% in 2012-2015 (existing solar, wind, geothermal, biomass, and hydropower excluded from base quantity) |
Solar, wind, geothermal, qualifying biomass, incremental hydropower, incremental renewable |
|
105th Congress (1997-1998) |
|||
|
H.R. 4798 |
Electricity Consumer, Worker, and Environmental Protection Act of 1998 |
8 percentage points greater than the 1997 baseline by 2010; increasing by 1 percentage point annually thereafter |
Qualifying biomass, landfill gas, geothermal, solar, wind |
|
S. 687 |
Electric System Public Benefits Protection Act of 1997 |
20% in 2020 and thereafter (hydropower excluded from base quantity) |
Wind, qualifying waste-to-energy, qualifying biomass, geothermal, solar |
|
S. 2287 |
Comprehensive Electricity Competition Act |
5.5% in 2010-2015 |
Solar, wind, geothermal, biomass |
Source: Congress.gov.
Notes: N/A = Not applicable; FERC = Federal Energy Regulatory Commission; CCS = carbon capture and sequestration. Only the latest major action, other than "Introduced," is shown. Some bills with an action listed had multiple actions. Some bills include specific definitions or requirements for some eligible sources (e.g., biomass, geothermal, hydropower, ocean energy). For simplicity, the table omits these details, and refers to these sources as "qualifying." Some bills specified that final targets would have stayed in place permanently, and these are indicated by "and thereafter" in this table. Other bills did not specify what should occur after the final target year.
a. The final version of this bill was enacted as P.L. 110-140, without a portfolio standard provision.