Introduction
The poverty rate among Americans aged 65 and older has declined by almost 70% in the past five decades. In 2017, 4.7 million people aged 65 and older had income below the federal poverty thresholds. The poverty rate (i.e., the percentage who were in poverty) among the aged fell from 28.5% in 1966 to 9.2% in 2017.1
Several government programs have contributed to older Americans' increased incomes, including Old Age, Survivor and Disability Insurance (OASDI, commonly known as Social Security) and Supplemental Security Income (SSI). However, certain groups of older Americans, such as widows, divorced women, and never married men and women, are still vulnerable to poverty. Congress may be interested in the effect of existing programs that reduce poverty, as well as potential proposals aimed at improving income among vulnerable groups of older Americans.
This report presents the time trends and current status of poverty rates among Americans aged 65 and older, as well as poverty rates among different demographic groups of the aged.2 This report also summarizes federal programs that may provide income to the aged poor.
Over the past several decades, criticisms of the official poverty measure have led to the development of an alternative research measure called the Supplemental Poverty Measure (SPM), which the Census Bureau also computes and releases. This report compares the official aged poverty measure with the SPM and provides statistics measuring the impact of federal cash benefits (mainly Social Security and SSI), taxes, and in-kind benefits (such as housing, energy, and food assistance) on aged poverty.
How the Official Poverty Measure Is Computed
Poverty status is determined by comparing a measure of a family's resources against a measure of its needs.3 Families whose resources are less than a dollar amount representing an austere level of "needs" are considered to be in poverty. However, defining resources and needs is not straightforward. The official poverty measure is based on 48 dollar amounts called poverty thresholds that vary by family size and composition, but not by geographic area.4 These official thresholds were developed in the 1960s, were based on food consumption in 1955 and food costs in 1961, and are updated annually for inflation. As such, they reflect a level of deprivation based on a restrictive food budget, but are not based on a full measurement of families' and individuals' needs and their associated costs. Family resources are measured in dollars and are based on cash income before taxes. All poverty data presented in this report are estimates based on a survey, and like all survey estimates, they are subject to sampling and nonsampling error.5
The poverty research community has discussed the official poverty measure's limitations for decades. Its use of pretax income renders it unhelpful in gauging tax credits' effects on the low-income population. It does not consider in-kind (noncash) benefits, such as housing subsidies as income, and as a result cannot (on its own) illustrate such benefits' effects on the poor population. Although the measure of need represented by the thresholds is updated every year for overall inflation, it may not accurately reflect the current costs of basic needs, because prices for goods and services related to basic needs may not rise at the same rate as prices for luxury items. Since the official measure's initial development, new data sources have offered more detail on the goods and services families consume, but developing an approach that defines basic needs and determines available resources for families to spend on those needs has taken decades of research and discussion. The SPM resulted from that research, and is described briefly in the section, "The Supplemental Poverty Measure."6
Notwithstanding the official measure's limitations, for more than 50 years, it has provided a consistent measure of poverty in the United States, with few methodological changes over that time, and it is based on empirical measures of need (food budgets and food consumption, albeit in 1961 and 1955, respectively)7. For these reasons, trends for the aged population based on the official measure are discussed below.
Poverty Status of the Aged
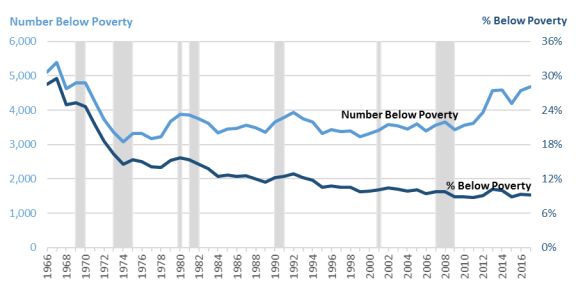
The proportion of Americans aged 65 and older who lived in poverty has declined significantly in the past 50 years. In 1966, 28.5% of Americans aged 65 and older had family incomes below the poverty thresholds.8 By 2017, the poverty rate among older Americans had dropped to 9.2% (see Figure 1). However, whereas the proportion of persons aged 65 and older who live in poverty has fallen over the past five decades, the number of aged poor has increased since the mid-1970s as the total number of elderly people has grown. In 1974, 3.1 million people aged 65 and older had income below the federal poverty thresholds, whereas in 2017, 4.7 million people aged 65 and older had income below the thresholds.
|
Figure 1. Number of Individuals Aged 65 and Older Below Poverty and Poverty Rate, 1966-2017 (Poverty rates in percentages, number of individuals in thousands. Shaded bars indicate recessions.) |
 |
|
Source: U.S. Census Bureau, Historical Poverty Table 3, at https://www.census.gov/data/tables/time-series/demo/income-poverty/historical-poverty-people.html. Recession dates obtained from National Bureau of Economic Research (NBER), at http://www.nber.org/cycles/cyclesmain.html. Notes: The Census Bureau implemented a change to the CPS ASEC in 2014 to improve income questions on pension withdrawals and asset income, and to improve the accuracy of health insurance coverage estimates. This change was partially implemented with the 2013 data and fully implemented for the 2014 data. Data for 2013 in the above figure reflect the values from the CPS ASEC sample that received the redesigned income questions. |
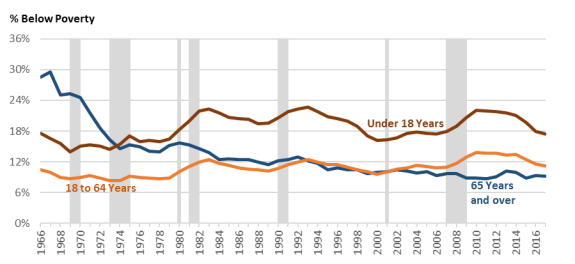
The poverty rate for Americans aged 65 and older historically was higher than the rates for adults aged 18 to 64 and children under the age of 18, but today it is the lowest among those three age groups.9 In 1966, the poverty rate among persons aged 65 and older was 28.5%, compared with 10.5% among adults aged 18 to 64 and 17.6% among children under the age of 18. In 1974, the aged poverty rate fell below the rate among children under the age of 18, and by the early 1990s, the aged poverty rate had fallen below the rate among adults aged 18 to 64. The elderly poverty rate has remained lower than the nonelderly adult poverty rate since that time. The poverty rate among Americans aged 65 and older was 9.2% in 2017, which was lower than the 11.2% poverty rate among adults aged 18 to 64 and the 17.5% poverty rate among children under 18 years old (see Figure 2).10
|
Figure 2. Poverty Rates, by Age Group: 1966 to 2017 (Poverty rates in percentages. Shaded bars indicate recessions.) |
 |
|
Source: Congressional Research Service (CRS), using data from U.S. Census Bureau, Current Population Survey, 1967-2018 Annual Social and Economic Supplements, Historical Poverty Table 3, http://www2.census.gov/programs-surveys/cps/tables/time-series/historical-poverty-people/hstpov3.xls, downloaded October 10, 2018. Recession dates obtained from NBER, at http://www.nber.org/cycles/cyclesmain.html. Notes: The Census Bureau implemented a change to the CPS ASEC in 2014 to improve income questions on pension withdrawals and asset income, and to improve the accuracy of health insurance coverage estimates. This change was partially implemented with the 2013 data and fully implemented for the 2014 data. Data for 2013 in the above figure reflect the values from the CPS ASEC sample that received the redesigned income questions. |
Poverty Among the Aged by Demographic Characteristics
Poverty status among Americans aged 65 and older generally varies across different demographic groups. This section describes the aged population's poverty status for selected demographic characteristics based on age groups, gender, marital status, and race and Hispanic origin.
Age
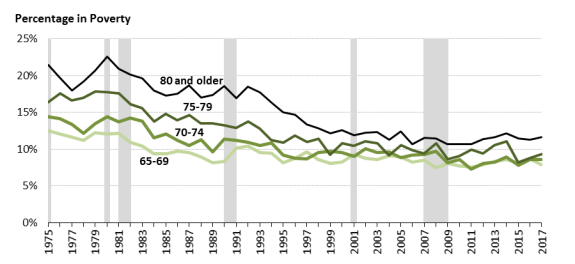
People aged 80 and older have a higher poverty rate than older Americans under the age of 80. Figure 3 displays the percentage of Americans aged 65 and older who were in poverty by age groups from 1975 to 2017. In 1975, the poverty rate among individuals who were in the oldest age group (80 and older) was 21.5%, compared with 16.4% among Americans aged 75-79, 14.4% among those aged 70-74, and 12.5% among those aged 65-69. Poverty rates declined over the past 40 years, and in 2017, approximately 11.6% of people aged 80 and older lived in poverty (a 10 percentage-point reduction from 1975), but the share was still higher than the 9.3% poverty rate among individuals aged 75-79, 8.6% among those aged 70-74, and 7.9% among those aged 65-69.11 Individuals aged 80 and older might be more vulnerable to income risks because they are more likely to have lower or no earnings (as they phase out of the labor force),12 exhaust existing retirement resources,13 have reduced purchasing power in certain defined benefit pensions,14 and incur higher medical expenses.15
|
Figure 3. Poverty Status of Individuals Aged 65 and Older, by Age Group, 1975-2017 (Shaded bars indicate recessions.) |
 |
|
Source: CRS analysis of data from the U.S. Census Bureau, Current Population Survey, 1976-2018 Annual Social and Economic Supplements (CPS ASEC). Recession dates obtained from NBER, at http://www.nber.org/cycles/cyclesmain.html. Notes: The Census Bureau implemented a change to the CPS ASEC in 2014 to improve income questions on pension withdrawals and asset income, and to improve the accuracy of health insurance coverage estimates. This change was partially implemented with the 2013 data and fully implemented for the 2014 data. Data for 2013 in the above figure reflect the values from the CPS ASEC sample that received the redesigned income questions. |
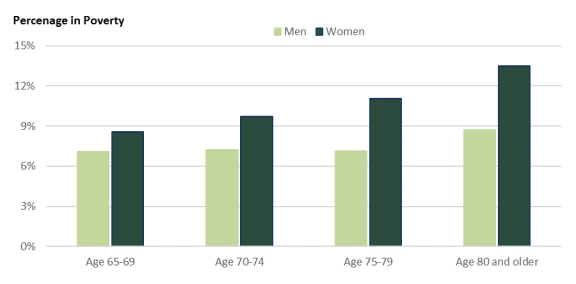
Women aged 80 and older had the highest poverty rate among elderly women and men in all age groups (see Figure 4). In 1975, the poverty rate among women aged 80 and older was 25.1%, compared with 15.2% among men in the same age group and 14.9% among women aged 65-69. In 2017, the poverty rate of women aged 80 and older declined to 13.5%, compared with 8.7% among men in the same age group and 8.6% among women aged 65-69.
|
Figure 4. Poverty Status of Individuals Aged 65 and Older in 2017, by Age Groups and Gender |
 |
|
Source: CRS analysis of data from the U.S. Census Bureau, 2018 CPS ASEC. |
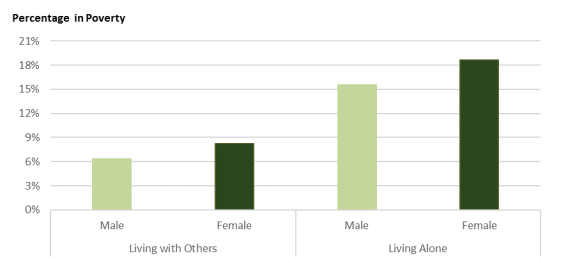
Poverty status among individuals aged 80 and older varies depending on whether the person is living with other family members. Poverty rates for those living with other family members in 2017 were less than half the rates for those living alone. In 2017, the poverty rate for men aged 80 and older was 6.3% if they lived with other family members, and 15.5% if they lived alone (see Figure 5). In the same year, the poverty rate for women aged 80 and older was about 8.2% if they lived with other family members and 18.6% if they lived alone.
|
Figure 5. Poverty Rates of Individuals Aged 80 and Older in 2017, by Living Status |
 |
|
Source: CRS analysis of data from the U.S. Census Bureau, 2018 CPS ASEC. |
Marital Status
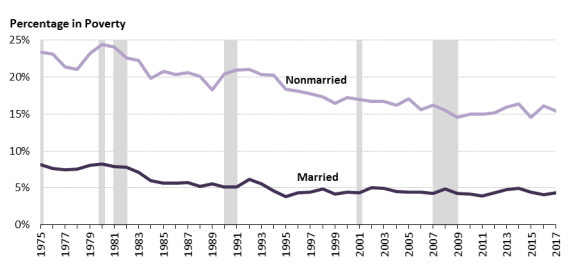
Americans aged 65 and older who were married and living together at the time of the survey generally had a lower poverty rate than those who were not married (see Figure 6).16 In 1975, about 53.0% of individuals aged 65 and older were married and living together, and this percentage was slightly higher at 56.8% in 2017. Approximately 8.2% of married Americans aged 65 and older and living together had family incomes below the federal poverty threshold in 1975, and this rate declined to 4.4% in 2017. During the same period, the poverty rate among aged nonmarried Americans decreased from 23.4% to 15.5%.
|
Figure 6. Poverty Status of Individuals Aged 65 and Older, by Marital Status, (Shaded bars indicate recessions.) |
 |
|
Source: CRS analysis of data from the U.S. Census Bureau, 1976-2018 CPS ASEC. Recession dates obtained from NBER, http://www.nber.org/cycles/cyclesmain.html. Notes: Married individuals are those married and living together. Nonmarried individuals include those widowed, divorced, never married, separated, and married living apart. The Census Bureau implemented a change to the CPS ASEC in 2014 to improve income questions on pension withdrawals and asset income, and to improve the accuracy of health insurance coverage estimates. This change was partially implemented with the 2013 data and fully implemented for the 2014 data. Data for 2013 in the above figure reflect the values from the CPS ASEC sample that received the redesigned income questions. |
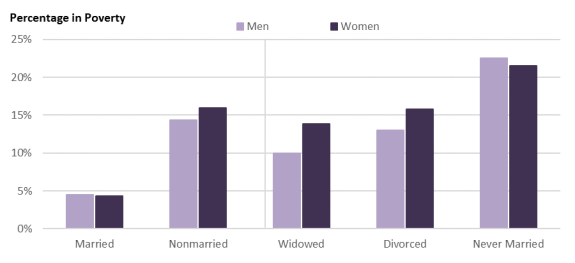
Figure 7 shows the poverty rate in 2017 by gender and marital status at the survey time. Married couples generally have significantly lower poverty rates than nonmarried individuals, and widowed and divorced women aged 65 or older are more likely to be in poverty than their male counterparts. Among women aged 65 and older, about 4.3% of married women had total incomes below the official poverty threshold in 2017, compared with 13.9% of widows, 15.8% of divorced women, and 21.5% of never-married women.17 In contrast with the widowed and divorced men in this age group, who are less likely to be poor than widowed and divorced women, poverty rates are also high among never-married men, at a rate of 22.5% in 2017.
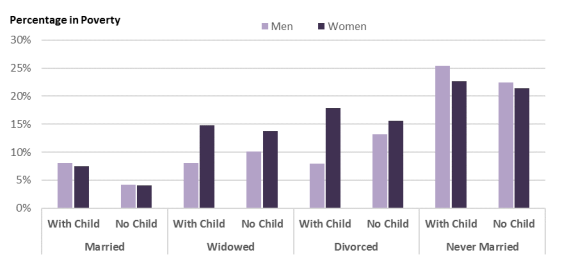
In 2017, roughly 10% of individuals aged 65 and older lived in families with children under 18 years old. Poverty rates among aged men and women varied by the presence of children in the family (see Figure 8), although not always in the same direction. Among married men and women, a relatively higher share of those with children lived in poverty (8.0% for men and 7.5% for women) than those without any child (4.2% for men and 4.1% for women). Similarly, among never-married individuals, those with children also had higher poverty rates (25.4% for men and 22.7% for women) than those without children (22.4% for men and 21.4% for women). However, while widows and divorced women with children had higher poverty rates (14.8% and 17.9%, respectively) than those without children (13.8% and 15.6%, respectively), among men the pattern was reversed: 8.1% of widowers with children and 7.9% of divorced men with children were in poverty, lower than their childless counterparts (10.1% and 13.2%, respectively).
Race and Hispanic Origin18
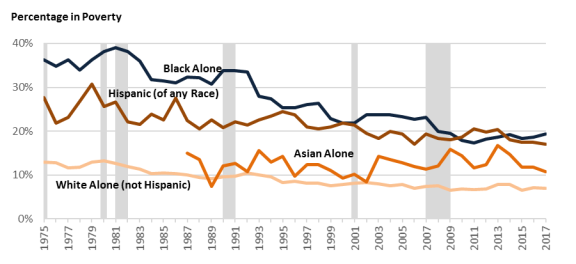
Poverty rates vary by race and Hispanic origin, as shown in Figure 9. In surveys, Hispanic origin is asked separately from race; accordingly, persons identifying as Hispanic may be of any race. The poverty rate for Americans aged 65 and older has decreased among persons identifying as black or African American alone, non-Hispanic white alone, and Hispanic from 1975 to 2017. Among aged African Americans, the poverty rate decreased from 36.3% in 1975 to 19.3% in 2017; among the aged non-Hispanic white population, from 13.0% to 7.0%; and among the aged Hispanic population, from 27.7% to 17.0%. During the period for which data are available, the poverty rate for the aged Asian population ranged between 10.0% and 16.0% with no consistent directional trend.19
|
Figure 9. Poverty Status of Individuals Aged 65 and Older, by Race and Hispanic Origin, 1975-2017 (Shaded bars indicate recessions.) |
 |
|
Source: U.S. Census Bureau, 1976-2018 CPS ASEC, Historical Poverty Tables: People and Families-1959 to 2017, at https://www.census.gov/data/tables/time-series/demo/income-poverty/historical-poverty-people.html. Recession dates obtained from NBER, at http://www.nber.org/cycles/cyclesmain.html. Notes: People of Hispanic origin may be of any race. Additionally, beginning in 2002, respondents may identify with one or more racial groups; previously they could choose only one. Except for "Hispanic," the remaining groups shown include those who identified with one race only. Data for Native Hawaiians and Other Pacific Islanders, American Indians and Alaska Natives, and the population of two or more races are not shown separately. From 1987 to 2001, however, Pacific Islanders were included in the Asian category. The Census Bureau implemented a change to the CPS ASEC in 2014 to improve income questions on pension withdrawals and asset income, and to improve the accuracy of health insurance coverage estimates. This change was partially implemented with the 2013 data and fully implemented for the 2014 data. Data for 2013 in the above figure reflect the values from the CPS ASEC sample that received the redesigned income questions. |
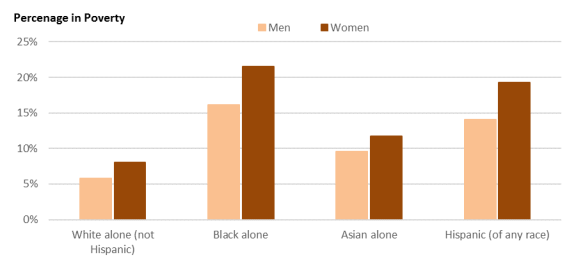
As shown in Figure 10, among the racial and Hispanic origin groups, in 2017, the poverty rate was lowest among the aged non-Hispanic white population (5.8% for men and 8.0% for women) and highest among the aged black population (16.1% for men and 21.5% for women).
Federal Programs for the Aged Poor
Social Security and Supplemental Security Income (SSI) are the two main federal programs that provide cash benefits to the aged poor. In 2017, Social Security accounted for 78.3% of total money income among aged individuals whose family incomes were below 100% of the poverty threshold and 81.3% among those with family incomes below 125% of the poverty threshold (see Table 1).20 In the same year, SSI and other cash public assistance accounted for 11.0% of the total money income for aged individuals whose family incomes were below 100% of the poverty threshold21 and 7.6% for those with family incomes below 125% of the poverty threshold.22
Table 1. Share of Total Money Income from Specified Sources for Poor Individuals Aged 65 and Older, 2017
|
Below 100% of the Poverty Thresholda |
Below 125% of the Poverty Thresholdb |
|
|
Total Percentage |
100.0% |
100.0% |
|
Percentage of Income from— |
||
|
Earnings |
3.8% |
4.1% |
|
Social Security |
78.3% |
81.3% |
|
Pensions |
2.8% |
2.9% |
|
Asset Income |
2.1% |
2.1% |
|
SSI and Other Public Assistance |
11.0% |
7.6% |
|
Other Income |
1.8% |
2.1% |
|
Number of Observationsc |
2,544 |
3,906 |
|
Population (thousands) |
4,681 |
7,179 |
Source: Congressional Research Service (CRS) analysis of data from the U.S. Census Bureau, 2018 CPS ASEC.
Notes: All values displayed in the table have been adjusted for population weights provided by the CPS. The CPS ASEC was designed to collect information on money income received on a regular basis. Money income is measured on a pre-tax basis and does not include noncash benefits and transfers. Earnings are the sum of income from wages and salaries and net income from self-employment. Social Security includes retired-worker benefits, dependents' or survivor benefits, and disability benefits. Pensions include Railroad Retirement income, government employee pensions, and private pensions or annuities. Lump-sum or irregular distributions from retirement saving accounts (employer-sponsored defined contribution plans and Individual Retirement Accounts [IRAs]) may not be properly captured in the survey. Asset income includes income from interest, dividends, rent, royalties, and estates and trusts. Other public assistance includes cash public assistance payments to people with low income, such as Temporary Assistance for Needy Families (TANF), general assistance, and emergency assistance. Other income include worker's compensation, unemployment insurance, alimony, child support, and financial assistance from friends and relatives.
a. The official poverty thresholds in 2017 were $11,756 for single elderly persons and $14,816 for elderly couples with no children. In larger families, thresholds are not distinguished by the householder's age; persons 65 and older in larger families use the same thresholds as young families. For all 48 poverty thresholds see https://www2.census.gov/programs-surveys/cps/tables/time-series/historical-poverty-thresholds/thresh17.xls.
b. The dollar amounts representing 125% of the poverty threshold are the poverty thresholds multiplied by 1.25. For example, in 2017, for a single person aged 65 or older not living in a family, $14,695 was 125% of the poverty level. More people fall below 125% of poverty than below 100% of poverty because the income cutoff is higher.
c. The number of observations is the number of individuals in the survey.
Social Security is a federal social insurance program that provides benefits to insured workers and their eligible family members, provided the workers worked in jobs covered by Social Security for a sufficient number of years and meet certain other criteria.23 Social Security is not designed solely for the poor, but benefits are weighted to replace a greater share of career-average earnings for low-paid workers than for high-paid workers. One study suggests that increased Social Security benefits explained most of the decline in poverty among the aged that occurred during 1967 to 2000 (see Figure 1).24
Social Security benefits alone, however, would not be sufficient to eliminate poverty for a large number of older Americans. The poverty rate among Social Security beneficiaries aged 65 and older was 6.5% in 2017.25 Although the Social Security program contains a special minimum benefit provision that increases benefits to workers who have many years of low earnings and meet certain other criteria, this provision has virtually no effect on the benefits paid to today's new retirees.26 According to the Census Bureau's analysis, 30.0% of Americans aged 65 and older would live in poverty without Social Security benefits, holding other resources and expenses constant.27
SSI is a federal assistance program that provides monthly cash benefits to aged, blind, and disabled individuals who have limited income and assets. The program is intended to provide a minimum level of income to adults who have difficulty meeting their basic living expenses due to age or disability and who have little or no Social Security or other income.28 Some studies show that the SSI program does not provide effective income protection for the oldest Americans. For example, the maximum SSI benefit in 2017 was 75% of the poverty threshold for an elderly single person and 89% of the poverty threshold for an elderly married couple.29 Thus, aged SSI recipients may still be impoverished. Furthermore, the maximum SSI benefit is more generous for married couples, who are less likely to need assistance than elderly single individuals. Some researchers also suggest that restructuring the Social Security special minimum benefit provision could be more effective in alleviating poverty than making certain reforms to the SSI program, although a combination of reforms to both programs could be useful if regular Social Security benefits are greatly reduced in the future.30
The federal government also provides certain noncash benefits to help the elderly poor, such as housing subsidies and Supplemental Nutrition Assistance Program (SNAP) benefits.31 Congress funds housing subsidy programs, ranging from public housing to government subsidies to renters, to help poor and vulnerable populations meet their housing needs.32 SNAP is designed primarily to increase the food purchasing power of eligible low-income households to help them buy a nutritionally adequate low-cost diet.33
Individuals aged 65 and older may also receive a small portion of income from some other federal programs, including refundable tax credits, school meals, Temporary Assistance for Needy Families (TANF), the Low Income Home Energy Assistance Program (LIHEAP), unemployment insurance, workers' compensation, and the Special Supplemental Nutrition Program for Women, Infants and Children (WIC). 34 The official poverty measure is of limited value for analyzing various federal programs' effects on poverty status among the aged population, but the Supplemental Poverty Measure (SPM), discussed in the following section, addresses some of those impacts.
The Supplemental Poverty Measure
The official poverty measure was developed in the 1960s and was established by the Bureau of the Budget (later the Office of Management and Budget, OMB) for measuring the official poverty rate in the United States.35 Under the official poverty measure, an individual is counted as poor if his or her family's pretax money income falls below the poverty threshold. One of the main criticisms of the official poverty measure is that pretax money income excludes the value of government noncash benefits (such as health insurance, SNAP, or housing assistance) provided either privately or publicly.36 It also does not consider taxes paid to federal, state, or local governments, or tax benefits (such as the Earned Income Tax Credit) that families might receive.37
The Census Bureau's SPM was designed to address the official poverty measure's limitations and has been published since 2011.38 The SPM poverty thresholds measure a standard of living based on expenditures for food, clothing, shelter, and utilities (FCSU) and "a little more" for other expenses.39 Its thresholds—dollar amounts related to the level of need for a family—vary by whether the family rents, owns a home with a mortgage, or owns a home without a mortgage (the latter of which is more common among the aged population than it is among younger populations). It computes the amount of resources available after taxes, includes the values of noncash benefits, and subtracts some expenses (such as work-related expenses and medical out-of-pocket expenses, the latter of which tend to be higher among the aged than among younger populations).
In 2017, the most recent data available, the SPM poverty rate for persons aged 65 and older was 14.1% in 2017,40 compared with 9.2% using the official poverty measure.41 This higher poverty rate results largely from higher medical out-of-pocket costs among the aged, in spite of lower housing expenses among the aged, who are more likely to have paid off their mortgages.
Income Sources' Impact on Poverty of the Aged Per the SPM
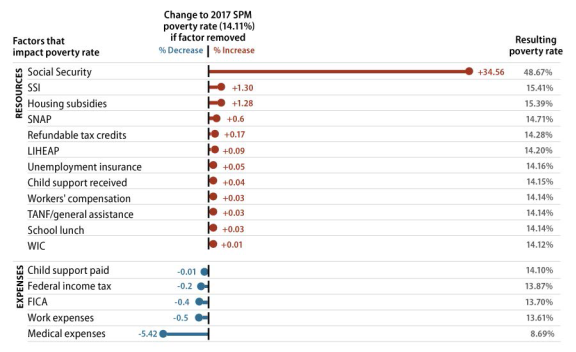
The data presented in Figure 11 illustrate how changing the definition of the SPM to exclude a particular resource or expenditure can affect the SPM poverty rate among Americans aged 65 and older. The data do not consider the behavioral effects that may occur if the resource or cost were to be eliminated in reality.
Social Security has the greatest effect, by far, on the poverty status of the aged population. Removing Social Security as a resource while holding the other resources and expenditures constant would increase the SPM aged poverty rate by more than 34.6%. Among the other resources, SSI, housing subsidies, and SNAP had the next-largest impacts on the SPM poverty rate, but were a full order of magnitude smaller (around a single percentage point instead of tens of percentage points). The remaining resources affected the SPM poverty rate by much less than one percentage point. Three of the resources shown are related to child rearing (child support, school lunch, and WIC), and tax credits are often targeted to families with children. Households headed by people aged 65 and older are less likely than nonelderly households to have children present in the family.42
Among the expenses considered in the SPM but not considered in the official measure, medical out-of-pocket costs had the largest effect: deducting those costs from family income raised the SPM poverty rate by 5.4%. Given that the aged population tends to have greater medical need and higher out-of-pocket health care costs than younger populations,43 it is perhaps not surprising that medical costs had a larger effect than the other costs shown in the figure. The remaining costs were largely related to work, and, congruent with the aged population's lower likelihood to be working compared with younger populations,44 these costs affected the aged population's SPM poverty rate by less than one percentage point.
|
Figure 11. The Effects of Resources and Costs on the SPM Poverty Rate for the Population Aged 65 and Older: 2017 (Poverty rates [in percentages] that would result if the SPM were computed without including the element labeled at left. Each element's numerical contribution to the SPM poverty rate is shown without considering any behavioral changes that may result from its removal as an actual cost or resource.) |
 |
|
Source: Congressional Research Service, using data from Table A-6, "Effect of Individual Elements on SPM Rates: 2016 and 2017," U.S. Census Bureau, 2018 CPS ASEC, at https://www.census.gov/library/publications/2018/demo/p60-265.html. Notes: The SPM poverty rate for the aged population (65 and older) was 14.1% in 2017. |
Additional Considerations
Poverty Not Measured for Certain Populations
Approximately 1.2 million persons in nursing homes are aged 65 or older.45 Poverty status is not measured for the institutionalized population, which includes persons in nursing homes, prisons, or military personnel living on base. This exclusion is not trivial considering that the population in nursing homes is about one-fourth as large as the 4.7 million persons aged 65 or older who were in poverty in 2017.46
Health Status Not Directly Included in Poverty Measures
Poverty is used as a measure of well-being, but it measures only economic well-being and does not directly include a person's health status. Health status may influence the amount and types of income a person receives (by affecting, for example, ability to work or receive disability benefits) and is thus considered indirectly.47 However, the noneconomic aspect of well-being that comes from good health is not considered in the poverty measures discussed in this report. Furthermore, in the SPM, medical out-of-pocket expenses are considered, but the overall value of health insurance programs to the individual, which may well exceed out-of-pocket costs for medical care or insurance premiums, is not. Considering that Medicaid is an important vehicle for long-term care, the benefits Medicaid provides to the aged population could be characterized as fulfilling needs that are not solely medical in nature, but have economic value as well.