Federal funding to assist communities with capital projects to meet the water-related goals and requirements of federal laws has been provided through programs in the Clean Water Act (CWA) and the Safe Drinking Water Act. This report provides a table showing budget requests and appropriations for the Environmental Protection Agency's (EPA's) water infrastructure assistance programs under these two laws since 1973.
The Water Pollution Control Act of 1948 (P.L. 80-845) established a grant program to assist localities with planning and design work and authorized loans for treatment plant construction. In subsequent amendments, federal assistance increased and a construction grant program replaced the loan program. In the Federal Water Pollution Control Act Amendments of 1972 (P.L. 92-500, popularly known as the Clean Water Act), Congress established the first national standards for sewage treatment and significantly increased federal funding to help communities meet the law's standards.
Congress enacted the most recent comprehensive CWA amendments in 1987 (P.L. 100-4). That legislation authorized $18 billion over nine years for wastewater treatment plant construction, through a combination of the traditional Title II grant program and a new State Water Pollution Control Revolving Funds (SRF) program. Using SRF program appropriations, EPA provides federal capitalization grants as seed money for state-administered loans to construct sewage treatment plants and other water quality projects. Local communities, in turn, repay loans to the state, not the federal government. Pursuant to the 1987 amendments, the SRF program started in FY1989 and entirely replaced the previous grant program in FY1991.
In 1996 Congress amended the Safe Drinking Water Act (P.L. 104-182) to authorize a drinking water state revolving loan fund (DWSRF) program to help systems finance projects needed to comply with drinking water regulations and to protect public health.1 This program, which parallels the Clean Water Act SRF, authorizes EPA to make grants to states to capitalize DWSRFs, which states then use to make loans to public water systems. The legislation authorized a total of $9.6 billion over 10 years to assist drinking water projects. The America's Water Infrastructure Act of 2018 (P.L. 115-270), enacted October 23, 2018, provided authority for appropriations for FY2019 through FY2021.
Table 1 shows the appropriations data for the two EPA water infrastructure assistance programs from FY1973 through FY2018 in nominal dollars not adjusted for inflation. Since 1973, Congress has provided more than $118 billion for the core wastewater and drinking water infrastructure assistance programs. The table also includes the President's budget request for FY2019.
Table 1 also shows appropriations for special projects. These are funds designated in appropriations legislation for projects in specified communities or locations, often referred to as "earmarks." Because some Members of Congress, interest groups, and Administration officials criticize these types of congressional actions, Congress banned the practice of congressionally designated special project funds for EPA's water infrastructure and other programs in FY2011. Amounts shown in the table for special projects appropriations are predominantly congressionally directed funds, but they also include amounts requested by the Administration since the early 1990s for a limited number of special projects (e.g., in certain coastal communities, for Alaska Native and rural villages, and for U.S.-Mexico Border projects that Congress has continued to fund).2
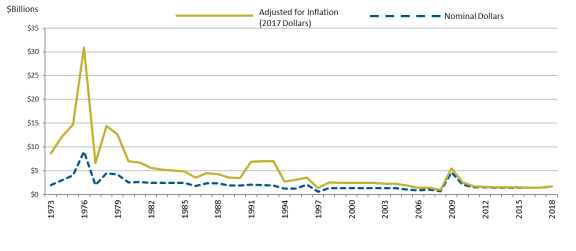
For comparison, Figure 1 shows total EPA water infrastructure appropriations (for clean water and drinking water assistance combined) over the same period in both nominal dollars and constant (2017) dollars.
In addition, the Water Infrastructure Finance and Innovation Act (WIFIA) program is another source of potential funding for water infrastructure. Congress established the WIFIA program in the Water Resources Reform and Development Act of 2014 (WRRDA; P.L. 113-121). The act, among other provisions, authorizes EPA to provide credit assistance (e.g., secured/direct loans) for a range of wastewater and drinking water projects. Project costs must be $20 million or larger to be eligible for credit assistance. In rural areas (defined as populations of 25,000 or less), project costs must be $5 million or more.3
In FY2017, Congress appropriated $30 million to the U.S. Environmental Protection Agency (EPA) for the WIFIA program through two appropriations acts (P.L. 114-254 and P.L. 115-31). The combined FY2017 appropriation for subsidy costs ($25 million) allowed the agency to invite 12 entities across the country to apply for loans totaling $2.3 billion that support a variety of water infrastructure projects.
For FY2018, the Consolidated Appropriations Act, 2018 (P.L. 115-141), provided $63 million for the WIFIA program (including $8 million for administrative costs). EPA announced a second round of WIFIA funding on April 4, 2018. In November 2918, EPA announced it is inviting 39 projected to apply for WIFIA loans totaling approximately $5 billion.4
Table 1. President's Budget Request and Total EPA Water Infrastructure Appropriations, FY1973-FY2018
(Millions of dollars not adjusted for inflation)
|
Fiscal Year |
President's Total Request |
Clean Water Appropriations (Title II and SRF) |
Drinking Water SRF Appropriations |
Special Projects Appropriations |
Total Appropriationsa |
||||||||||
|
1973 |
|
|
|
|
|
||||||||||
|
1974 |
|
|
|
|
|
||||||||||
|
1975 |
|
|
|
|
|
||||||||||
|
1976 |
|
|
|
|
|
||||||||||
|
1977 |
|
|
|
|
|
||||||||||
|
1978 |
|
|
|
|
|
||||||||||
|
1979 |
|
|
|
|
|
||||||||||
|
1980 |
|
|
|
|
|
||||||||||
|
1981 |
|
|
|
|
|
||||||||||
|
1982 |
|
|
|
|
|
||||||||||
|
1983 |
|
|
|
|
|
||||||||||
|
1984 |
|
|
|
|
|
||||||||||
|
1985 |
|
|
|
|
|
||||||||||
|
1986 |
|
|
|
|
|
||||||||||
|
1987 |
|
|
|
|
|
||||||||||
|
1988 |
|
|
|
|
|
||||||||||
|
1989 |
|
|
|
|
|
||||||||||
|
1990 |
|
|
|
|
|
||||||||||
|
1991 |
|
|
|
|
|
||||||||||
|
1992 |
|
|
|
|
|
||||||||||
|
1993 |
|
|
|
|
|
||||||||||
|
1994 |
|
|
|
|
|
||||||||||
|
1995 |
|
|
|
|
|
||||||||||
|
1996 |
|
|
|
|
|
||||||||||
|
1997 |
|
|
|
|
|
||||||||||
|
1998 |
|
|
|
|
|
||||||||||
|
1999 |
|
|
|
|
|
||||||||||
|
2000 |
|
|
|
|
|
||||||||||
|
2001 |
|
|
|
|
|
||||||||||
|
2002 |
|
|
|
|
|
||||||||||
|
2003 |
|
|
|
|
|
||||||||||
|
2004 |
|
|
|
|
|
||||||||||
|
2005 |
|
|
|
|
|
||||||||||
|
2006 |
|
|
|
|
|
||||||||||
|
2007 |
|
|
|
|
|
||||||||||
|
2008 |
|
|
|
|
|
||||||||||
|
2009 |
|
|
|
|
|
||||||||||
|
2010 |
|
|
|
|
|
||||||||||
|
2011 |
|
|
|
|
|
||||||||||
|
2012 |
|
|
|
|
|
||||||||||
|
2013 |
|
|
|
|
|
||||||||||
|
2014 |
|
|
|
|
|
||||||||||
|
2015 |
|
|
|
|
|
||||||||||
|
2016 |
|
|
|
|
|
||||||||||
|
2017 |
|
|
|
|
|
||||||||||
|
2018 |
|
|
|
|
|
||||||||||
|
2019d |
|
|
|
|
|
||||||||||
|
Total |
|
|
|
|
|
Source: Compiled by CRS.
Notes: SRF = State Revolving Fund.
a. Total appropriations in FY2000, FY2003, FY2004, FY2005, FY2006, FY2008, FY2011, FY2012, and FY2013 reflect mandatory across-the-board rescissions in appropriations acts. FY2013 appropriations also reflect effects of sequestration. For information on sequestration, see CRS Report R42972, Sequestration as a Budget Enforcement Process: Frequently Asked Questions, by [author name scrubbed].
b. FY2009 appropriation total included $4.0 billion in supplemental funds under the American Recovery and Reinvestment Act (P.L. 111-5; ARRA).
c. FY2009 appropriation total included $2.0 billion in supplemental funds under ARRA.
d. FY2019 values reflect President Trump's budget proposal (EPA, Justification of Appropriation Estimates for the Committee, Fiscal Year 2019, 2018).
|
Figure 1. EPA Water Infrastructure Annual Appropriations: FY1973-FY2018 Adjusted ($2017) and Not Adjusted for Inflation (Nominal) |
 |
|
Source: Prepared by CRS using information from annual appropriations acts, committee reports, and explanatory statements presented in the Congressional Record. Amounts reflect applicable rescissions and supplemental appropriations, including $6 billion in the American Recovery and Reinvestment Act of 2009 (P.L. 111-5). Constant dollars calculated from Office of Management of Budget, Table 10.1, "Gross Domestic Product and Deflators Used in the Historical Tables: 1940-2023," https://www.whitehouse.gov/omb/budget/Historicals. |