The manner in which staff are deployed within an organization may reflect the missions and priorities of that organization.
In Congress, employing authorities hire staff to carry out duties in Member-office, committee, leadership, and other settings. The extent to which staff in those settings change may lend insight into the Senate's work over time. Some of the insights that might be taken from staff levels include
- an understanding of the division of congressional work between Senators working individually through their personal offices, or collectively, through committee activities;
- the relationship between committee leaders and chamber leaders, which could have implications for the development and consideration of legislation, the use of congressional oversight, or deployment of staff; and
- the extent to which specialized chamber administrative operations have grown over time.
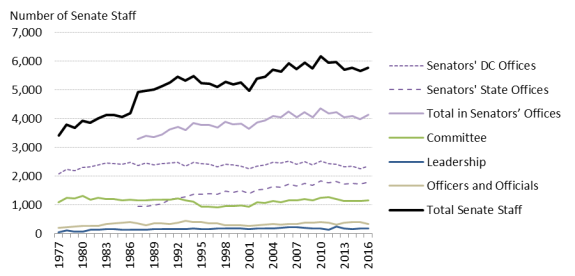
This report provides staffing levels in Senators',1 committee, leadership, and other offices since 1977. No Senate publication appears to officially and authoritatively track the actual number of staff working in the chambers by office or entity. Data presented here are based on staff listed by chamber entity (offices of Senators, committees, leaders, officers, officials, and other entities) in Senate telephone directories. Figure 1 displays overall staffing levels in the Senate.
Table 1 in the "Data Tables" section below provides data for all staff listed in chamber directories in the Senate through 2016. Joint committee staff data from the Senate for panels that met in the 114th Congress (2015-2016) are provided in Table 7.
Senate Staffing
Senate Staff Data Collection
This report provides data based on a count of staff listed in the Senate telephone directories published since 1977.2 Like most sources of data, telephone directory listings have potential benefits and potential drawbacks. Telephone directories were chosen for a number of reasons, including the following:
- telephone directories published by the Senate are an official source of information about the institution that are widely available;
- presumably, the number of directory listings closely approximates the number of staff working for the Senate;3
- while arguably not their intended purpose, the directories provide a consistent breakdown of Senate staff by internal organization at a particular moment in time; and
- the directories afford the opportunity to compare staff levels at similar moments across a period of decades.4
At the same time, however, data presented below should be interpreted with care for a number of reasons, including the following:
- There is no way to determine whether all staff working for the Senate are listed in the chambers' telephone directories.5 If some staff are not listed, relying on telephone directories is likely to lead to an undercount of staff.
- In particular, staff working in Senators' state offices were not listed until 1987. This likely led to an undercount of staff, and makes comparisons pre-1987 and post-1987 difficult.
- It is not possible to determine if staff who are listed were actually employed by the Senate at the time the directories were published. If the directories list individuals who are no longer employed by the Senate, then relying on them is likely to lead to an overcount of staff.
- The extent to which the criterion for inclusion in the directories for the Senate has changed over time cannot be fully determined. Some editions of the directory do not always list staff in various entities the same way.6 This may raise questions regarding the reliability of telephone directory data as a means for identifying congressional staff levels within the Senate over time.
- Some Senate staff may have more than one telephone number, or be listed in the directory under more than one entity.7 As a consequence, they might be counted more than once. This could lead to a more accurate count of staff in specific entities within the Senate, but multiple listings may also lead to an overcount of staff working in the chamber.
- Chamber directories may reflect different organizational arrangements over time for some entities. This could lead to counting staff doing similar work in both years in different categories, or in different offices.
Senate Staff Data
It appears that the Senate telephone directories started listing Senate staff working in Senators' state offices in 1987. Given the lack of consistent staff data from Senators' offices prior to 1987, comparisons between data from those offices from 1977-1986 and 1987-2016, as well as any analysis of total staffing levels in the Senate before 1987, would be incomplete. Staff levels from committees, leadership, and officers and officials, however can be evaluated across the entire 1977-2016 time period. Additionally, analysis of total staffing levels, as well as staff distribution, since 1987 is discussed below.
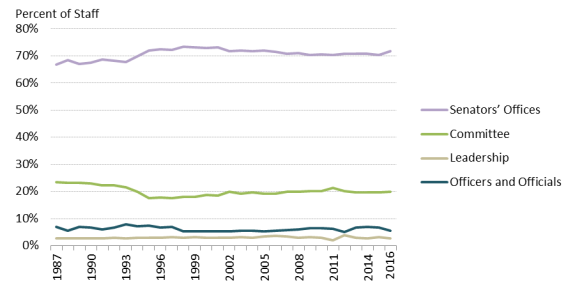
In the Senate, the number of staff has grown steadily, from 4,916 in 1987 to 5,749 in 2016, or 16.94%. Each year since 1987, the number of Senate staff has grown by an average of 29 individuals,8 or 0.58%. From 1977 to 1986, excluding congressional staff from state offices, the number of staff in the Senate has grown steadily from 3,397 in 1977 to 4,180 in 1986, or 23.05%. Figure 1 displays staff levels in six categories (Senators' DC offices, Senators' state offices, total staff in Senators' offices, committees, leadership, and officers and officials) since 1977. Figure 2 provides the distributions among categories of offices from 1987 to 2016.
Table 1 in the "Data Tables" section, below, provides detailed staff levels in those categories.
 |
|
Source: Senate telephone directories, CRS calculations. Notes: All categories are based on a full count of directory listings. |
Staff in Senators' Offices
Staff in Senators' offices grew from 2,068 in 1977 to 2,474 in 1986, or 19.63%. Due to the addition of staff in Senators' state offices, comparisons of total staff before 1986 to after are not possible. But staff in Senators' Washington, DC, offices continued to grow. In 2016, there were 2,342 staff in Senators' DC offices, an increase of 13.25% from the 1977 level, 2,068. Staff in Senators' offices, including state-based staff, have grown from 3,286 in 1987 to 4,120 in 2016, or 25.38%. Senators' office staffs have grown as a proportion of overall Senate staff over time. In 1987, Member-office staff comprised 66.84% of Senate staff. The proportion grew to 67.51% in 1990, and 72.96% in 2000, before dropping slightly to 71.66% in 2016.
Most of the growth in Senators' staffs since 1987 appears to have been among state-based staff, which nearly doubled in size from 935 in 1987 to 1,778 in 2016. More staff work in Washington, DC, offices than in state offices, but the percentage of Senators' staff based in states has grown steadily since 1987, while the number of staff in Senators' Washington, DC, offices has remained relatively flat. In 2016, 56.84% of staff listed in the Senate telephone directory as working in Senators' offices did so in Washington, DC, down from a high of 72.18% in 1988. Table 2 in the "Data Tables" section below provides the number of staff working in Senators' offices in Washington, DC, and state offices.
Committees
Senate committee staff levels have shown the smallest change among Senate staff categories, increasing from 1,084 in 1977 to 1,153 in 2016, or 6.37%. Change among Senate committee staff may be characterized in three stages: an increase during 1977-1980 (20.57%); a period of decline in 1980-1999 (-27.93%); and a period of growth from 1999 to 2016 (22.40%).
Between 1987 and 2016, committee staff comprised a decreasing proportion of Senate staff, falling from a peak of 23.39% of Senate staff in 1987 to a low of 17.49% of staff in 1995. The proportion of Senate committee staff grew to 20.06% in 2016, still below its 1987 peak.
In the "Data Tables" section below, three tables provide staff levels in various Senate committees. Table 3 provides data for 2007-2016; data for 1997-2006 are available in Table 4, Table 5 provides data for 1987-1996, and data for 1977-1986 are in Table 6. Totals for each year, which include Senate joint committee staff found in Table 7, are provided in Table 1.
Leadership Offices
The number of staff in Senate leadership offices grew from 44 in 1977 to 160 in 2016. The majority of the growth in leadership staff occurred between 1977 and 1981, from 44 to 119, or 170.45%. The number of leadership staff peaked in 2012 at 234. As a proportion of Senate staff, leadership employees were 2.69% in 1987 and 2.78% in 2016.
Officers and Officials
Staff working in the offices of Senate officers and officials has grown 57.21% since 1977. Staff levels have grown from 201 in 1977 to 316 in 2016, but were characterized by sharp decreases in 1988, from 1998-2001, in 2012, and in 2016.
Despite the growth, Senate officers and officials' staff decreased as a proportion of Senate staff, falling from 7.08% in 1987 to a low of 5.21% in 2012. In 2016, the proportion of officers and officials' staff was 5.50%.
|
Figure 2. Percentage of Senate Staff in Each Category, 1987-2016 |
 |
|
Source: Senate telephone directories, CRS calculations. Notes: All categories are based on a full count of directory listings. |
Discussion
Since 1987, the number of staff working for the Senate has grown. There have been increases in the number of staff working in Senate leadership offices, and larger increases in the staffing of officers and officials through 2015, though 2016 saw a dip in those numbers. Staff working for Senators have shifted from committee settings to leadership settings or the personal offices. Some of these changes may be indicative of the growth of the Senate as an institution, or the value the chamber places on its various activities.
One example that may be an indication of institutional development arguably is found in the growth of the number of staff working in leadership and officers and officials' offices. A potential explanation for these changes may be found in what some might characterize as an ongoing professionalization and institutionalization of congressional management and administration. Some note that as organizations such as governing institutions develop, they identify needs for expertise and develop specialized practices and processes.9 In Congress, some of those areas of specialization arguably include supporting the legislative process through the drafting of measures, oversight and support of floor activities, and the management of legislation in a bicameral, partisan environment. Another potential explanation related to a more institutionalized, professionalized Congress could be the demands for professional management and support. This could arise as a result of congressional use of communications technologies, and the deployment of systematic, professionalized human resources processes, business operations, and financial management. Consequently, increased specialized support of congressional legislative and administrative activities may explain increases among staff working for chamber leaders, and officers and officials.
In another example, the distribution of staff working directly for Senators has shifted from committee settings to personal office settings. Staff in Member offices has grown while staff in Senate committees has decreased, both in real numbers and in percentage of total staff. This may represent a shift from collective congressional activities typically carried out in committees (including legislative, oversight, and investigative work) to individualized activities typically carried out in Senators' personal offices (including direct representational activities, constituent service and education, and political activity).10
Data Tables
|
Year |
1977 |
1978 |
1979 |
1980 |
1981 |
1982 |
1983 |
1984 |
1985 |
1986 |
|
Senators' Offices |
2,068 |
2,215 |
2,173 |
2,296 |
2,308 |
2,385 |
2,454 |
2,430 |
2,409 |
2,474 |
|
Committee |
1,084 |
1,244 |
1,209 |
1,307 |
1,161 |
1,228 |
1,200 |
1,191 |
1,137 |
1,177 |
|
Leadership |
44 |
103 |
55 |
49 |
119 |
132 |
136 |
138 |
121 |
131 |
|
Officers and Officials |
201 |
213 |
230 |
261 |
253 |
264 |
327 |
354 |
376 |
398 |
|
Totals |
3,397 |
3,775 |
3,667 |
3,913 |
3,841 |
4,009 |
4,117 |
4,113 |
4,043 |
4,180 |
|
Year |
1987 |
1988 |
1989 |
1990 |
1991 |
1992 |
1993 |
1994 |
1995 |
1996 |
|
Senators' Offices |
3,286 |
3,393 |
3,354 |
3,445 |
3,612 |
3,707 |
3,593 |
3,826 |
3,771 |
3,773 |
|
Committee |
1,150 |
1,147 |
1,167 |
1,174 |
1,176 |
1,216 |
1,141 |
1094 |
915 |
929 |
|
Leadership |
132 |
133 |
138 |
144 |
146 |
156 |
147 |
163 |
157 |
156 |
|
Officers and Officials |
348 |
276 |
350 |
340 |
321 |
362 |
425 |
393 |
388 |
353 |
|
Totals |
4,916 |
4,949 |
5,009 |
5,103 |
5,255 |
5,441 |
5,306 |
5,476 |
5,231 |
5,211 |
|
Year |
1997 |
1998 |
1999 |
2000 |
2001 |
2002 |
2003 |
2004 |
2005 |
2006 |
|
Senators' Offices |
3,678 |
3,876 |
3,801 |
3,823 |
3,639 |
3,855 |
3,915 |
4,091 |
4,047 |
4,232 |
|
Committee |
899 |
955 |
942 |
979 |
915 |
1,071 |
1,047 |
1,126 |
1,078 |
1,146 |
|
Leadership |
166 |
162 |
166 |
159 |
154 |
166 |
176 |
167 |
193 |
220 |
|
Officers and Officials |
353 |
280 |
282 |
279 |
260 |
282 |
309 |
315 |
297 |
325 |
|
Totals |
5,096 |
5,273 |
5,191 |
5,240 |
4,968 |
5,374 |
5,447 |
5,699 |
5,615 |
5,923 |
|
Year |
2007 |
2008 |
2009 |
2010 |
2011 |
2012 |
2013 |
2014 |
2015 |
2016 |
|
Senators' Offices |
4,044 |
4,221 |
4,029 |
4,346 |
4,180 |
4,219 |
4,037 |
4,071 |
3,965 |
4,120 |
|
Committee |
1,147 |
1,182 |
1,153 |
1,246 |
1,262 |
1,200 |
1,116 |
1,131 |
1,114 |
1,153 |
|
Leadership |
204 |
182 |
175 |
180 |
126 |
234 |
164 |
158 |
177 |
160 |
|
Officers and Officials |
326 |
361 |
372 |
396 |
372 |
311 |
379 |
398 |
381 |
316 |
|
Totals |
5721 |
5946 |
5732 |
6168 |
5,940 |
5,964 |
5,696 |
5,758 |
5.637 |
5,749 |
Source: Senate telephone directories, CRS calculations.
Notes: All categories are based on a full count of directory listings. Senate telephone directories published in 1981, 1996, 2009, and 2013 provided listings for 99 Senators' offices. Before 1987, the Senate directories did not list congressional staff in Senators' state offices. Therefore, the staffing levels for "Senators' Offices", as well as the "Totals" from 1977 to 1986 do not reflect the same data as the years 1987 to 2016.
|
Year |
DC-Based |
State-Based |
Total Member |
DC % |
State % |
|
1977 |
2,068 |
||||
|
1978 |
2,215 |
||||
|
1979 |
2,173 |
||||
|
1980 |
2,296 |
||||
|
1981 |
2,308 |
||||
|
1982 |
2,385 |
||||
|
1983 |
2,454 |
||||
|
1984 |
2,430 |
||||
|
1985 |
2,409 |
||||
|
1986 |
2,474 |
||||
|
1987 |
2,351 |
935 |
3,286 |
71.55% |
28.45% |
|
1988 |
2,449 |
944 |
3,393 |
72.18% |
27.82% |
|
1989 |
2,381 |
973 |
3,354 |
70.99% |
29.01% |
|
1990 |
2,430 |
1,015 |
3,445 |
70.54% |
29.46% |
|
1991 |
2,439 |
1,173 |
3,612 |
67.52% |
32.48% |
|
1992 |
2,473 |
1,234 |
3,707 |
66.71% |
33.29% |
|
1993 |
2,332 |
1,261 |
3,593 |
64.90% |
35.10% |
|
1994 |
2,474 |
1,352 |
3,826 |
64.66% |
35.34% |
|
1995 |
2,422 |
1,349 |
3,771 |
64.23% |
35.77% |
|
1996 |
2,397 |
1,376 |
3,773 |
63.53% |
36.47% |
|
1997 |
2,318 |
1,360 |
3,678 |
63.02% |
36.98% |
|
1998 |
2,407 |
1,469 |
3,876 |
62.10% |
37.90% |
|
1999 |
2,375 |
1,426 |
3,801 |
62.48% |
37.52% |
|
2000 |
2,329 |
1,494 |
3,823 |
60.92% |
39.08% |
|
2001 |
2,258 |
1,381 |
3,639 |
62.05% |
37.95% |
|
2002 |
2,334 |
1,521 |
3,855 |
60.54% |
39.46% |
|
2003 |
2,378 |
1,537 |
3,915 |
60.74% |
39.26% |
|
2004 |
2,474 |
1,617 |
4,091 |
60.47% |
39.53% |
|
2005 |
2,436 |
1,611 |
4,047 |
60.19% |
39.81% |
|
2006 |
2,521 |
1,711 |
4,232 |
59.57% |
40.43% |
|
2007 |
2,394 |
1,650 |
4,044 |
59.20% |
40.80% |
|
2008 |
2,496 |
1,725 |
4,221 |
59.13% |
40.87% |
|
2009 |
2,370 |
1,659 |
4,029 |
58.82% |
41.18% |
|
2010 |
2,513 |
1,833 |
4,346 |
57.82% |
42.18% |
|
2011 |
2,417 |
1,763 |
4,180 |
57.82% |
42.18% |
|
2012 |
2,409 |
1,810 |
4,219 |
57.10% |
42.90% |
|
2013 |
2,321 |
1,716 |
4,037 |
57.49% |
42.51% |
|
2014 |
2,340 |
1,731 |
4,071 |
57.48% |
42.52% |
|
2015 |
2,257 |
1,708 |
3,965 |
56.92% |
43.08% |
|
2016 |
2,342 |
1,778 |
4,120 |
56.84% |
43.16% |
Source: Senate telephone directories, CRS calculations.
Notes: The Senate telephone directory did not provide listings for state-based staff prior to 1987. Senate telephone directories published in 1981, 1996, 2009, and 2013 provided listings for 99 Senators' offices.
|
Committee |
2007 |
2008 |
2009 |
2010 |
2011 |
2012 |
2013 |
2014 |
2015 |
2016 |
|
Agriculture, Nutrition, and Forestry |
30 |
35 |
32 |
43 |
37 |
39 |
33 |
30 |
34 |
33 |
|
Appropriations |
124 |
121 |
116 |
114 |
119 |
113 |
115 |
125 |
127 |
133 |
|
Armed Services |
51 |
53 |
49 |
50 |
49 |
51 |
45 |
48 |
50 |
49 |
|
Banking, Housing, and Urban Affairs |
41 |
46 |
48 |
60 |
51 |
51 |
47 |
54 |
40 |
44 |
|
Budget |
50 |
49 |
45 |
54 |
54 |
50 |
62 |
59 |
47 |
39 |
|
Commerce, Science, and Transportation |
69 |
69 |
69 |
65 |
69 |
71 |
62 |
62 |
74 |
71 |
|
Energy and Natural Resources |
42 |
44 |
47 |
52 |
54 |
51 |
54 |
47 |
43 |
50 |
|
Environment and Public Works |
41 |
40 |
45 |
44 |
45 |
41 |
43 |
39 |
42 |
37 |
|
Finance |
82 |
83 |
84 |
84 |
87 |
74 |
80 |
78 |
80 |
77 |
|
Foreign Relations |
52 |
46 |
47 |
66 |
63 |
62 |
50 |
51 |
55 |
48 |
|
Health, Education, Labor, and Pensions |
77 |
90 |
89 |
91 |
85 |
83 |
77 |
77 |
89 |
93 |
|
Homeland Security and Governmental Affairs |
89 |
100 |
112 |
127 |
123 |
123 |
93 |
122 |
85 |
104 |
|
Judiciary |
143 |
121 |
106 |
120 |
168 |
125 |
108 |
109 |
112 |
121 |
|
Rules and Administration |
22 |
22 |
20 |
23 |
23 |
21 |
21 |
21 |
19 |
18 |
|
Small Business and Entrepreneurship |
25 |
32 |
31 |
29 |
29 |
29 |
26 |
18 |
16 |
25 |
|
Veterans Affairs |
24 |
25 |
26 |
27 |
22 |
21 |
22 |
20 |
18 |
20 |
|
Select Ethics |
11 |
11 |
15 |
15 |
14 |
12 |
13 |
14 |
18 |
14 |
|
Indian Affairs |
16 |
20 |
20 |
21 |
17 |
24 |
14 |
17 |
21 |
21 |
|
Select Intelligence |
37 |
43 |
39 |
42 |
45 |
45 |
43 |
38 |
41 |
40 |
|
Select Aging |
23 |
23 |
13 |
20 |
16 |
15 |
16 |
23 |
19 |
22 |
Source: Senate telephone directories.
Notes: Committees are listed by names used in the 114th Congress, or most recent year in which the committee existed. "-"indicates that no staff were listed for that year. In some instances this was because the committee did not exist. In other instances, a directory listing for a panel was identified, but did not list any staff.
|
Committee |
1997 |
1998 |
1999 |
2000 |
2001 |
2002 |
2003 |
2004 |
2005 |
2006 |
|
Agriculture, Nutrition, and Forestry |
26 |
27 |
23 |
27 |
22 |
32 |
27 |
33 |
22 |
29 |
|
Appropriations |
63 |
61 |
87 |
89 |
102 |
90 |
101 |
118 |
120 |
118 |
|
Armed Services |
45 |
45 |
43 |
47 |
44 |
51 |
47 |
48 |
46 |
48 |
|
Banking, Housing, and Urban Affairs |
41 |
41 |
44 |
42 |
38 |
60 |
41 |
46 |
47 |
46 |
|
Budget |
44 |
45 |
44 |
48 |
46 |
52 |
50 |
49 |
47 |
49 |
|
Commerce, Science, and Transportation |
54 |
58 |
51 |
56 |
48 |
59 |
72 |
69 |
64 |
68 |
|
Energy and Natural Resources |
40 |
38 |
37 |
40 |
38 |
43 |
42 |
42 |
46 |
43 |
|
Environment and Public Works |
34 |
36 |
36 |
43 |
33 |
49 |
53 |
56 |
51 |
50 |
|
Finance |
45 |
52 |
52 |
46 |
52 |
56 |
60 |
62 |
53 |
63 |
|
Foreign Relations |
48 |
51 |
49 |
54 |
55 |
54 |
49 |
56 |
57 |
53 |
|
Health, Education, Labor, and Pensions |
76 |
85 |
98 |
86 |
76 |
72 |
74 |
90 |
95 |
92 |
|
Homeland Security and Governmental Affairs |
78 |
76 |
65 |
85 |
74 |
92 |
82 |
86 |
71 |
109 |
|
Judiciary |
85 |
93 |
84 |
98 |
82 |
112 |
115 |
129 |
127 |
137 |
|
Rules and Administration |
21 |
19 |
15 |
16 |
16 |
18 |
16 |
16 |
19 |
18 |
|
Small Business and Entrepreneurship |
19 |
17 |
18 |
20 |
22 |
29 |
21 |
22 |
24 |
28 |
|
Veterans Affairs |
21 |
38 |
19 |
16 |
18 |
19 |
20 |
17 |
22 |
23 |
|
Select Ethics |
8 |
11 |
10 |
11 |
11 |
11 |
9 |
9 |
10 |
10 |
|
Indian Affairs |
18 |
15 |
16 |
20 |
18 |
21 |
19 |
18 |
16 |
11 |
|
Select Intelligence |
27 |
34 |
33 |
29 |
31 |
32 |
30 |
34 |
28 |
42 |
|
Select Aging |
18 |
20 |
18 |
17 |
10 |
25 |
20 |
19 |
12 |
15 |
|
Select Year 2000 Technology Problem |
- |
- |
15 |
- |
- |
- |
- |
- |
- |
- |
Source: Senate telephone directories.
Notes: Committees are listed by names used in the 114th Congress, or most recent year in which the committee existed. "-"indicates that no staff were listed for that year. In some instances this was because the committee did not exist. In other instances, a directory listing for a panel was identified, but did not list any staff.
|
Committee |
1987 |
1988 |
1989 |
1990 |
1991 |
1992 |
1993 |
1994 |
1995 |
1996 |
|
Agriculture, Nutrition, and Forestry |
30 |
35 |
38 |
45 |
40 |
36 |
36 |
35 |
31 |
31 |
|
Appropriations |
78 |
78 |
84 |
80 |
79 |
81 |
78 |
72 |
71 |
61 |
|
Armed Services |
46 |
49 |
49 |
49 |
50 |
48 |
47 |
49 |
43 |
43 |
|
Banking, Housing, and Urban Affairs |
34 |
31 |
44 |
49 |
50 |
51 |
49 |
48 |
40 |
42 |
|
Budget |
61 |
61 |
54 |
58 |
58 |
55 |
56 |
52 |
46 |
39 |
|
Commerce, Science, and Transportation |
76 |
75 |
72 |
70 |
70 |
72 |
73 |
67 |
59 |
61 |
|
Energy and Natural Resources |
44 |
46 |
48 |
50 |
50 |
51 |
49 |
48 |
42 |
44 |
|
Environment and Public Works |
46 |
47 |
48 |
50 |
47 |
47 |
37 |
39 |
37 |
37 |
|
Finance |
54 |
54 |
54 |
54 |
58 |
57 |
49 |
49 |
47 |
53 |
|
Foreign Relations |
54 |
57 |
57 |
51 |
69 |
67 |
66 |
58 |
47 |
51 |
|
Health, Education, Labor, and Pensions |
95 |
107 |
104 |
102 |
106 |
102 |
93 |
108 |
81 |
79 |
|
Homeland Security and Governmental Affairs |
88 |
92 |
97 |
92 |
93 |
96 |
96 |
86 |
61 |
63 |
|
Judiciary |
101 |
100 |
98 |
111 |
105 |
119 |
106 |
106 |
86 |
93 |
|
Rules and Administration |
29 |
27 |
27 |
28 |
27 |
28 |
27 |
25 |
18 |
18 |
|
Small Business and Entrepreneurship |
22 |
20 |
21 |
22 |
21 |
21 |
19 |
22 |
19 |
20 |
|
Veterans Affairs |
25 |
26 |
25 |
26 |
24 |
26 |
21 |
21 |
18 |
17 |
|
Select Ethics |
9 |
7 |
9 |
11 |
11 |
10 |
11 |
12 |
11 |
9 |
|
Indian Affairs |
23 |
41 |
26 |
23 |
22 |
28 |
20 |
20 |
14 |
16 |
|
Select Intelligence |
38 |
40 |
41 |
40 |
40 |
41 |
32 |
36 |
24 |
30 |
|
Select Aging |
24 |
26 |
30 |
32 |
33 |
32 |
26 |
23 |
16 |
20 |
|
Select POW/MIA Affairs |
- |
- |
- |
- |
- |
15 |
- |
- |
- |
- |
|
Select Impeachment Trials |
- |
- |
2 |
- |
- |
- |
- |
- |
- |
- |
|
Select Investigations |
- |
- |
20 |
- |
- |
- |
- |
- |
- |
- |
|
Select Iran-Contra |
53 |
- |
- |
- |
- |
- |
- |
- |
- |
- |
Source: Senate telephone directories.
Notes: Committees are listed by names used in the 114th Congress, or most recent year in which the committee existed. "-"indicates that no staff were listed for that year. In some instances this was because the committee did not exist. In other instances, a directory listing for a panel was identified, but did not list any staff.
|
Committee |
1977 |
1978 |
1979 |
1980 |
1981 |
1982 |
1983 |
1984 |
1985 |
1986 |
|
Agriculture, Nutrition, and Forestry |
28 |
37 |
30 |
35 |
33 |
34 |
35 |
32 |
33 |
32 |
|
Appropriations |
69 |
67 |
74 |
89 |
63 |
76 |
81 |
81 |
80 |
82 |
|
Armed Services |
28 |
29 |
27 |
27 |
36 |
34 |
37 |
39 |
42 |
42 |
|
Banking, Housing, and Urban Affairs |
39 |
49 |
43 |
46 |
38 |
39 |
33 |
29 |
29 |
31 |
|
Budget |
47 |
79 |
67 |
77 |
63 |
70 |
73 |
74 |
68 |
63 |
|
Commerce, Science, and Transportation |
89 |
91 |
83 |
92 |
77 |
88 |
78 |
78 |
80 |
78 |
|
Energy and Natural Resources |
40 |
51 |
52 |
55 |
49 |
52 |
49 |
51 |
48 |
48 |
|
Environment and Public Works |
30 |
33 |
38 |
38 |
52 |
51 |
54 |
51 |
49 |
50 |
|
Finance |
28 |
34 |
36 |
40 |
45 |
50 |
45 |
53 |
54 |
55 |
|
Foreign Relations |
63 |
57 |
55 |
68 |
62 |
62 |
61 |
62 |
60 |
61 |
|
Health, Education, Labor, and Pensions |
93 |
122 |
118 |
121 |
118 |
123 |
123 |
112 |
101 |
105 |
|
Homeland Security Governmental Affairs |
108 |
153 |
140 |
156 |
113 |
121 |
120 |
117 |
94 |
99 |
|
Judiciary |
119 |
144 |
139 |
153 |
120 |
135 |
116 |
119 |
121 |
126 |
|
Rules and Administration |
27 |
30 |
30 |
31 |
30 |
32 |
29 |
28 |
29 |
28 |
|
Small Business and Entrepreneurship |
22 |
21 |
23 |
23 |
22 |
23 |
24 |
21 |
22 |
21 |
|
Veterans Affairs |
18 |
19 |
20 |
23 |
20 |
22 |
22 |
20 |
21 |
25 |
|
Select Ethics |
2 |
9 |
15 |
12 |
17 |
13 |
12 |
10 |
8 |
8 |
|
Indian Affairs |
0 |
25 |
26 |
15 |
13 |
14 |
19 |
20 |
19 |
23 |
|
Select Intelligence |
40 |
46 |
43 |
46 |
41 |
41 |
41 |
36 |
32 |
47 |
|
Select Aging |
19 |
19 |
19 |
21 |
28 |
28 |
25 |
34 |
25 |
27 |
|
Select Nutrition and Human Needs |
14 |
- |
- |
- |
- |
- |
- |
- |
- |
- |
|
Select Senate Committee Systems |
5 |
- |
- |
- |
- |
- |
- |
- |
- |
- |
|
Select Transition Staff for Former Postal Workers |
13 |
- |
- |
- |
- |
- |
- |
- |
- |
- |
Source: Senate telephone directories.
Notes: Committees are listed by names used in the 114th Congress, or most recent year in which the committee existed. "-"indicates that no staff were listed for that year. In some instances this was because the committee did not exist. In other instances, a directory listing for a panel was identified, but did not list any staff.
|
Joint Committee |
1977 |
1978 |
1979 |
1980 |
1981 |
1982 |
1983 |
1984 |
1985 |
1986 |
|
Economic |
46 |
51 |
53 |
58 |
46 |
43 |
44 |
44 |
40 |
39 |
|
Library of Congress |
- |
- |
2 |
2 |
2 |
2 |
3 |
3 |
3 |
3 |
|
Printing |
15 |
15 |
16 |
16 |
15 |
16 |
16 |
17 |
17 |
16 |
|
Taxation |
- |
63 |
60 |
63 |
58 |
59 |
60 |
60 |
62 |
68 |
|
Joint Committee |
1987 |
1988 |
1989 |
1990 |
1991 |
1992 |
1993 |
1994 |
1995 |
1996 |
|
Economic |
35 |
45 |
44 |
43 |
41 |
44 |
45 |
29 |
35 |
32 |
|
Library of Congress |
2 |
2 |
2 |
2 |
2 |
2 |
2 |
2 |
2 |
1 |
|
Printing |
17 |
17 |
14 |
16 |
14 |
14 |
17 |
16 |
7 |
8 |
|
Taxation |
66 |
64 |
59 |
70 |
66 |
73 |
73 |
71 |
60 |
61 |
|
Joint Committee |
1997 |
1998 |
1999 |
2000 |
2001 |
2002 |
2003 |
2004 |
2005 |
2006 |
|
Economic |
23 |
25 |
23 |
31 |
21 |
34 |
35 |
36 |
31 |
31 |
|
Library of Congress |
- |
- |
- |
- |
- |
- |
2 |
2 |
2 |
2 |
|
Printing |
9 |
8 |
- |
- |
1 |
2 |
2 |
4 |
4 |
4 |
|
Taxation |
56 |
60 |
62 |
58 |
57 |
58 |
60 |
65 |
64 |
57 |
|
Joint Committee |
2007 |
2008 |
2009 |
2010 |
2011 |
2012 |
2013 |
2014 |
2015 |
2016 |
|
Economic |
35 |
35 |
34 |
34 |
29 |
37 |
30 |
17 |
21 |
31 |
|
Library of Congress |
4 |
4 |
- |
- |
- |
- |
- |
- |
- |
- |
|
Printing |
4 |
4 |
- |
- |
- |
- |
- |
- |
- |
- |
|
Taxation |
55 |
66 |
66 |
65 |
63 |
62 |
62 |
62 |
63 |
63 |
Source: Senate telephone directories.
Notes: Individual staff members for the joint committees may appear in both the House and the Senate directories, as they are considered neither solely House nor solely Senate staff. They are included where they appear in the directory. Excludes staff listed at various times since 1977 for the Joint committees on Inaugural Ceremonies, Atomic Energy, Defense Production, Internal Revenue Service, and Organization of Congress. Staff data for those panels are available to congressional clients from the authors upon request. "-"indicates that no staff were listed in the relevant chamber for that year. In some instances, a directory listing for a panel was identified, but did not list any staff.