Teen Births in the United States: Overview and Recent Trends
Changes from May 13, 2020 to September 1, 2022
This page shows textual changes in the document between the two versions indicated in the dates above. Textual matter removed in the later version is indicated with red strikethrough and textual matter added in the later version is indicated with blue.
Summary
Teen Birth Trends: In Brief
September 1, 2022
The Centers for Disease Control and Prevention (CDC), the federal government'’s lead public health agency, has identified teen pregnancy as a major public health issue because of its high
Jessica Tollestrup
cost for families of teenage parents and society more broadly. The CDC highlights that the teen
Specialist in Social Policy
pregnancy rate has decreased steadily, dropping below CDC'’s target goal of 30.3 per 1,000
females aged 15 to 17 by 2015; however, the CDC also raises the concern that the United States has one of the highest rates of teen births of all industrialized countries.
This report discusses trends in teen birth rates—or the number of births per 1,000 females aged 15 to 19 each year—since the 1950s. The rate of teensteen births peaked in 1957 at 96.3. It then decreased in most years from the 1960s through the 1980s. From 1991 onward, the rate declined except in two years, 2006 and 2007. The greatest decline in teen birth rates has occurred in recent years. For example, from 2007 to 20182020, the rate declined by approximately 5863%. The 20182020 teen birth rate of 1715.4 was a historical low since CDC began collecting and reporting birth data in the 1940s.
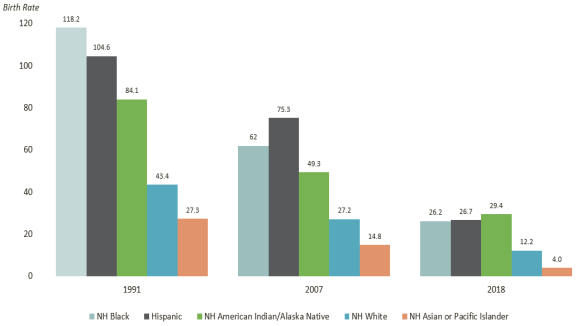
In nearly each year from 1991 through the recent period, the teen birth rate decreased for all racial and ethnic groups; however, the rates declined more for certain groups than others. While the birth rates for two groups (non-Hispanic blacks and Hispanics) declined more than the rate for white teens, their birth rates remained higher overall. In 2018, Hispanic (26.7), non-Hispanic black (26.2), and non-Hispanic American Indian/Alaska Native (29.4) teens had more than double the teen birth rate for non-Hispanic white (12.2) and non-Hispanic Asian or Pacific Islander (4.0) teens.
Teen birth rates have varied considerably by state and territory. In 2018In 2020, non-Hispanic American Indian or Alaska Native (25.7), non-Hispanic Black (24.4), Hispanic (23.5), and non-Hispanic Native Hawaiian or Other Pacific Islander (22.6) teens had more than double the teen birth rate than non-Hispanic White (10.4) and more than nine times the rate of non-Hispanic Asian (2.3) teens. From 2016 to 2020, birth rates fell by 41% for non-Hispanic Asian teens, 27% for non-Hispanic White teens, 27% for non-Hispanic American Indian or Alaska Native teens, 26% for Hispanic teens, 21% for non-Hispanic Native Hawaiian or Other Pacific Islander teens, and 17% non-Hispanic Black teens.
Teen birth rates have varied considerably by state and territory. In 2020, the state with the lowest reported rate was Massachusetts (7.26.1); the state with the highest reported rate was Arkansas (30.4Mississippi (27.9). Teen birth rates have declined in rural areas over time but remain relatively higher than rates in urban areas.
Research suggests that multiple trends have led to lower U.S. teen pregnancy and birth rates. From the 1990s through 2007, 2014, the risk of teen pregnancy decreased primarily because of improved contraceptive use, including an increase in the use of certain contraception methods (e.g., condoms), an increase in the use of multiple methods of contraception, and substantial declines in foregoing the use of contraception altogether. Some of the risk of pregnancy during this period decreased among younger teens because of decreased sexual activity. A primary factor for more recent declines in the risk of teen pregnancy has been the increasing use of contraceptives among sexually active teens. Broad economic and social variables may influence teen behaviors, such as whether they will abstain from sex or use contraceptives.
Teen pregnancy has high costs for teen parents, their children, and society more generally. Teenage mothers and fathers tend to have less education and are more likely to live in poverty than their peers who are not parents. Moreover, lower levels of education reduce teen parents'’ potential for economic self-sufficiency. Some analysis has looked at these societal impacts and the benefits of avoiding pregnancy during the teen years.
This report accompanies CRS Report R45183, Teen Pregnancy: Federal Prevention Programs, which discusses Congress's ’s current approach of supporting programs that seek to prevent pregnancy among teens; and CRS In Focus IF10877, Federal Teen Pregnancy Prevention Programs, which includes summary information about the programs.
Introduction
Congressional Research Service
link to page 4 link to page 4 link to page 9 link to page 10 link to page 5 link to page 7 link to page 8 link to page 12 link to page 12 link to page 13 Teen Birth Trends: In Brief
Contents
Introduction ..................................................................................................................................... 1 Teen Births in the United States ...................................................................................................... 1 Factors Likely Contributing to the Declining Risk of Teen Pregnancy ........................................... 6 Financial and Social Costs of Teen Births ....................................................................................... 7
Figures Figure 1. Teen Birth Rates, 1950-2020 ............................................................................................ 2 Figure 2. Teen Birth Rates by Race and Hispanic Origin, 2016-2020 ............................................ 4 Figure 3. Teen Birth Rates by State and Territory, 2020 ................................................................. 5
Tables
Table A-1. Teen Birth Rates, 1950-2020 ......................................................................................... 9
Appendixes Appendix. Additional Data on Teen Pregnancy .............................................................................. 9
Contacts Author Information ........................................................................................................................ 10
Congressional Research Service
Teen Birth Trends: In Brief
Introduction This report provides context for Congress about the U.S. teen birth rate—or the number of births per 1,000 females aged 15 to 19 each year—and its changes since the 1950s. Over this period, the teen birth rate has generally been in decline. This decline has been most significant in recent years, with the rate reaching a record low in 20182020 (most recent year available). Multiple factors have likely contributed to the decrease, though the influence of any single factor is not fully known. Reduced teen sexual activity, particularly among younger adolescents, could be one explanation. Increases in use of contraceptives, including highly effective and multiple methods, among sexually active teens could be another. Other factors, such as broader social and economic trends, may also be at play.
Despite the decline in the teen birth rate, Congress continues to be interested in the issue of teen birth because of its high social and economic costs for both individual families and society more generally.11 Further, disparities persist in teen birth rates among racial and ethnic subgroups and across states.
This report accompanies CRS Report R45183, Teen Pregnancy: Federal Prevention Programs, which discusses Congress'’s current approach of supporting programs that seek to prevent pregnancy among teens.
Teen Births in the United States
Data on births are distinct from data on pregnancies. The teen birth rate refers to the number of live births per 1,000 teen girls aged 15 through 19. The teen pregnancy rate includes the number of pregnancies per 1,000 teen girls aged 15 through 19, which encompasses live births, abortions, and fetal losses. Birth data account for nearly every birth in the United States, whereas pregnancy data are based on estimates of miscarriages and abortion numbers that draw on various reporting systems and surveys. The Centers for Disease Control and Prevention (CDC), the federal government'government’s lead public health agency, reports birth data on an annual basis (most recently for 20182020). The CDC and the Guttmacher Institute publish teen pregnancy rates. These rates are usually published a year or two after birth datamay not be available for more recent years because of the time required to incorporate data from the various data sources.2
2
1 Urban Institute, Kids Having Kids: Costs and Social Consequences of Teen Pregnancy, edited by Saul D. Hoffman and Rebecca A. Maynard, 2nd ed., 2008. (Hereinafter, Urban Institute, Kids Having Kids: Costs and Social Consequences of Teen Pregnancy.) See also, U.S. Department of Health and Human Services (HHS), CDC, Winnable Battles Final Report 2010-2015, https://www.cdc.gov/winnablebattles/index.html.
2 Power to Decide (formerly The National Campaign to Prevent Teen and Unplanned Pregnancy), “National Data,” https://powertodecide.org/what-we-do/information/national-state-data/national. The most recent pregnancy data were reported by the Guttmacher Institute, an organization that is committed to advancing sexual and reproductive health and rights in the United States; in 2017, an estimated 319,490 teens aged 15 to 19 became pregnant. Of these pregnancies, there were 78,390 legal abortions and 194,377 births. (Included in the total pregnancies are miscarriages, ectopic pregnancies, and still births, but a tabulation of these is not presented by this source.) In 2017, there were 14 pregnancies per 1,000 women aged 15–17 (down from a peak of 75 in 1989), and 57 pregnancies per 1,000 women aged 18–19 (down from a peak of 175 in 1991). Isaac Maddow-Zimet and Kathryn Kost, , Pregnancies, Births and Abortions in the United States, 1973–2017: National and State Trends by Age, Guttmacher Institute, 2021. See also, Sally C. Curtin et al., “Pregnancy Rates for U.S. Women Continue to Drop,” HHS, CDC, National Center for Health Statistics (NCHS), no. 136, December 2013. This publication includes 2012 data.
Congressional Research Service
1
link to page 5 link to page 12
Teen Birth Trends: In Brief
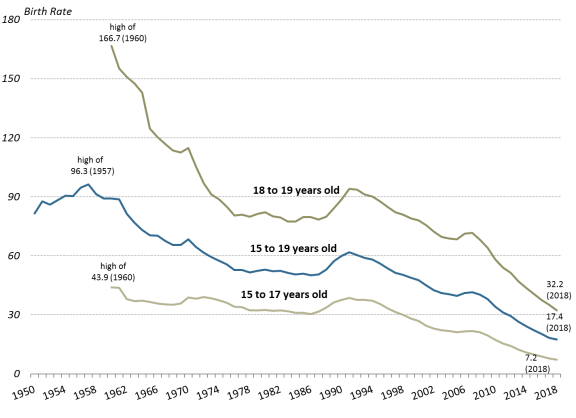
This report focuses on the teen birth rate. The CDC tracks birth rates by age and other characteristics of birth mothers. In 20182020, there were approximately 3.86 million births in the United States.33 About 180158,000 of these births (4.74%) were to teenagers aged 15 to 19.4 Figure 1 shows the U.S. teen birth rate from 1950 through 20182020 (the rate excludes the territories).
the fol owing: 1950-1959 data is from Stephanie J. Ventura et al., “Births to Teenagers in the United States, 1940–2000,” National Vital Statistics Report, vol. 49, no. 10, September 2001, https://www.cdc.gov/nchs/data/nvsr/nvsr49/nvsr49_10.pdf; 1960-2009 data is from Stephanie J. Ventura et al., “National and State Patterns of Teen Births in the United States, 1940–2013,” National Vital Statistics Report, vol. 63, no. 4, August 2014, https://www.cdc.gov/nchs/data/nvsr/nvsr63/nvsr63_04.pdf; 2010-2020 data is from Michelle J.K. Osterman et al., “Births: Final Data for 2020,” HHS, CDC, NCHS, National Vital Statistics Report, vol. 70, no. 17, February 2022, https://www.cdc.gov/nchs/data/nvsr/nvsr70/nvsr70-17.pdf.
3 Table A-1 includes birth rates for teens since 1950. Michelle J.K. Osterman et al., “Births: Final Data for 2020,” HHS, CDC, NCHS, National Vital Statistics Report, vol. 70, no. 17, February 2022 (Hereinafter, Michelle J.K. Osterman et al., “Births: Final Data for 2020.”)
4 The CDC also tracks births for youth aged 10 to 14; however, their birth rate has been much lower than the rate of births for older teens, and is therefore not included in this analysis. The birth rate was 0.2 births per 1,000 youth aged 10 to 14 in 2020.
Congressional Research Service
2
link to page 5 link to page 7 Teen Birth Trends: In Brief
The rate ticked up in the baby boom era of the 1950s, peaking in 1957 at 96.3. It then decreased in most years from the 1960s through the 1980s.55 From 1991 onward, the teen birth rate declined except in two years, 2006 and 2007. The rate dropped by 7275% from 1991 (61.8) to 2018 (172020 (15.4). In other words, about 6% of teens aged 15 to 19 gave birth in 1991 compared to less than 2% in 2018.
2020.
The greatest decline in the teen birth rate occurred in recent years. For example, from 2007 to 20182020, the rate declined by about 5863%. The 20182020 teen birth rate of 1715.4 was a historical low since CDC began collecting and reporting birth data in the 1940s. The CDC began tracking subgroup data for teens in 1960, when the teen birth rate was highest for both teens aged 15 to 17 (43.9 per 1,000) and teens aged 18 to 19 (166.7 per 1,000). Figure 1 indicates that the birth rate was higher in each year for the older teens compared to the younger teens. The 20182020 birth rates for 15- to 17-year-olds (7.26.3 per 1,000) and 18- to 19-year-olds (32.328.9 per 1,000) were the lowest on record.
Repeat teen births have also declined over time. CDC found the number of subsequent teen births among youthteens aged 15 to 19 declined nationally by nearly 54% from 2004 to 2015 (the most recent analysis available). The prevalence of teen births that were repeat births was highest among Hispanic youth, followed by non-Hispanic black and non-Hispanic white youth. Over this same period, the largest declines in the number of repeat births were among black teens (21.8%), followed by Hispanic (16.8%) and white (13.9%) teens.6CDC time series analysis available).6 In 2020, the repeat teen birth rate (calculated as the sum of teen birth rates for second and higher order births) was 2.2. The prevalence of repeat births was highest among non-Hispanic American Indian or Alaska Native teens (repeat teen birth rate of 4.2), followed by non-Hispanic Black (3.9) and Hispanic (3.5) teens.7 Teen mothers have also been less likely to be married than in previous years. In 20182020, the birth rate for unmarried teens aged 15 to 19 was 16.014.4 per 1,000. This is compared to 31.01 per 1,000 in 2010.7
8
Despite the overall decline in the teen birth rate, the rates for certain racial and ethnic groups remain relatively high. Teen birth rates in 20182020 varied based on race and ethnicity, with three groups—Hispanic (26four groups—non-Hispanic American Indian or Alaska Native (25.7), non-Hispanic black (26.2), and non-Hispanic American Indian/Alaska Native (29.4Black (24.4), Hispanic (23.5), and non-Hispanic Native Hawaiian or Other Pacific Islander (22.6) teens—having more than double the teen birth rate for non-Hispanic white (12.2) and non-Hispanic Asian or Pacific Islander (4.0) teens.8
White (10.4) and more than nine times the rate for non-Hispanic Asian (2.3) teens.9
Figure 2 shows the teen birth rate by race and Hispanic origin over three key years: 1991, when the teen birth rate started a long-term decline; 2007, the most recent year when the teen birth rate had ticked back up slightly; and 2018, the most recent year for which CDC compiled historical teen birth rate data by race and ethnicity. In nearly each year from 1991 through the recent period2016, 2018, and 2020. From 2016 to 2020, the teen birth rate decreased for all racial and ethnic groups; however, the rates declined more for certain groups compared to others.910 From 2007 to 20182016 to 2020, birth rates fell by 55% 41% for non-Hispanic whiteAsian teens, 4027% for non-Hispanic American Indian/White teens, 27% for non-Hispanic American Indian or Alaska Native teens, 58% for non-Hispanic black26% for Hispanic teens, 7321% for non-Hispanic Asian/Native Hawaiian or Other Pacific Islander teens, and 65% for Hispanic teens. While the birth rates for two groups (non-Hispanic black and Hispanic) had a greater decline than the rate for white teens, their birth rates remained higher.
17% for non-Hispanic Black teens.
5 The baby boom era refers to individuals born in the U.S. between mid-1946 and mid-1964. Sandra L. Colby and Jennifer M. Ortman, “The Baby Boom Cohort in the United States: 2012 to 2016, Population Estimates and Projections,” Current Population Reports, CDC, May 2014. 6 Deborah L. Dee et al., “Trends in Repeat Birth and Use of Postpartum Contraception Among Teens – United States, 2004 – 2015,” Morbidity and Mortality Weekly Report, April 28, 2017, vol., 66, no. 16. See Supplementary Table 1 for information about changes in repeat births among teens aged 15 to 19 within each of the 50 states and the District of Columbia.
7 Michelle J.K. Osterman et al., “Births: Final Data for 2020,” Table 5. 8 Michelle J.K. Osterman et al., “Births: Final Data for 2020,” Table 10. 9 Michelle J.K. Osterman et al., “Births: Final Data for 2020,” Table 2. 10 Ibid.
Congressional Research Service
3
link to page 7 link to page 7 link to page 8
Teen Birth Trends: In Brief
Figure 2. Teen Birth Rates by Race and Hispanic Origin, 2016-2020
Birth rate is per 1,000 females aged 15 to 19 for each racial/ethnic group
|
 |
Source: data/nvsr/nvsr70/nvsr70-17.pdf. Notes: NH = |
In 2018”
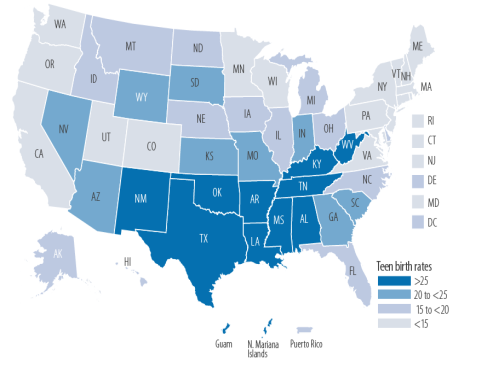
In 2020, the birth rate for teens aged 15 to 19 varied considerably by state and territory. The state with the lowest reported rate was Massachusetts (7.26.1); the state with the highest reported rate was Arkansas (30.4).
Mississippi (27.9).
Figure 3 shows a map with 20182020 teen birthsbirth rates in four data categories for the 50 states, the District of Columbia, and threefour of the territories. EighteenTwenty-six states had rates of less than 15 per 1,000 teens aged 15 to 19.11 Four1,000 teens aged 15 to 19: California, Colorado, Connecticut, Maine, Maryland, Massachusetts, Minnesota, New Hampshire, New Jersey, New York, Oregon, Pennsylvania, Rhode Island, Utah, Vermont, Virginia, Washington, and Wisconsin. Ten states had the highest teen birth rates (25 or higher): Alabama, Arkansas, Kentucky, Louisiana, Mississippi, New Mexico, Oklahoma, Tennessee, Texas, and West Virginia. The rates for the territories ranged from 19.3 in Puerto Rico to 34.4Mississippi, Arkansas, Louisiana, and Oklahoma. The rates for the territories ranged from 15.1 in the U.S. Virgin Islands to 33.0 in Guam.12 in Guam.10 From 2007 (when the birth rate last ticked up) to 2018, 2020, the teen birth rate decreased in each state or territory by between 1945% and 67%.11
73%.13
Teen birth rates have also declined in rural areas over time but remain relatively higher than rates in urban areas.14
11 Michelle J.K. Osterman et al., “Births: Final Data for 2020,” Table 8, HHS, CDC, NCHS, National Vital Statistics Report, vol. 70, no. 17, February 7, 2022, https://www.cdc.gov/nchs/data/nvsr/nvsr70/nvsr70-17.pdf.
12 Michelle J.K. Osterman et al., “Births: Final Data for 2020,” Table 8. 2020 data are not reported for American Samoa (2017 teen birth rate of 38.4), Joyce A. Martin et al., “Births: Final Data for 2017,” HHS, CDC, NCHS, National Vital Statistics Report, vol. 67, no. 8, November 7, 2018.
13 This is based on a Congressional Research Service analysis comparing data from 2007 to 2020. 14 Brady E. Hamilton, Lauren M. Roseen, and Amy M. Branum, “Teen Birth Rates for Urban and Rural Areas in the United States, 2007-2015,” HHS, CDC, NCHS, NCHS Data Brief, no. 264, November 2016; and April Sutton, Daniel T. Lichter, and Sharon Sassler, “Rural–Urban Disparities in Pregnancy Intentions, Births, and Abortions Among US Adolescent and Young Women, 1995–2017,” American Journal of Public Health, 109(12), December 2019, pp. 1762-1769.
Congressional Research Service
4
Teen Birth Trends: In Brief
in urban areas.12
.
While the U.S. teen birth rate has decreased over time, it has been higher than that of most other industrialized countries.1315 For comparison, the U.S. teen birth rate of 18.8 was about 50% higher than the rate of the United Kingdom, 12.6, in 2017 (based on the most recent international data available).14available that includes the U.S. teen birthrate).16 The reasons for the high teen birth rate in the United States relative to other industrial countries have not been fully explored. Economic conditions and income inequality within and between countries may play a role.15 Further, the research literature, which is somewhat dated and limited, indicates that use of contraceptives among teens appears to be greater in other developed countries compared to the United States.16
Factors Likely Contributing to the Declining Risk of Teen Pregnancy
Researchers suggest that multiple trends have driven down U.S. teen pregnancy and teen birth rates. They point to certain factors as the reason for declines over the 1990s through 2007. Research indicates that over this period, the risk of teen pregnancy decreased primarily because of improved contraceptive use, including an increase in the use of certain contraception methods (e.g., condoms), an increase in the use of multiple methods of contraception, and substantial declines in foregoing contraception.17 In addition, some of the risk of pregnancy decreased among younger teens, those ages 15 to 17, because of decreased sexual activity.18 A primary factor for more recent declines in the risk of teen pregnancy has also been the increasing use of contraceptives among sexually active teens. From 2007 through 2014, teens increased their contraceptive use, including the use of any method, the use of long-acting reversible contraceptives (LARCs; e.g., intrauterine devices, or IUDs, and birth control implants), and the use of the withdrawal method along with another method.19
Broad economic and social variables may influence teen behaviors, such as whether they will abstain from sex or use contraceptives.20 Behavioral changes may have been driven by a confluence of factors, such as expanded educational and labor market opportunities for women and improvements in contraceptive technology.21 Some observers theorize that the long-term downward trend in teen birth rates is attributable to the recession that began in 2007. They contend that during economic downturns the decrease in teen births—like the decrease in overall births—is partly due to teenagers being more careful as they witness the economic difficulties faced by their families.22 Despite this rationale, the teen birth rate continued to diminish after the recession (as well as during periods of economic expansion in the 1990s). Another possible explanation for the decline is the role of social media and increased use of the internet in teens' knowledge about sex and birth control. One analysis found that there were more rapid declines in rates of teen childbearing in places where the MTV show 16 and Pregnant was more widely viewed.23 The study extrapolated that teens changed their behavior (e.g., increasing the use of contraceptives) after viewing the show. Still, teen birth rates declined even after ratings for the show peaked.
Some observers contend that teen pregnancy prevention programs, such as those supported with federal funding, could potentially play a role in the declining birth rate for teenagers.24 However, the extent to which these programs have caused a decline in the teen birth rate is not fully known.25
Financial and Social Costs of Teen Births
Teen pregnancy has high costs for the families of teen parents and society more generally.26 Teenage mothers and fathers tend to have less education and are more likely to live in poverty than their peers who are not teen parents. For example,
- nearly one-third of teen girls who have dropped out of high school cite pregnancy or parenthood as a reason,
- about 7 out of 10 teen mothers who have moved out of their family's household live below the poverty level, and
- more than 60% of teen mothers receive some type of public benefits within the first year after their children are born.27
Lower levels of education reduce teen parents' potential for economic self-sufficiency. At the same time, being impoverished and having less education can also increase the likelihood of teens becoming pregnant in the first place.28 These poorer outcomes may be explained in part by underlying differences between those who give birth as teens and those who delay childbearing: teen mothers often come from more disadvantaged backgrounds (e.g., family more likely to receive public welfare benefits, parents have lower levels of education) than their counterparts who have children at a later age.29 In addition, teen sexual activity even among those who do not become pregnant can increase the risk of sexually transmitted infections (STIs), which can led to long-term health issues. Adolescents aged 15 to 19 have certain STIs at a rate that is among the highest of sexually active individuals.30
Further, teen childbearing can also affect the offspring of teen parents. Children of teenage mothers have poorer outcomes than children of mothers who give birth in their early 20s or later. They are generally more likely to (1) have chronic medical conditions, (2) use public health care, (3) have lower school readiness scores, (4) do poorly in school, (5) give birth during their teen years (females), and (6) be incarcerated (males).31 In addition to the consequences for teens and their families, teen childbearing has societal impacts.
One study examined these societal impacts, specifically estimating the cost savings to public programs that were associated with avoiding unintended pregnancies during the teen years. The Power to Decide32 did a simulation analysis to estimate the number of births to teenagers that had been averted due to the decrease in teen fertility rates from 1991 to 2015. The analysis then estimated total savings of $4.4 billion for this period, taking into consideration the cost savings to Medicaid that would have been associated with labor and delivery, postpartum care for the mother, and infant care; and receipt of Temporary Assistance for Needy Families (TANF), Supplemental Nutrition Assistance Program (SNAP), and Special Supplemental Nutrition Program for Women, Infants, and Children (WIC) benefits. Additional research of decreased or delayed teenage pregnancy and childbearing could help to inform the impacts for teen parents, their children, and society more generally.33
Appendix. Additional Data on Teen Pregnancy
|
Year |
Birth Rate |
Year |
Birth Rate |
Year |
Birth Rate |
|
1950 |
81.6 |
1973 |
59.3 |
1996 |
53.5 |
|
1951 |
87.6 |
1974 |
57.5 |
1997 |
51.3 |
|
1952 |
86.1 |
1975 |
55.6 |
1998 |
50.3 |
|
1953 |
88.2 |
1976 |
52.8 |
1999 |
48.8 |
|
1954 |
90.6 |
1977 |
52.8 |
2000 |
47.7 |
|
1955 |
90.3 |
1978 |
51.5 |
2001 |
45.0 |
|
1956 |
94.6 |
1979 |
52.3 |
2002 |
42.6 |
|
1957 |
96.3 |
1980 |
53.0 |
2003 |
41.1 |
|
1958 |
91.4 |
1981 |
52.2 |
2004 |
40.5 |
|
1959 |
89.1 |
1982 |
52.4 |
2005 |
39.7 |
|
1960 |
89.1 |
1983 |
51.4 |
2006 |
41.1 |
|
1961 |
88.6 |
1984 |
50.6 |
2007 |
41.5 |
|
1962 |
81.4 |
1985 |
51.0 |
2008 |
40.2 |
|
1963 |
76.7 |
1986 |
50.2 |
2009 |
37.9 |
|
1964 |
73.1 |
1987 |
50.6 |
2010 |
34.2 |
|
1965 |
70.5 |
1988 |
53.0 |
2011 |
31.3 |
|
1966 |
70.3 |
1989 |
57.3 |
2012 |
29.4 |
|
1967 |
67.5 |
1990 |
59.9 |
2013 |
26.5 |
|
1968 |
65.6 |
1991 |
61.8 |
2014 |
24.2 |
|
1969 |
65.5 |
1992 |
60.3 |
2015 |
22.3 |
|
1970 |
68.3 |
1993 |
59.0 |
2016 |
20.3 |
|
1971 |
64.5 |
1994 |
58.2 |
2017 |
18.8 |
|
1972 |
61.7 |
1995 |
56.0 |
2018 |
17.4 |
Source: Table prepared by the Congressional Research Service based on data from the Department of Health and Human Services, Centers for Disease Control and Prevention, National Center for Health Statistics.
Author Contact Information
Acknowledgments
Isaac Nicchitta, Research Assistant in CRS's Domestic Social Policy Division, provided invaluable support and editorial comments on this report.
Footnotes
| 1. |
Urban Institute, Kids Having Kids: Costs and Social Consequences of Teen Pregnancy, edited by Saul D. Hoffman and Rebecca A. Maynard, 2nd ed., 2008. (Hereinafter, Urban Institute, Kids Having Kids: Costs and Social Consequences of Teen Pregnancy.) See also, U.S. Department of Health and Human Services (HHS), CDC, Winnable Battles Final Report 2010-2015, https://www.cdc.gov/winnablebattles/index.html. |
| 2. |
Power to Decide (formerly The National Campaign to Prevent Teen and Unplanned Pregnancy), "National Data," https://powertodecide.org/what-we-do/information/national-state-data/national. The most recent pregnancy data were reported by the Guttmacher Institute, an organization that is committed to advancing sexual and reproductive health and rights in the United States; in 2013, an estimated 448,440 teens aged 15 to 19 became pregnant. Of these pregnancies, there were 65,590 miscarriages and still births; 109,740 legal abortions; and 273,105 births (these three numbers add up to five fewer than the total: 448,435). Between 2008 and 2013, the rate of teen pregnancy decreased by 36%. Kathryn Kost, Isaac Maddow-Zimet, and Alex Arpaia, Pregnancies, Births and Abortions Among Adolescents and Young Women in the United States, 2013: National Trends by Age, Race and Ethnicity, Guttmacher Institute, September 2017, p. 8. See also, Sally C. Curtin et al., "Pregnancy Rates for U.S. Women Continue to Drop," HHS, CDC, National Center for Health Statistics (NCHS), no. 136, December 2013. This publication includes 2012 data. |
| 3. |
|
| 4. |
The CDC also tracks births for youth aged 10 to 14; however, their birth rate has been much lower than the rate of births for older teens, and is therefore not included in this analysis. The birth rate was 0.2 births per 1,000 youth aged 10 to 14 in 2018. |
| 5. |
The baby boom era refers to individuals born in the U.S. between mid-1946 and mid-1964; Sandra L. Colby and Jennifer M. Ortman, "The Baby Boom Cohort in the United States: 2012 to 2016, Population Estimates and Projections," Current Population Reports, CDC, May 2014. |
| 6. |
Deborah L. Dee et al., "Trends in Repeat Birth and Use of Postpartum Contraception Among Teens – United States, 2004 – 2015," Morbidity and Mortality Weekly Report, April 28, 2017, vol., 66, no. 16. See Supplementary Table 1 for information about changes in repeat births among teens aged 15 to 19 within each of the 50 states and the District of Columbia. |
| 7. |
Joyce A. Martin, et al., "Births: Final Data for 2018," Table 10; and Joyce A. Martin, et al., "Births: Final Data for 2010," Table 15. |
| 8. |
This is based on Congressional Research Service correspondence with HHS, CDC, January 2020. |
| 9. |
Ibid. |
| 10. |
Joyce A. Martin et al., "Births: Final Data for 2018." Data are not reported for American Samoa (2017 teen birth rate of 38.4), or for the U.S. Virgin Islands (2016 teen birth rate of 25.4). Joyce A. Martin et al., "Births: Final Data for 2017," HHS, CDC, NCHS, National Vital Statistics Report, vol. 67, no. 8, November 7, 2018; and Joyce A. Martin, et al., "Births: Final Data for 2016," HHS, CDC, NCHS, National Vital Statistics Report, vol. 67, no. 1, January 31, 2018. |
| 11. |
This is based on a Congressional Research Service analysis comparing data from 2007 to 2018. |
| 12. |
Brady E. Hamilton, Lauren M. Roseen, and Amy M. Branum, "Teen Birth Rates for Urban and Rural Areas in the United States, 2007-2015," HHS, CDC, NCHS, NCHS Data Brief, no. 264, November 2016. |
| 13. |
Guttmacher Institute, "Teen Pregnancy Rates Declined in Many Countries between the Mid-1990s and 2011—United States Lags Behind Many Other Developed Nations," press release, January 23, 2015. |
| 14. |
United Nations, Statistics Division, "Demographic Yearbook 2018," https://unstats.un.org/unsd/demographic-social/products/dyb/documents/dyb2017/table10.pdf. The year 2017 is the most recent for which data are available for many of these countries. The most recent year available for Canada is 2009, when the rate of births among teens aged 15 to 19 was 14.1. See also, Gilda Sedgh et al., "Adolescent Pregnancy, Birth, and Abortion Rates Across Countries: Levels and Trends," Journal of Adolescent Health, vol. 56, no. 2 (February 2015), p. 228. (Hereinafter, Gilda Sedgh et al., "Adolescent Pregnancy, Birth, and Abortion Rates Across Countries: Levels and Trends.") |
| 15. |
John S. Santelli, Vinit Sharma, and Russell Viner, "Inequality, National Wealth, Economic Development and Global Trends in Teenage Birth Rates, 1990-2010," Journal of Adolescent Health, vol. 52, no. 1 (February 2013); and Melissa S. Kearney and Phillip B. Levine, "Why Is the Teen Birth Rate in the United States So High and Why Does It Matter?" Journal of Economic Perspectives, Spring: 26(2), 2012, pp. 141-166. (Hereinafter, Melissa S. Kearney and Phillip B. Levine, "Why Is the Teen Birth Rate in the United States So High and Why Does It Matter?") |
| 16. |
|
| 17. |
The risk of pregnancy is an index that calculates factors such as sexual activity, contraceptive use, and efficacy and failure of specific contraceptives. Jacqueline E. Darroch and Susheela Singh, Why Is Teenage Pregnancy Declining? The Roles of Abstinence, Sexual Activity and Contraceptive Use, The Guttmacher Institute, Occasional Report, 1999; John S. Santelli et al., "Can Changes in Sexual Behaviors Among High School Students Explain the Decline in Teen Pregnancy Rates in the 1990s?," Society for Adolescent Medicine, vol. 35, no. 2 (August 2004); and John S. Santelli et al., "Explaining Recent Declines in Adolescent Pregnancy in the United States: the Contribution of Abstinence and Improve Contraceptive Use," American Journal of Public Health, vol., 97, no. 5, 2007. (Hereinafter, John S. Santelli et al., "Explaining Recent Declines in Adolescent Pregnancy in the United States: the Contribution of Abstinence and Improve Contraceptive Use.") |
| 18. |
John S. Santelli et al., "Explaining Recent Declines in Adolescent Pregnancy in the United States: the Contribution of Abstinence and Improve Contraceptive Use." |
| 19. |
Ibid. See also, Heather D. Boonstra, "What Is Behind the Declines in Teen Pregnancy Rates?" Guttmacher Policy Review, vol. 17, no. 3, September 3, 2014. (Hereinafter, Heather D. Boonstra, "What Is Behind the Declines in Teen Pregnancy Rates?") |
| 20. |
Heather D. Boonstra, "What Is Behind the Declines in Teen Pregnancy Rates?" and Melissa S. Kearney and Phillip B. Levine, "Investigating Recent Trends in the U.S. Teen Birth Rate." Melissa S. Kearney and Phillip B. Levine, "Investigating Recent Trends in the U.S. Teen Birth Rate," Journal of Health Economics, vol., 41, 2015. See also, Sarah Kliff, "The Mystery of the Falling Teen Birth Rate," Vox, January 21, 2015. (Hereinafter, Sarah Kliff, "The Mystery of the Falling Teen Birth Rate.") |
| 21. |
Melissa S. Kearney and Phillip B. Levine, "Investigating Recent Trends in the U.S. Teen Birth Rate," Journal of Health Economics, vol., 41, 2015. |
| 22. |
Sarah Kliff, "The Mystery of the Falling Teen Birth Rate." |
| 23. |
Melissa S. Kearney and Phillip B. Levine, "Media Influences on Social Outcomes: The Impact of MTV's 16 and Pregnant on Teen Childbearing," American Economic Review, vol. 105, no. 12 (2012). |
| 24. |
See CRS Report R45183, Teen Pregnancy: Federal Prevention Programs for further information about current programs that are federally funded. |
| 25. |
Sarah Kliff, "The Mystery of the Falling Teen Birth Rate" and Heather D. Boonstra, "What Is Behind the Declines in Teen Pregnancy Rates?" |
| 26. |
HHS, CDC, Winnable Battles Final Report. |
| 27. |
Power to Decide (formerly The National Campaign to Prevent Teen and Unplanned Pregnancy), Why It Matters: Teen Childbearing, Education, and Economic Wellbeing, July 2012. |
| 28. |
Urban Institute, Kids Having Kids: Costs and Social Consequences of Teen Pregnancy. |
| 29. |
Melissa S. Kearney and Phillip B. Levine, "Why Is the Teen Birth Rate in the United States So High and Why Does It Matter?"; and Urban Institute, Kids Having Kids: Costs and Social Consequences of Teen Pregnancy. |
| 30. |
HHS, CDC, Sexually Transmitted Disease Surveillance 2016, September 2017. |
| 31. |
Emily Holcombe, Kristen Peterson, and Jennifer Manlove, Ten Reasons to Still Keep the Focus on Teen Childbearing, Child Trends, March 2009; and Urban Institute, Kids Having Kids: Costs and Social Consequences of Teen Pregnancy. |
| 32. |
The Power to Decide is a Washington, DC-based organization that promotes that all young people have access to the sexual health information, reproductive health services, and sense of possibility that they need to decide if, when, and under what circumstances to get pregnant and have a child. The Power to Decide, 2018 Annual Report, p. 12. |
| 33. |
Kelleen Kaye and Alison Ng, Estimating the State and National Savings Associated with Declines in Teen Childbearing, Power to Decide, January 2018. The decrease in teen births is based on the additional number of teen births estimated to have occurred in 2015 if the teen birth rate remained the same as in 1991. |