U.S. Forest Carbon Data: In Brief
Changes from April 15, 2020 to May 5, 2020
This page shows textual changes in the document between the two versions indicated in the dates above. Textual matter removed in the later version is indicated with red strikethrough and textual matter added in the later version is indicated with blue.
U.S. Forest Carbon Data: In Brief
Contents
Figures
Introduction
The flux—or flow—of carbon dioxide (CO2) and other greenhouse gases into the atmosphere is the dominant contributor to the observed warming trend in global temperatures.1 Trees, however, store (sequester) CO2 from the atmosphere, accruing significant stores of carbon over time. Trees also release some CO2 back into the atmosphere. This process is known as the forest carbon cycle.
The forest carbon cycle starts with the sequestration and accumulation of atmospheric CO2 due to tree growth. The accumulated carbon is stored in five different pools in the forest ecosystem: aboveground biomass (e.g., leaves, trunks, and limbs), belowground biomass (e.g., roots), deadwood, litter (e.g., fallen leaves and stems), and soils. As trees or parts of trees die, the carbon cycles through those different pools, specifically from the living biomass pools to the deadwood, litter, and soil pools. The length of time carbon stays in each pool varies considerably, ranging from months (litter) to millennia (soil). The cycle continues as carbon flows out of the forest ecosystem and returns to the atmosphere through several processes, including respiration, combustion (e.g., fire), and decomposition. Carbon also leaves the forest ecosystem through timber harvests, by which it enters the product pool. This carbon is stored in harvested wood products (HWPs) while they are in use but eventually will return to the atmosphere upon the wood products' disposal and eventual decomposition, which could take several decades or more. In total, there are seven pools of forest carbon: five in the forest ecosystem and two in the product pool (HWPs in use and HWPs in disposal sites).
Carbon is always moving through the pools of forested ecosystems. The size of the various pools and the rate at which carbon moves through them vary considerably over time. The amount of carbon sequestered in a forest relative to the amount of carbon released into the atmosphere is constantly changing with tree growth, death, and decomposition. If the total amount of carbon released into the atmosphere by a given forest over a given period is greater than the amount of carbon sequestered in that forest, the forest is a net source of carbon emissions to the atmosphere. If the forest sequesters more carbon than it releases into the atmosphere, the forest is a net sink of carbon.
These forest carbon dynamics are driven in large part by different anthropogenic and ecological disturbances. Anthropogenic disturbances are planned activities, such as timber harvests, whereas ecological disturbances are unplanned, such as weather events (e.g., hurricanes, ice storms, droughts), insect and disease infestations, and wildfires. Generally, disturbances result in tree mortality, causing the transfer of carbon from the living pools to the deadwood, litter, soil, and product pools, and/or eventually to the atmosphere. If a disturbed site regenerates as forest, the carbon releases caused by the disturbance generally are offset over time. If, however, the site changes to a different land use (e.g., agriculture), the carbon releases may not be offset.
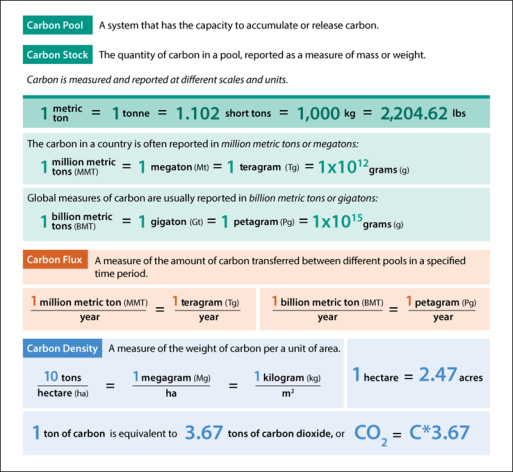
Congressional debates over climate policy have often included ideas for optimizing carbon sequestration in forests as a potential mitigation strategy for global warming. To facilitate those debates, this report provides data on the amount of carbon that is stored in and flows through U.S. forests. Since the early 1990s, the U.S. Environmental Protection Agency (EPA) has prepared an annual Inventory of U.S. Greenhouse Gas Emissions (Inventory), which has included an accounting of carbon in U.S. forests in the Land Use, Land-Use Change, and Forestry (LULUCF) sector.2 Estimates of forestland area and forest inventory data are used to estimate carbon stocks, or the amount of carbon stored in a pool. Carbon flux is then measured by comparing changes in forest carbon stocks over time. This report includes data for the most recent year available as well as data for every five years back to 1990, as available.3 Figure 1 introduces some of the terms and units for measuring and reporting carbon that are used throughout this report. An accompanying report, CRS Report R46312, Forest Carbon Primer, addresses basic questions concerning carbon sequestration in forests and provides an overview of forest carbon accounting methodologies.
 |
|
Source: CRS, adapted from Maria Janowiak et al., Considering Forest and Grassland Carbon in Land Management, U.S. Department of Agriculture, Forest Service, GTR-WO-95, June 2017, p. 4. Notes: Because much of the data for this report are based on international standards, this report uses the metric system for consistency purposes. Forest carbon stocks are reported as measures of carbon, whereas greenhouse gas emissions and removals (e.g., sequestration) are reported as measures of carbon dioxide or carbon dioxide equivalents (to facilitate comparisons with other greenhouse gases). As a chemical element, the mass of carbon (C) is based on its molecular weight. Carbon dioxide (CO2) is a compound consisting of one part carbon and two parts of the element oxygen (O). The conversion factor between C and CO2 is the ratio of their molecular weights. The molecular weight of carbon is 12 atomic mass units (amu), and the molecular weight of CO2 is 44 amu, which equals a ratio of 3.67. The same method is used to convert measurements of other greenhouse gases to carbon dioxide equivalents (CO2 eq.). |
U.S. Forest Carbon Stocks
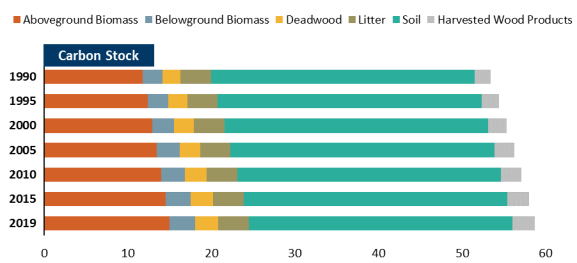
According to the Inventory, U.S. forests stored 58.7 billion metric tons (BMT) of carbon in 2019 (see Figure 2 and Table 1).43 The majority of forest carbon was stored in the forest ecosystem pools (95%); the remainder was stored in the product pool (i.e., harvested wood products, HWP). The largest pool of carbon was forest soils, which contained approximately 54% of total forest carbon in 2019. The next-largest pool was aboveground biomass, which contained approximately 26% of the total. Each of the other pools stored less than 6% of the total carbon.
Since 1990, U.S. forest carbon stocks have increased 10%. Nearly all forest pools have gained more carbon as of 2019. The exceptions are the litter and soil pools, which each continue to store around the same amount of carbon each year. Overall forest carbon stocks have increased annually (Figure 2), meaning U.S. forests have been a net carbon sink, absorbing more carbon out of the atmosphere than they release (discussed in "Carbon Emissions and Sinks from U.S. Forests," below).
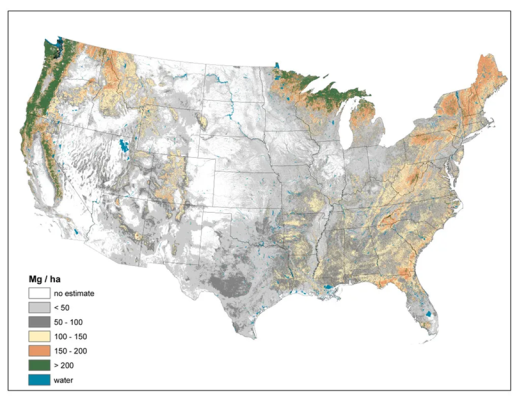
About one-third of the United States is forested.54 These forested areas vary considerably by location, climate, vegetation type, and disturbance histories, among other factors. Because of this variation, U.S. forests contain varying amounts of carbon stored in varying proportions across the different forest pools. See Figure 3 for an example of how carbon density, the amount of carbon within a certain area, varies across the 48 conterminous states. The forests in the Pacific Northwest and Great Lakes regions contain the highest carbon density in these states.65 The distribution of the carbon across different pools differs between those two regions, however. In the Pacific Northwest and along the West Coast, generally, most of the carbon is stored in the above- and belowground biomass pools; in the Great Lakes region, most of the carbon is stored in the soil. Forests in other parts of the United States generally vary in whether the majority of forest carbon is stored in living biomass or soils, with a few exceptions.76 The forests in Alaska are estimated to contain significant stocks of carbon, with the vast majority in the soil.87
|
Pool |
1990 |
1995 |
2000 |
2005 |
2010 |
2015 |
2019 |
|
|
MMT C |
% of Total |
|||||||
|
Forest Ecosystem |
51,527 |
52,358 |
53,161 |
53,886 |
54,663 |
55,431 |
56,051 |
95% |
|
Aboveground Biomass |
11,833 |
12,408 |
12,962 |
13,484 |
14,020 |
14,561 |
14,989 |
26% |
|
Belowground Biomass |
2,350 |
2,483 |
2,612 |
2,734 |
2,858 |
2,982 |
3,081 |
5% |
|
Deadwood |
2,120 |
2,233 |
2,346 |
2,454 |
2,568 |
2,683 |
2,777 |
5% |
|
Litter |
3,662 |
3,670 |
3,676 |
3,647 |
3,646 |
3,638 |
3,641 |
6% |
|
Soil (Mineral and Organic) |
31,563 |
31,564 |
31,565 |
31,568 |
31,570 |
31,567 |
31,564 |
54% |
|
Harvested Wood Products (HWP) |
1,895 |
2,061 |
2,218 |
2,353 |
2,462 |
2,567 |
2,669 |
5% |
|
HWP in Use |
1,249 |
1,326 |
1395 |
1,447 |
1,471 |
1,490 |
1,521 |
3% |
|
HWP in Disposal |
646 |
735 |
823 |
906 |
991 |
1,076 |
1,148 |
2% |
|
Total C Stock |
53,423 |
54,419 |
55,380 |
56,239 |
57,124 |
57,998 |
58,720 |
100% |
Sources: Data for 2019 from EPA, Table 6-12 in Chapter 6, "Land Use, Land-Use Change, and Forestry," in U.S. National Greenhouse Gas Inventory, April 13, 2020. Data for all other years from EPA, Table A-230 in Annex 3 Part B: "Methodological Descriptions for Additional Source or Sink Categories," in U.S. National Greenhouse Gas Inventory, April 13, 2020.
Notes: Data reflect carbon stocks for managed forestland remaining forestland in Alaska and the conterminous 48 states and do not include Hawaii or the U.S. territories. The years were selected to show carbon stocks over time at regular intervals; 2019 is the most recent year for which data are available. Columns may not add due to rounding.
Carbon Emissions and Sinks from U.S. Forests
Carbon flux is the annual change in carbon stocks. The flux estimate for any given year (e.g., 2018) is the change between stock estimates for that year (2018) and the following year (2019). Negative values indicate more carbon was sequestered than was released in that year (e.g., net carbon sink); positive values indicate more carbon was released than was sequestered in that year (e.g., net carbon source).
According to the Inventory, U.S. forests were a net carbon sink in 2018, having sequestered 774 MMT CO2 equivalents (or 211 MMT of carbon) that year (see Figure 4, Table 2, and Table 3).98 This total represents an offset of approximately 12% of the gross greenhouse gas emissions from the United States in 2018.109
The net sink reflects carbon accumulation on existing forestland and carbon accumulation associated with land converted to forestland within the past 20 years. Most of the sink is associated with existing forests (86%). Within the carbon pools, most of the flux is associated with aboveground biomass (58%). The carbon flux into the living biomass pools (above and below ground) reflects net carbon accumulation from the atmosphere; the carbon flux into the other pools represents the net of the flux of carbon from the living biomass pools into those pools relative to the flux of carbon out of those pools.
Although soils store significant amounts of carbon, the carbon accumulates slowly over long periods of time, so the annual flux is minimal. In some years, soils are a net source of carbon to the atmosphere. Overall, the annual net flux of carbon into U.S. forests is small relative to the amount of carbon they store. For example, U.S. forests gained an additional 211 MMT of carbon between 2018 and 2019, but that represents only a 0.3% increase to the total forest carbon stock (58.7 BMT of carbon). In addition, the total stock of carbon stored in forests is equivalent to the sum of several decades of U.S. greenhouse gas emissions.11
From 1990 to 2018, U.S. forests were a net carbon sink. However, the net amount of carbon sequestered by U.S. forests varies annually. As stated earlier, interannual variation depends largely on the size, duration, and severity of unplanned disturbances, which disrupt forest ecosystems. For example, wildfire activity in Alaska drives a significant portion of the interannual variability, due in part to fluctuations in the size of the area in the state affected by wildfire each year and because more of the carbon in Alaska is stored in pools (e.g., litter) that are likely to be combusted in a fire as compared to other states.1211 Other factors influencing the net flux of carbon in U.S. forests over the time series include management activities (e.g., timber harvests) and land use trends (e.g., afforestation or deforestation).1312
Although the Inventory reflects the net carbon flux associated with forest disturbances through annual changes in the carbon stock, recent iterations of the Inventory also have included the estimated emissions specifically associated with wildfires. The Inventory reports that wildfires, including prescribed fires, resulted in emissions of 170 MMT CO2 equivalents in 2017, the most recent year available.1413 Annual forest carbon emissions from wildfire vary significantly, because wildfire activity varies annually. For example, the Inventory reports that wildfire-related emissions in the previous year (2016) were significantly lower: 51 MMT CO2 equivalents.
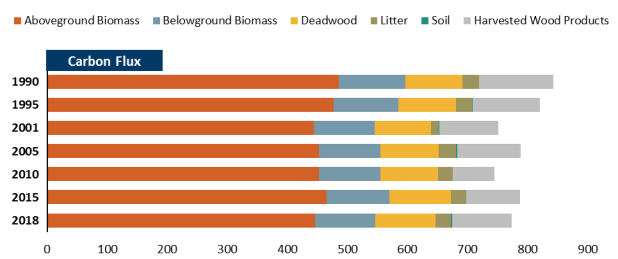
Table 2. U.S. Forest Carbon Flux by Pool, Carbon Dioxide Equivalents
(million metric tons [MMT] per year, CO2 equivalents)
|
Carbon Pool |
1990 |
1995 |
2001 |
2005 |
2010 |
2015 |
2018 |
|
|
CO2 Eq. |
% of Total |
|||||||
|
Forest Ecosystem |
-720 |
-708 |
- |
-683 |
-666 |
-698 |
-675 |
87% |
|
Aboveground Biomass |
-486 |
-477 |
- |
-452 |
-452 |
-466 |
-446 |
58% |
|
Belowground |
-110 |
-108 |
- |
-103 |
-102 |
-105 |
-101 |
13% |
|
Deadwood |
-95 |
-96 |
- |
-98 |
-97 |
-102 |
-100 |
13% |
|
Litter |
-28 |
- |
-28 |
-25 |
-26 |
-26 |
3% |
|
|
Soil |
-0.3 |
-1 |
- |
-2 |
9 |
0.5 |
-2 |
0% |
|
Harvested Wood Products (HWP) |
-124 |
-112 |
- |
-106 |
-69 |
-89 |
-99 |
13% |
|
HWP in Use |
-55 |
-52 |
- |
-43 |
-7 |
-25 |
-32 |
4% |
|
HWP in Disposal |
-69 |
-61 |
- |
-63 |
-62 |
-64 |
-67 |
9% |
|
Total Carbon Flux |
-843 |
-821 |
- |
-789 |
-736 |
-787 |
-774 |
— |
Sources: Data for 2018 from EPA, Tables 6-10 and 6-26 in Chapter 6, "Land Use, Land-Use Change, and Forestry," in U.S. National Greenhouse Gas Inventory, April 13, 2020. Data for all other years from EPA, Table A-228 in Annex 3 Part B: "Methodological Descriptions for Additional Source or Sink Categories," in U.S. National Greenhouse Gas Inventory, April 13, 2020 and "2020 Main Report Tables" available from https://www.epa.gov/ghgemissions/inventory-us-greenhouse-gas-emissions-and-sinks-1990-2018.
Notes: Negative values indicate more carbon was sequestered than was released in that year (e.g., carbon sink); positive values indicate more carbon was released than was sequestered in that year (e.g., carbon source). Data reported to the tenths only for values between -1 and 1. Data reflect flux estimates for forest remaining forestland and land converted to forestland (forest ecosystem pools only) for managed forestland in Alaska and the conterminous 48 states and do not include Hawaii or the U.S. territories. The years were selected to show carbon stocks over time at regular intervals; 1990 is the first year data are available, and 20192018 is the most recent year data are available. As of the date of publication, complete data were not available for the year 2000, so data for 2001 are presented instead. Columns may not add due to rounding.
|
Carbon Pool |
1990 |
1995 |
2001 |
2005 |
2010 |
2015 |
2018 |
|
|
MMT C |
% of Total |
|||||||
|
Forest Ecosystem |
-196 |
-193 |
- |
-186 |
-182 |
-190 |
-184 |
87% |
|
Aboveground Biomass |
-132 |
-130 |
- |
-123 |
-123 |
-127 |
-122 |
58% |
|
Belowground |
-30 |
-30 |
-28 |
-28 |
-28 |
-29 |
-27 |
13% |
|
Deadwood |
-26 |
-26 |
-26 |
-27 |
-26 |
-28 |
-27 |
13% |
|
Litter |
-8 |
-7 |
- |
-8 |
-7 |
-7 |
-7 |
3% |
|
Soil |
-0.1 |
0 |
- |
-0.6 |
3 |
0.1 |
-0.6 |
0% |
|
Harvested Wood Products (HWP) |
-34 |
-31 |
- |
-29 |
-19 |
-24 |
-27 |
13% |
|
HWP in Use |
-15 |
-14 |
- |
-12 |
-2 |
-7 |
-9 |
4% |
|
HWP in Disposal |
-19 |
-17 |
-17 |
-17 |
-17 |
-18 |
-18 |
9% |
|
Total Carbon Flux |
-230 |
-224 |
- |
-215 |
-201 |
-215 |
-211 |
— |
Sources: Data for 2018 from EPA, Tables 6-11 and 6-27 in Chapter 6, "Land Use, Land-Use Change, and Forestry," in U.S. National Greenhouse Gas Inventory, April 13, 2020. Data for all other years from EPA, Table A-229 in Annex 3 Part B: "Methodological Descriptions for Additional Source or Sink Categories," in U.S. National Greenhouse Gas Inventory, April 13, 2020.
Notes: Negative values indicate more carbon was sequestered than was released in that year (e.g., carbon sink); positive values indicate more carbon was released than was sequestered in that year (e.g., carbon source). Data reported to the tenths only for values between -1 and 1. Data reflect flux estimates for forest remaining forestland and land converted to forestland (forest ecosystem pools only) for managed forestland in Alaska and the conterminous 48 states and do not include Hawaii or the U.S. territories. The years were selected to show carbon stocks over time at regular intervals; 1990 is the first year data are available, and 20192018 is the most recent year data are available. As of the date of publication, complete data were not available for the year 2000, so data for 2001 are presented instead. Columns may not add due to rounding.
Author Contact Information
Footnotes
| 1. |
Other greenhouse gases include methane (CH4), nitrous oxide (N2O), and several fluorinated gases. D. J. Wuebbles et al., "Executive Summary," in Climate Science Special Report: Fourth National Climate Assessment (NCA), Volume II, U.S. Global Change Research Program, 2018. |
| 2. |
Environmental Protection Agency (EPA), Inventory of U.S. Greenhouse Gas Emissions and Sinks, 1990-2018, EPA 430-R-20-002, April 13, 2020. Hereinafter referred to as EPA Inventory (2020). |
| 3. |
|
| 4. |
|
|
The total land area of the United States is approximately 936 million hectares (2.3 billion acres, not including the U.S. territories). Estimates for U.S. forestland area vary primarily based on how forestland is defined. See for example, S. Oswalt et al., Forest Resources of the United States (FROTUS), 2017, USDA Forest Service, GTO-WO-97, March 2019, estimating 310 million hectares (766 million acres) of forestland. In contrast, the EPA Inventory defines forest area more narrowly and estimates 289 million hectares (714 million acres) of forestland in 2019 (EPA Inventory (2020): Ch. 6—LULUCF, pp. 6.11, 6.15). |
|
|
Barry Wilson et al., "Imputing Forest Carbon Stock Estimates from Inventory Plots to a Nationally Continuous Coverage," Carbon Balance and Management, vol. 8, no. 1 (2013). Hereinafter referred to as Wilson et al., 2013. |
|
|
In some areas of the Rocky Mountains, the majority of carbon is stored in deadwood and litter (Ibid.). |
|
|
U.S. Geological Survey, Baseline and Projected Future Carbon Storage and Greenhouse-Gas Fluxes in Ecosystems of Alaska, Professional Paper 1826, 2016, and EPA Inventory (2020): Ch. 6—LULUCF, p. 28. |
|
|
EPA Inventory (2020): Ch. 6—LULUCF. |
|
|
In 2018, gross U.S. greenhouse gas emissions were 6.68 billion metric tons of CO2 equivalents (Table 2-1, EPA Inventory (2020): Ch. 2: Trends in Greenhouse Gas Emissions, p. 2.5). |
|
|
David N. Wear and John W. Coulston, "From Sink to Source: Regional Variation in U.S. Forest Carbon Futures," Scientific Reports, vol. 5, no. 16518 (2015). Hereinafter referred to as Wear and Coulston, 2015. |
|
|
EPA Inventory (2020): Ch. 6—LULUCF, p. 6.28. |
|
|
Afforestation is the conversion of non-forestland to forest; deforestation is the conversion of forestland to non-forestland. For more information on the impacts of land use change on forest carbon, see CRS Report R46312, Forest Carbon Primer, by Katie Hoover and Anne A. Riddle. |
|
|
Table 6-13 and Table 6-17 in EPA Inventory (2020): Ch. 6—LULUCF. |