The 10-20-30 Provision: Defining Persistent Poverty Counties
Changes from February 3, 2020 to February 24, 2021
This page shows textual changes in the document between the two versions indicated in the dates above. Textual matter removed in the later version is indicated with red strikethrough and textual matter added in the later version is indicated with blue.
The 10-20-30 Provision: Defining Persistent Poverty Counties
Contents
- Introduction
- Motivation for Targeting Funds to Persistent Poverty Counties
- Defining "Persistent Poverty" Counties
- Computing the Poverty Rate for an Area
- Data Sources Used in Identifying Persistent Poverty Counties
- Considerations When Identifying and Targeting Persistent Poverty Counties
- Selecting the Data Source: Strengths and Limitations of ACS and SAIPE Poverty Data
- Characteristics of Interest: SAIPE for Poverty Alone; ACS for Other Topics in Addition to Poverty
- Geographic Area of Interest: SAIPE for Counties and School Districts Only; ACS for Other Small Areas
- Reference Period of Estimate: SAIPE for One Year, ACS for a Five-Year Span
- Other Considerations
- Treatment of Special Populations in the Official Poverty Definition
- "Persistence" Versus Flexibility to Recent Situations
- Effects of Rounding and Data Source Selection on Lists of Counties
- Example List of Persistent Poverty Counties
Tables
- Table 1. Number of Counties Identified as Persistently Poor, Using Different Datasets and Rounding Methods
- Table 2. List of Persistent Poverty Counties, Based on 1990 Census, Census 2000, and 2018 Small Area Income and Poverty Estimates (SAIPE), Using Poverty Rates of 19.5% or Greater
- Table A-1. U.S. Census Bureau's Guidance on Poverty Data Sources by Geographic Level and Type of Estimate
Appendixes
Summary
Antipoverty interventions that provide resources to local communities, based on the characteristics of those communities, have been of interest to Congress. One such policy, dubbed the "10-20-30 provision," was24, 2021
Poverty Counties
Joseph Dalaker
Research has suggested that areas for which the poverty rate (the percentage of the
Analyst in Social Policy
population that is below poverty, or economic hardship as measured by comparing
income against a dollar amount that represents a low level of need) reaches 20% experience more acute systemic problems than in lower-poverty areas. Recent
congresses have enacted antipoverty policy interventions that target resources on local communities based on the characteristics of those communities, rather than solely on those of individuals or
families. One such policy, dubbed the 10-20-30 provision, was first implemented in the American Recovery and Reinvestment Act of 2009 (ARRA, P.L. 111-5). Title I, Section 105 of ARRA required the Secretary of Agriculture to allocateal ocate at least 10% of funds from three rural development program accounts to persistent poverty counties; that is, to counties—counties that have hadmaintained poverty rates of 20% or more for the past 30 years, as measured by the 1980,
1990, and 2000 decennial censuses.
One notable characteristic of this provision is that it did not increase spending for the rural development programs addressed in ARRA, but rather targeted existing funds differently.
Research has suggested that areas for which the poverty rate (the percentage of the population that is below poverty) reaches 20% experience systemic problems that are more acute than in lower-poverty areas. Therefore, policy interventions at the community level (such as applying the 10-20-30 provision to other programs besides those cited in ARRA), and not only at the individual or family level, could continue to be of interest to Congress.
Since ARRA, Congress has applied the 10-20-30 provision for other programs in addition to rural development programs, and may continue to do so, using
more recent estimates of poverty rates. Doing this, however, requires updating the list of counties with persistent
poverty, and that requires making certain decisions about the data that wil be used to compile the list.
Poverty rates are computed using data from household surveys fielded by the U.S. Census Bureau. The list of
counties identified to beas persistently poor may differ by roughly 60 to 100 counties in a particular year, depending on the surveys selected to compile the list and the rounding method used for the poverty rate estimates. Before the mid-1990s, In the past, the decennial census was the only source of county poverty estimates. However, currently, the only data sources that provide poverty estimates for all U.S. counties are across the entire country. After 2000, however, the decennial census is no longer used to collect income data. However, there are two newer data sources that may be used to provide poverty estimates for al U.S. counties: the American Community Survey
the American Community Survey (ACS) and the Small Smal Area Income and Poverty Estimates program (SAIPE). The Census Bureau implemented both the ACS and SAIPE in the mid-1990s. Therefore, to determine whether an area is "persistently"persistently poor in a time span that ends after the year 2000, it must first be decidedpolicymakers and researchers must first decide whether ACS or SAIPE poverty estimates will wil be used for the later part of that time span.
When determining the rounding method and data source to be used to compile a list of persistent poverty counties, the following may be relevant to consider:
- Characteristics of interest: SAIPE is suited for poverty or median income alone; ACS for other topics in addition to poverty and income.
- Which of these surveys is the best data source to use for compiling an updated list of counties with persistent poverty may differ based on the specific area or policy for
which the antipoverty intervention is intended.
When defining persistent poverty counties in order to target funds for programs or services, the following factors
may be relevant:
Characteristics of interest: SAIPE is suited for analysis focused solely on poverty or median
income; ACS for poverty and income and other topics (e.g., housing characteristics, disability, education level, occupation, veteran status).
Geographic areas of interest: SAIPE is recommended for counties and school districts only; ACS
producesmay be used to produce estimates for othersmallsmal geographic areas as wel (such as cities, towns, and census tracts). Reference period of estimate: Both data sources produce annual estimates. However, the SAIPE estimate is based on one prior year of data while ACS estimates draw on data from the past five years. geographic areas as well. - Reference period of estimate: SAIPE for one year; ACS for a five-year span.
- Rounding method for poverty rates:
roundingRounding to 20.0% (one decimal place) yields a shorter list of counties with persistent poverty than rounding to 20% (whole number). -
Special populations: Poverty status is not defined for
all persons: foster children (unrelated individuals under age 15al persons. This includes unrelated individuals under age 15 (e.g., children in foster care), institutionalized persons, and residents of college dormitoriesare excluded; the homeless are not explicitly targeted by household surveys; and areas with Congressional Research Service large numbers of students living off-campus may havehighhigher poverty rates.
Introduction
than might be expected, because poverty is measured using cash income and does not include student loans.
Congressional Research Service
link to page 6 link to page 7 link to page 8 link to page 8 link to page 9 link to page 10 link to page 10 link to page 10 link to page 10 link to page 10 link to page 10 link to page 10 link to page 10 link to page 11 link to page 11 link to page 11 link to page 11 link to page 14 link to page 27 link to page 27 link to page 12 link to page 12 link to page 14 link to page 14 link to page 14 link to page 30 link to page 30 link to page 28 The 10-20-30 Provision: Defining Persistent Poverty Counties
Contents
Introduction ................................................................................................................... 1 Motivation for Targeting Funds to Persistent Poverty Counties............................................... 2 Defining Persistent Poverty Counties ................................................................................. 3
Computing the Poverty Rate for an Area ....................................................................... 3 Data Sources Used in Identifying Persistent Poverty Counties .......................................... 4
Considerations When Identifying and Targeting Persistent Poverty Counties ............................ 5
Selecting the Data Source: Strengths and Limitations of ACS and SAIPE Poverty
Data ...................................................................................................................... 5
Characteristics of Interest: SAIPE for Poverty Alone; ACS for Other Topics in
Addition to Poverty............................................................................................ 5
Geographic Area of Interest: SAIPE for Counties and School Districts Only; ACS
for Other Smal Areas......................................................................................... 5
Reference Period of Estimate: SAIPE for One Year, ACS for a Five-Year Span .............. 5
Other Considerations.................................................................................................. 6
Treatment of Special Populations in the Official Poverty Definition ............................. 6 Persistence Versus Flexibility to Recent Situations .................................................... 6 Effects of Rounding and Data Source Selection on Lists of Counties ............................ 6
Example List of Persistent Poverty Counties ....................................................................... 9
Figures Figure 1. Persistent Poverty Counties Using Two Rounding Methods, Based on 1990
Census, Census 2000, and 2019 Smal Area Income and Poverty Estimates ......................... 22
Tables Table 1. Number of Counties Identified as Persistently Poor, Using Different Datasets and
Rounding Methods ....................................................................................................... 7
Table 2. List of Persistent Poverty Counties, Based on 1990 Census, Census 2000, and
2019 Smal Area Income and Poverty Estimates (SAIPE), Using Poverty Rates of 19.5% or Greater .......................................................................................................... 9
Table A-1. U.S. Census Bureau’s Guidance on Poverty Data Sources by Geographic
Level and Type of Estimate.......................................................................................... 25
Appendixes Appendix. Details on the Data Sources ............................................................................. 23
Congressional Research Service
link to page 31 The 10-20-30 Provision: Defining Persistent Poverty Counties
Contacts Author Information ....................................................................................................... 26
Congressional Research Service
The 10-20-30 Provision: Defining Persistent Poverty Counties
Introduction Antipoverty interventions that provide resources to local communities, based on the characteristics of those communities, have been of interest to Congress. One such policy, dubbed
the "10-20-30 provision,"provision, was implemented in the American Recovery and Reinvestment Act of 2009 (ARRA, P.L. 111-5). Title I, Section 105 of ARRA required the Secretary of Agriculture to allocateal ocate at least 10% of funds provided in that act from three rural development program accounts to persistent poverty counties; that is, to counties that have had poverty rates of 20% or more for
the past 30 years, as measured by the 1980, 1990, and 2000 decennial censuses.1
1
One notable characteristic of this provision is that it did not increase spending for the rural development programs addressed in ARRA, but rather targeted existing funds differently. Given Congress'Congress’s interest both in addressing povertypoverty (economic hardship as measured by comparing
income against a dollar amount that represents a low level of need)2 and being mindful about levels of federal spending, the past four Congresses included 10-20-30 language in multiple appropriations billsbil s, some of which were enacted into law. However, the original language used in ARRA ARRA could not be re-used verbatim, because the decennial census—the data source used by ARRA ARRA to define persistent poverty—the decennial census—stopped collecting income information. As a consequence, the appropriations billsbil s varied slightly in their definitions of "persistent poverty counties" as it was
applied to various programs and departments, sometimes. This variation occurred even within different sections of the same bill bil if the bill bil included language on different programs. In turn, because the definitions of "persistent poverty" differed, so did the lists of counties identified as persistently poor and subject to the 10-20-30 provision. The billsbil s included legislation for rural development, public works and economic development, technological innovation, and brownfields site assessment and
remediation. Most recently, in the 116th116th Congress, much of the language used in these previous billsbil s was included in P.L. 116-6 (Consolidated Appropriations Act, 2019), P.L. 116-93 (Consolidated Appropriations Act, 2020), and P.L. 116-94 (Further Consolidated Appropriations
Act, 2020).2
3
1 While the 1980-2000 period is actually 20 years, local communities have traditionally relied upon the decennial census data for small areas up to 10 years after their publication, hence the reference to “30 years.” However, since the late 1990s newer data sources have become available for small communities at intervals shorter than 10 years, which has implications that will be discussed in this report.
2 For a more thorough discussion of how poverty is defined and measured, see CRS Report R44780, An Introduction to Poverty Measurem ent, by Joseph Dalaker. 3 In the 116th Congress, the Consolidated Appropriations Act, 2019 (P.L. 116-6) included 10-20-30 language in numerous sections: Section 752, in reference to loans and grants for rural housing, business and economic development, and utilities; Section 539, in reference to grants authorized by the Public Works and Economic Development Act of 1965 and grants authorized by Section 27 of the Stevenson -Wydler T echnology Innovation Act of 1980; Division D, T itle I, in reference to the Community Development Financial Institutions (CDFI) Fund Program Account; and Division E, T itle II, in reference to the Comprehensive Environmental Response, Compensation, and Liability Act (CERCLA) of 1980 and its role in authorizing funding for brownfields site assessment and remediation. T hese same programs, with the addition of T ransit Infrastructure Grants, were included in two appropriations acts for FY2020: the Consolidated Appropriations Act, 2020 ( P.L. 116-93; public works grants in Division B, T itle V, Section 533, and CDFI in Division C, T itle I), and the Further Consolidation Appropriations Act, 2020 ( P.L. 116-94; rural programs in Division B, T itle VII, Section 740; CERCLA in Division D, T itle II; and T ransit Infrastructure Grants in Division H, T itle I). Additionally, more than a dozen bills referencing 10 -20-30 or persistent poverty counties had been introduced in the 116th Congress but not enacted. T hese bills covered a wide range of topics, such as rural jobs,
restructuring of rural development loans, hospitals in rural areas, veterans’ job opportunities, internet accessibility, the donation of federal electronic equipment to schools, programs to prevent or eliminate discrimination in h ousing, programs to support victims of trafficking, programs to ameliorate opioid abuse and various other Department of
Congressional Research Service
1
The 10-20-30 Provision: Defining Persistent Poverty Counties
This report discusses how data source selection, and the rounding of poverty estimates, can affect the list of counties identified as persistently poor. After briefly explaining why targeting funds to persistent poverty counties might be of interest, this report explores how "persistent poverty" is defined and measured, and how different interpretations of the definition and different data source selections could yield different lists of counties identified as persistently poor. This report does not compare the 10-20-30 provision'’s advantages and disadvantages against other policy options
for addressing poverty, nor does it examine the range of programs or policy goals for which the
10-20-30 provision might be an appropriate policy tool.
Motivation for Targeting Funds to Persistent Poverty Counties
Counties Research has suggested that areas for which the poverty rate (the percentage of the population that is below poverty) reaches 20% experience systemic problems that are more acute than in lower-poverty areas. The poverty rate of 20% as a critical point has been discussed in academic literature as relevant for examining social characteristics of high-poverty versus low-poverty areas.3
areas.4 For instance, property values in high-poverty areas do not yield as high a return on investment as in low-poverty areas, and that low return provides a financial disincentive for property owners to spend money on maintaining and improving property.45 The ill il effects of high poverty rates have been documented both for urban and rural areas.5 Therefore, policy interventions at the community level, and not only at the individual 6 Depending on the years in which poverty is measured and the data sources used, between 360 and 500 counties have been
identified as persistent poverty counties, out of a total of 3,143 counties or county-equivalent
Justice programs, and a number of regional authorities and commissions.
4 For instance, George Galster of Wayne State University conduct ed a literature review that suggested “that the independent impacts of neighborhood poverty rates in encouraging negative outcomes for individuals like crime, school leaving, and duration of poverty spells appear to be nil unless the neighborhood exceeds a bout 20 percent poverty.” Galster distinguishes the effects of living in a poor neighborhood from the effects of being poor oneself but not necessarily in a poor neighborhood. Cited in George C. Galster, “T he Mechanism(s) of Neighborhood Effects: T heory, Evidence, and Policy Implications,” presented at the Economic and Social Research Council Seminar, “Neighbourhood Effects: T heory & Evidence,” St. Andrews University, Scotland, UK, February 2010.
Additionally, the Census Bureau has published a series of reports examining local areas (census tracts) with poverty rates of 20% or greater. See, for instance, Alemayehu Bishaw, Craig Benson, Emily Shrider, and Brian Glassman, “Changes in Poverty Rates and Poverty Areas Over T ime: 2005 to 2019,” American Community Survey Brief 20-08, December 2020; Alemayehu Bishaw, “Changes in Areas With Concentrated Poverty: 2000 to 2010,” U.S. Census Bureau, American Community Survey Reports ACS-27, June 2014; and Leatha Lamison-White, “Poverty Areas,” U.S. Census Bureau Statist ical Brief, June 1995.
5 T he effects of poverty rates on property values are explored by George C. Galster, Jackie M. Cutsinger, and Ron Malega in “T he Costs of Concentrated Poverty: Neighborhood Property Markets and the Dynamics of Decline,” pp. 93 -113 in N. Retsinas and E. Belsky, eds., Revisiting Rental Housing: Policies, Program s, and Priorities (Washington,
DC: Brookings Institution Press, 2008). They indicate that “the relationship between changes in a neighborhood’s poverty rate and maintenance choices by local residential property owners will be lumpy and non -linear. Substantial variations in poverty rates in the low-moderate range yield no deviations in the owner’s decision to highly maintain the building.... Past some percentage of poverty, however, the owner will switch to an undermaintenance mode whereby net depreciation will occur.” 6 See, for instance, a 2008 report issued jointly by the Federal Reserve System and the Brookings Institution, “The Enduring Challenge of Concentrated Poverty in Am erica: Case Studies from Communities Across the U.S.,” David Erickson et al., eds., 2008. Additional research into concentrated poverty in both rural and urban areas has been undertaken for decades; for example, educational attainment and health disability were discussed in a rural context by Calvin Beale in “Income and Poverty,” chapter 11 in Glenn V. Fuguitt, David L. Brown, and Calvin L. Beale, eds., Rural and Sm all Town Am erica, Russell Sage Foundation, 1988.
Congressional Research Service
2
link to page 6 The 10-20-30 Provision: Defining Persistent Poverty Counties
areas nationwide. Therefore, policy interventions at the community level, and not only at the
individual or family level, have been and may continue to be of interest to Congress.7
Defining Persistent Povertyor family level, have been and may continue to be of interest to Congress.6
Defining "Persistent Poverty" Counties
Counties Persistent poverty counties are counties that have had poverty rates of 20% or greater for at least 30 years. The county poverty rates for 1999 and previous years are measured using decennial census data, and for. For more recent years, either the Small Smal Area Income and Poverty Estimates (SAIPE)
or the American Community Survey (ACS). are used. Both of these Census Bureau data sources were first implemented in the mid-1990s and both provide poverty estimates no longer available from the decennial census.8 The data sources used, and the level of precision of rounding for the poverty rate, affects the list of counties identified as persistent poverty counties, as will be wil be
described below.
Computing the Poverty Rate for an Area
Poverty rates are computed by the Census Bureau for the nation, states, and smallersmal er geographic
areas such as counties.79 The official definition of poverty in the United States is based on the money income of families and unrelated individuals. Income from each family member (if family members are present) is added together and compared against a dollar amount calledcal ed a poverty threshold, which represents a level of economic hardship and varies according to the size and characteristics of the family (ranging from one person to nine persons or more). Families (or
unrelated individuals) whose income is less than their respective poverty threshold are considered
to be in poverty.8
(sometimes also described as below poverty).10
Every person in a family has the same poverty status. Thus, it is possible to compute a poverty
rate based on counts of persons. This is done by (dividing the number of persons below poverty within a county by the county'dividing the number of persons below poverty
7 In the 116th Congress, P.L. 116-6 (Consolidated Appropriations Act, 2019), P.L. 116-93 (Consolidated Appropriations Act, 2020), and P.L. 116-94 (Further Consolidated Appropriations Act, 2020) used the 10 -20-30 provision; see footnote 3 for details. Of the public laws passed by the 115 th Congress, 10-20-30 language was included in P.L. 115-31 (Consolidated Appropriations Act, 2017), P.L. 115-141 (Consolidated Appropriations Act, 2018), and P.L. 115-334 (Agricultural Improvement Act of 2018). Multiple other bills were introduced but not enacted into public law. In the 114th Congress, no bills containing 10-20-30 language were enacted into public law, but 10-20-30 language was included in H.R. 1360 (America’s FOCUS Act of 2015), H.R. 5393 (Commerce, Justice, Science, and Related Agencies Appropriations Act, 2017), H.R. 5054 (Agriculture, Rural Development, Food and Drug Administration, and Related Agencies Appropriations Act, 2017), H.R. 5538 (Department of the Interior, Environment, and Related Agencies Appropriations Act, 2017), and S. 3067 and H.R. 5485 (Financial Services and General Government Appropriations Act, 2017). However, the Consolidated Appropriations Acts for 2017, 2018, and 2019 used language analogous to the bills introduced in the 114th Congress, with some modification. Additionally, in the 113th Congress, H.R. 5571 (T he 10-20-30 Act of 2014) was introduced and referred to committee but not passed.
8 T he decennial census does not collect income information in the 50 states, the District of Columbia, and Puerto Rico, but still asks for income information in American Samoa, the Commonwealth of the Northern Mariana Islands, Guam, and the U.S. Virgin Islands. Neit her ACS nor SAIPE poverty estimates are currently available for these island areas. 9 T here are two definitions of poverty used in the United States: one for statistical purposes, which is used by the Census Bureau and described in Statistical Policy Directive 14 by the Office of Management and Budget; and the other for program administration purposes, which is used by the Department of Health and Human Services and is referred to in the Omnibus Budget Reconciliation Act of 1981. Measuring the poverty rates of counties, which are in turn used in the 10-20-30 plan, is a statistical use of poverty data; thus, the statistical definition of poverty (used by the Census Bureau) applies.
10 For further details about the official definition of poverty, see CRS Report R44780, An Introduction to Poverty Measurem ent, by Joseph Dalaker.
Congressional Research Service
3
link to page 28 The 10-20-30 Provision: Defining Persistent Poverty Counties
within a county by the county’s total population,11s total population,9 and multiplying by 100 to express as a percentage).
the rate as a percentage. Data Sources Used in Identifying Persistent Poverty Counties
Poverty rates are computed using data from household surveys. Currently, the only data sources that provide poverty estimates for all al U.S. counties are the ACS and SAIPE. Before the mid-1990s, the only poverty data available at the county level came from the Decennial Census of Population and Housing, which was onlyis collected once every 10 years, and used to be. In the past, these data were the
the only source of estimates that could determine whether a county had persistently high poverty rates (ARRA referred explicitly to decennial census poverty estimates for that purpose). However, after Census 2000, the decennial census has no longer collected income information in the 50 states, the District of Columbia, and Puerto Rico, and as a result cannot be used to compute poverty estimates.1012 Therefore, to determine whether an area is persistently poor in a time span that ends after 2000, it must first be decided whether ACS or SAIPE poverty estimates will be wil be
used for the later part of that time span.
The ACS and the SAIPE program serve different purposes. The ACS was developed to provide
continuous measurement of a wide range of topics similar to that formerly provided by the decennial census long form, available down to the local community level. ACS data for all al counties are available annually annual y, but are based on responses over the previous five-year time span (e.g., 2013-20172015-2019). The SAIPE program was developed specificallyspecifical y for estimating poverty at the county level for school-age children and for the overall overal population, for use in funding allocations al ocations for the Improving America'’s Schools Act of 1994 (P.L. 103-382). SAIPE data are also available annually
annual y, and reflect one calendar year, not five. However, unlike the ACS, SAIPE does not provide estimates for a wide array of topics. For further details about the data sources for county
poverty estimates, see the Appendix.
the Appendix. 11 Poverty rates are computed using adjusted population totals because there are some individuals whose poverty status is not determined. T hese include unrelated individuals under age 15, such as foster children, who are not asked income questions and who are not related to anyone else in their residence by birth, marriage, or adoption; persons living in military barracks; and persons in institutions such as nursing homes or prisons. Some surveys (such as those described in this report) do not compute poverty status for persons living in college dormitories. T hese persons are excluded from the total population when computing poverty rates. Furthermore, people who have no traditional housing and who do not live in shelters are typically not sampled in household surveys. 12 T he decennial census still collects income information in American Samoa, the Commonwealth of the Northern Mariana Islands, Guam, and the U.S. Virgin Islands. Neither the ACS nor the SAIPE program is conducted for these island areas; decennial census data are the only small-area poverty data available for them. T he 2020 Census questionnaire for these island areas covered the same topics as the ACS; see the Island Areas Censuses Operation Detailed Operational Plan at https://www.census.gov/programs-surveys/decennial-census/2020-census/planning-management/planning-docs/IAC-detailed-op-plan.html. For Puerto Rico, ACS estimates are still produced, but SAIPE estimates stopped being produced after 2003. For details see https://www.census.gov/programs-surveys/saipe/technical-documentation/methodology/puerto-rico.html. Congressional Research Service 4 link to page 28 The 10-20-30 Provision: Defining Persistent Poverty Counties Considerations When Identifying and Targeting Persistent Poverty Counties
Selecting the Data Source: Strengths and Limitations of ACS and SAIPE Poverty Data
Because poverty estimates can be obtained from multiple data sources, the Census Bureau has
provided guidance on the most suitable data source to use for various purposes.11
13 Characteristics of Interest: SAIPE for Poverty Alone; ACS for Other Topics in Addition to Poverty
The Census Bureau recommends using SAIPE poverty estimates when estimates are needed at
the county level, especiallyespecial y for counties with small smal populations, and when additional demographic and economic detail is not needed at that level.1214 When additional detail is required, such as for county-level poverty estimates by race and Hispanic origin, detailed age groups (aside from the elementary and secondary school-age population), housing characteristics, or education
level, the ACS is the data source recommended by the Census Bureau.
Geographic Area of Interest: SAIPE for Counties and School Districts Only; ACS for Other Small Areas
For counties (and school districts) of small smal population size, SAIPE data have an advantage over ACS data in that the SAIPE model uses administrative data to help reduce the uncertainty of the estimates. However, ACS estimates are available for a wider array of geographic levels, such as ZIP code tabulation areas, census tracts (subcounty areas of roughly 1,200 to 8,000 people), cities
and towns, and greater metropolitan areas.
Reference Period of Estimate: SAIPE for One Year, ACS for a Five-Year Span
While the ACS has greater flexibility in the topics measured and the geographic areas provided, it can only provide estimates in five-year ranges for the smallestsmal est geographic areas. Five years of survey responses are needed to obtain a sample large enough to produce meaningful estimates for populations below 65,000 persons. In this sense the SAIPE data, because they are based on a
single year, are more current than the data of the ACS. The distinction has to do with the reference period of the data—both data sources release data on an annual basis; the ACS
estimates for small smal areas are based on the prior five years, not the prior year alone.
13 T his guidance is posted on the Census Bureau’s website at https://www.census.gov/topics/income-poverty/poverty/guidance/data-sources.html, and is reproduced in the Appe ndix. 14 SAIPE county-level estimates are available for the poverty status of the total population, persons under age 18, and related children ages 5 to 17 living in families, and for median household income.
Congressional Research Service
5
The 10-20-30 Provision: Defining Persistent Poverty Counties
Other Considerations
Other Considerations
Treatment of Special Populations in the Official Poverty Definition
Poverty
Regardless of the data source used to measure it, poverty status is not defined for persons in institutions, such as nursing homes or prisons, nor for persons residing in military barracks. These
populations are excluded from totals when computing poverty statistics. Furthermore, the homeless population is not counted explicitly in poverty statistics. The ACS is a household survey, thus homeless individuals who are not in shelters are not counted. SAIPE estimates are partiallypartial y based on Supplemental Nutrition Assistance Program (SNAP) administrative data and tax data, so the part of the homeless population that either filed tax returns or receivedrec eived SNAP
benefits might be reflected in the estimates, but only implicitly.
In the decennial census, ACS, and SAIPE estimates, poverty status also is not defined for persons living living in college dormitories.1315 However, students who live in off-campus housing are included.
Because college students tend to have lower money income (which does not include school loans) than average, counties that have large populations of students living off-campus may exhibit higher poverty rates than one might expect given other economic measures for the area, such as
the unemployment rate.14
16
Given the ways that the special populations above either are or are not reflected in poverty statistics, it may be worthwhile to consider whether counties that have large numbers of people in those populations would receive an equitable allocational ocation of funds. Other economic measures may
be of use, depending on the type of program for which funds are being targeted.
"Persistence"
Persistence Versus Flexibility to Recent Situations
The 10-20-30 provision was developed to identify counties with persistently high poverty rates. Therefore, using that funding approach by itself would not allowal ow flexibility to target counties that have recently experienced economic hardship, such as counties that had a large manufacturing plant close within the past three years. Other interventions besides the 10-20-30 provision may be
more appropriate for counties that have had a recent spike in the poverty rate.
Effects of Rounding and Data Source Selection on Lists of Counties
In ARRA, persistent poverty counties were defined as "“any county that has had 20 percent or more of its population living in poverty over the past 30 years, as measured by the 1980, 1990, and 2000 decennial censuses."15”17 Poverty rates published by the Census Bureau are typically typical y
reported to one decimal place. The numeral used in the ARRA language was the whole number 20. Thus, for any collectioncol ection of poverty data, there are two reasonable approaches to compiling a list of persistent poverty counties: using poverty rates of at least 20.0% in all al three years, or using
15 Details on the poverty universe in the ACS are available at https://www2.census.gov/programs-surveys/acs/tech_docs/subject_definitions/2018_ACSSubjectDefinitions.pdf?#page=107 and for the SAIPE estimates at https://www.census.gov/programs-surveys/saipe/guidance/model-input -data/denominators/poverty.html.
16 For some counties, the percentage-point difference could be large when off-campus students are excluded. Using ACS data for 2009-2011, Whitman County, WA, experienced the largest poverty rate difference among all counties when off-campus students were excluded—its poverty rate fell by 16.5 percentage points. For the United States as a whole, the poverty rate fell from 15.2% to 14.5% when off -campus students were excluded (based on the same dataset). For details, see Alemayehu Bishaw, “Examining the Effect of Off-Campus College Students on Poverty Rates,” Working Paper SEHSD 2013-17, U.S. Census Bureau, May 1, 2013. 17 P.L. 111-5, Section 105.
Congressional Research Service
6
link to page 12 link to page 13 link to page 13 The 10-20-30 Provision: Defining Persistent Poverty Counties
three years, or using poverty rates that round up to the whole number 20% or greater in all al three years (i.e., poverty rates of 19.5% or more in all al three years). The former approach is more restrictive and results in a
shorter list of counties; the latter approach is more inclusive.
Table 1 illustratesil ustrates the number of counties identified as persistent poverty counties using the 1990 and 2000 decennial censuses, and various ACS and SAIPE datasets for the last data point, under both rounding schemes. The rounding method and data source selection can each have large impacts on the number of counties listed. Approximately 25 to 30 more counties appear in SAIPE-based lists compared to ACS-based lists using the same rounding method. Compared to
using 20.0% as the cutoff (rounded to one decimal place), rounding up to 20% from 19.5% adds approximately 50 to 60 counties to the list. Taking both the data source and the rounding method together, the list of persistent poverty counties could vary by roughly 60 to 100 counties in a
given year depending on the method used.
Table 1. Number of Counties Identified as Persistently Poor, Using Different
Using Different Datasets and Rounding Methods
Counties identified as having poverty rates of 20% or more (applying rounding methods as indicated
below) in 1989 (from 1990 Census), 1999 (from Census 2000), and latest year from datasets indicated below.
|
Dataset |
Rounded to One Decimal Place (20.0% or Greater) |
Rounded to Whole Number (19.5% or Greater) |
Difference Between Rounding Methods |
|
ACS, 2007-2011 |
397 |
445 |
48 |
|
ACS, 2008-2012 |
404 |
456 |
52 |
|
ACS, 2009-2013 |
402 |
458 |
56 |
|
ACS, 2010-2014 |
401 |
456 |
55 |
|
ACS, 2011-2015 |
397 |
453 |
56 |
|
ACS, 2012-2016 |
392 |
446 |
54 |
|
386 |
436 |
50 |
|
ACS, 2014-2018 a |
384 |
430 |
46 |
|
Mean difference: 52.13 |
|||
|
SAIPE, 2011 |
433 |
495 |
62 |
|
SAIPE, 2012 |
435 |
491 |
56 |
|
SAIPE, 2013 |
427 |
490 |
63 |
|
SAIPE, 2014 |
427 |
486 |
59 |
|
SAIPE, 2015 |
419 |
476 |
57 |
|
SAIPE, 2016 |
420 |
469 |
49 |
|
SAIPE, 2017 |
411 |
460 |
49 |
|
SAIPE, 2018 |
395 |
443 |
48 |
|
Mean difference: 55.38 |
|||
|
Differences between datasets released in same year |
|||
|
36 |
50 |
|
|
Difference, SAIPE 2012 minus ACS 2008-2012 |
31 |
35 |
|
|
25 |
32 |
|
|
Difference, SAIPE 2014 minus ACS 2010-2014 |
26 |
30 |
|
|
22 |
23 |
|
|
Difference, SAIPE 2016 minus ACS 2012-2016 |
28 |
23 |
|
|
25 |
24 |
|
|
Difference, SAIPE 2018 minus ACS 2014-2018 |
11 |
13 |
|
|
Mean difference: |
25.50 |
28.75 |
Source: Congressional Research Service (CRS) tabulation of data from SAIPE 2018 minus ACS 2014-2018
11
13
Difference, ACS 2015-2019 minus SAIPE 2019
14
11
Mean difference:
24.22
26.78
Source: Congressional Research Service (CRS) tabulation of data from U.S. Census Bureau, 1990 Census, Census 2000, 2012-2018 Small 2019 Smal Area Income and Poverty Estimates, and American Community Survey 5-Year Estimates for 2007-2011, 2008-2012, 2009-2013, 2010-2014, 2011-2015, 2012-2016, 2013-2017, and 2014-2018, and 2015-2019. .
Notes: ACS: American Community Survey. SAIPE: Small Area Smal Area Income and Poverty Estimates. Comparisons between ACS and SAIPE estimates are between datasets released in the same year (both are typicallytypical y released in December in December of the year followingfol owing the reference period). There are 3,143 county-type areas in the United States.
The selection of the data source and rounding method has a large effect on the number of counties identified as being in persistent poverty. The longest list of persistent poverty counties (SAIPE, 19.5% or greater, that is, rounded up to the whole number 20%) minus the shortest list of persistent poverty counties (ACS, 20.0% or greater) yields the maximum difference. Comparing datasets that were released released in the same year, the maximum differences in the lists of counties were:
SAIPE 2011, whole number - ACS, 2007-2011, one decimal = 98 counties
SAIPE 2012, whole number - ACS, 2008-2012, one decimal = 87
SAIPE 2013, whole number - ACS, 2009-2013, one decimal = 88
SAIPE 2014, whole number - ACS, 2010-2014, one decimal = 85
SAIPE 2015, whole number - ACS, 2011-2015, one decimal = 79 = 79
SAIPE 2016, whole number - ACS, 2012-2016, one decimal = 77 = 77
SAIPE 2017, whole number - ACS, 2013-2017, one decimal = 74 = 74
SAIPE 2018, whole number - ACS, 2014-2018, one decimal = 59
= 59 ACS, 2015-2019, whole number - SAIPE 2019, one decimal = 57 The lists of persistent poverty counties vary by about 8178 counties on average (mean: 80.8878.22), depending on which data source is used for the most recent poverty rate estimate, and which rounding method is applied to identify persistent poverty.
a. a. These counts include Rio Arriba County, NM, despite an ACS data collectioncol ection error that occurred in that
county in both 2017 and 2018. The Census Bureau detected the error after the five-year data for 2013-2017 had been released, but before the 2014-2018 data had been released. As a result, the 2014-2018 poverty rate for Rio Arriba County was not published, and the 2013-2017 poverty rate (formerly reported
Congressional Research Service
8
link to page 14 link to page 27 link to page 26 The 10-20-30 Provision: Defining Persistent Poverty Counties
reported as 26.4%) was removed from the Census Bureau website. The 2012-2016 ACS poverty rate for Rio Arriba County was 23.4%, and the 2018 SAIPE poverty rate was 22.0%. Because the ACS poverty rate immediately before the error (2012-2016) and the SAIPE poverty rate were both above 20.0%, Rio Arriba County is included in this table'’s counts of persistent poverty counties. ACS five-year data are likely to be affected by the error for several subsequent years. poverty counties. For details, see https://www.census.gov/programs-surveys/acs/technical-documentation/errata/125.html.
125.html. Example List of Persistent Poverty Counties
The list of persistent poverty counties below (Table 2) is based on data from the 1990 Census,
Census 2000, and the 20182019 SAIPE estimates, and includedincludes the 407 counties with poverty rates of 19.5% or greater (that is, counties with poverty rates that were at least 20% with rounding applied
to the whole number). These same counties are mapped inin Figure 1.
This list of 407 counties is similar but not identical to a list that would be compiled if ACS (2015-2019) data were used with 1990 and 2000 Census data to determine counties with persistent
poverty.
Table 2. List of Persistent Poverty Counties, Based on 1990 Census, Census 2000, and 2018
2019 Small Area Income and Poverty Estimates (SAIPE), Using Poverty Rates of
19.5% or Greater
Poverty Poverty Poverty
FIPS
Congressional
Rate
Rate
Rate
Geographic
District(s)
1989
1999
2018,
Identification
Representing
(1990
(Census
from
Count
Code
State
County
the Countya
Census)
2000)
SAIPE
1
1005
Alabama
Barbour
2
25.2
26.8
27.1
2
1007
Alabama
Bibb
6
21.2
20.6
20.3
3
1011
Alabama
Bul ock
2
36.5
33.5
30
4
1013
Alabama
Butler
2
31.5
24.6
21.6
5
1023
Alabama
Choctaw
7
30.2
24.5
22.6
6
1035
Alabama
Conecuh
2
29.7
26.6
22.2
7
1047
Alabama
Dal as
7
36.2
31.1
26
8
1053
Alabama
Escambia
1
28.1
20.9
20.5
9
1063
Alabama
Greene
7
45.6
34.3
31.7
10
1065
Alabama
Hale
7
35.6
26.9
20.5
11
1085
Alabama
Lowndes
7
38.6
31.4
26.6
12
1087
Alabama
Macon
3
34.5
32.8
29.3
13
1091
Alabama
Marengo
7
30
25.9
24.8
14
1099
Alabama
Monroe
1
22.7
21.3
23.3
15
1105
Alabama
Perry
7
42.6
35.4
33.9
16
1107
Alabama
Pickens
7
28.9
24.9
24.3
17
1109
Alabama
Pike
2
27.2
23.1
21.8
18
1119
Alabama
Sumter
7
39.7
38.7
36.4
19
1131
Alabama
Wilcox
7
45.2
39.9
32.5
20
2050
Alaska
Bethel Census Area
at large
30
20.6
23.5
Congressional Research Service
9
link to page 26 The 10-20-30 Provision: Defining Persistent Poverty Counties
Poverty Poverty Poverty
FIPS
Congressional
Rate
Rate
Rate
Geographic
District(s)
1989
1999
2018,
Identification
Representing
(1990
(Census
from
Count
Code
State
County
the Countya
Census)
2000)
SAIPE
21
2158
Alaska
Kusilvak Census
at large
31
26.2
26.8
Areab
22
2290
Alaska
Yukon-Koyukuk
at large
26
23.8
24.4
Census Area
23
4001
Arizona
Apache
1
47.1
37.8
33.4
24
4009
Arizona
Graham
1
26.7
23
20.1
25
4012
Arizona
La Paz
4
28.2
19.6
22.1
26
4017
Arizona
Navajo
1
34.7
29.5
25.2
27
5011
Arkansas
Bradley
4
24.9
26.3
22.9
28
5017
Arkansas
Chicot
1
40.4
28.6
31
29
5027
Arkansas
Columbia
4
24.4
21.1
21.2
30
5035
Arkansas
Crittenden
1
27.1
25.3
22.4
31
5041
Arkansas
Desha
1
34
28.9
25.4
32
5069
Arkansas
Jefferson
1, 4
23.9
20.5
24.4
33
5073
Arkansas
Lafayette
4
34.7
23.2
25.5
34
5077
Arkansas
Lee
1
47.3
29.9
35.4
35
5079
Arkansas
Lincoln
1
26.2
19.5
27.1
36
5093
Arkansas
Mississippi
1
26.2
23
23
37
5095
Arkansas
Monroe
1
35.9
27.5
25.5
38
5099
Arkansas
Nevada
4
20.3
22.8
24.1
39
5107
Arkansas
Phil ips
1
43
32.7
33.3
40
5111
Arkansas
Poinsett
1
25.6
21.2
23.1
41
5123
Arkansas
St. Francis
1
36.6
27.5
32
42
5129
Arkansas
Searcy
1, 3
29.9
23.8
22.4
43
5147
Arkansas
Woodruff
1
34.5
27
27.1
44
6019
California
Fresno
4, 16, 21, 22
21.4
22.9
20.5
45
6025
California
Imperial
51
23.8
22.6
22
46
8003
Colorado
Alamosa
3
24.8
21.3
19.6
47
8011
Colorado
Bent
4
20.4
19.5
34.4
48
8021
Colorado
Conejos
3
33.9
23
19.9
49
8023
Colorado
Costil a
3
34.6
26.8
24.6
50
8109
Colorado
Saguache
3
30.6
22.6
25.4
51
12039
Florida
Gadsden
5
28
19.9
19.7
52
12047
Florida
Hamilton
5
27.8
26
32.5
53
12049
Florida
Hardee
17
22.8
24.6
22.1
Congressional Research Service
10
link to page 26 The 10-20-30 Provision: Defining Persistent Poverty Counties
Poverty Poverty Poverty
FIPS
Congressional
Rate
Rate
Rate
Geographic
District(s)
1989
1999
2018,
Identification
Representing
(1990
(Census
from
Count
Code
State
County
the Countya
Census)
2000)
SAIPE
54
12079
Florida
Madison
5
25.9
23.1
22.7
55
12107
Florida
Putnam
3
20
20.9
22.4
56
13003
Georgia
Atkinson
8
26
23
23.2
57
13007
Georgia
Baker
2
24.8
23.4
24.8
58
13017
Georgia
Ben Hil
8
22
22.3
22.8
59
13027
Georgia
Brooks
8
25.9
23.4
21.9
60
13031
Georgia
Bul och
12
27.5
24.5
21.9
61
13033
Georgia
Burke
12
30.3
28.7
23.6
62
13037
Georgia
Calhoun
2
31.8
26.5
35.9
63
13043
Georgia
Candler
12
24.1
26.1
23.1
64
13059
Georgia
Clarke
9, 10
27
28.3
25.7
65
13061
Georgia
Clay
2
35.7
31.3
28.8
66
13065
Georgia
Clinch
1
26.4
23.4
22
67
13071
Georgia
Colquitt
8
22.8
19.8
21.9
68
13075
Georgia
Cook
8
22.4
20.7
21.4
69
13081
Georgia
Crisp
2
29
29.3
26.7
70
13087
Georgia
Decatur
2
23.3
22.7
23.4
71
13093
Georgia
Dooly
2
32.9
22.1
28.2
72
13095
Georgia
Dougherty
2
24.4
24.8
27.6
73
13099
Georgia
Early
2
31.4
25.7
27.3
74
13107
Georgia
Emanuel
12
25.7
27.4
20.9
75
13109
Georgia
Evans
12
25.4
27
24.1
76
13131
Georgia
Grady
2
22.3
21.3
21.7
77
13141
Georgia
Hancock
10
30.1
29.4
31.2
78
13163
Georgia
Jefferson
10
31.3
23
25.1
79
13165
Georgia
Jenkins
12
27.8
28.4
29
80
13167
Georgia
Johnson
10
22.2
22.6
24.2
81
13193
Georgia
Macon
2
29.2
25.8
29.4
82
13197
Georgia
Marion
2
28.2
22.4
21.1
83
13201
Georgia
Mil er
2
22.1
21.2
21.3
84
13205
Georgia
Mitchel
2
28.7
26.4
30.7
85
13225
Georgia
Peach
2
24
20.2
19.8
86
13239
Georgia
Quitman
2
33
21.9
22.8
87
13243
Georgia
Randolph
2
35.9
27.7
25.3
88
13251
Georgia
Screven
12
22.9
20.1
24.1
Congressional Research Service
11
link to page 26 The 10-20-30 Provision: Defining Persistent Poverty Counties
Poverty Poverty Poverty
FIPS
Congressional
Rate
Rate
Rate
Geographic
District(s)
1989
1999
2018,
Identification
Representing
(1990
(Census
from
Count
Code
State
County
the Countya
Census)
2000)
SAIPE
89
13253
Georgia
Seminole
2
29.1
23.2
22.6
90
13259
Georgia
Stewart
2
31.4
22.2
34.7
91
13261
Georgia
Sumter
2
24.8
21.4
26.7
92
13263
Georgia
Talbot
2
24.9
24.2
19.6
93
13265
Georgia
Taliaferro
10
31.9
23.4
22.5
94
13267
Georgia
Tattnal
12
21.9
23.9
26.5
95
13269
Georgia
Taylor
2
29.5
26
22.9
96
13271
Georgia
Telfair
8
27.3
21.2
27.7
97
13273
Georgia
Terrel
2
29.1
28.6
28.2
98
13277
Georgia
Tift
8
22.9
19.9
21.5
99
13283
Georgia
Treutlen
12
27.1
26.3
31.6
100
13287
Georgia
Turner
8
31.3
26.7
28
101
13299
Georgia
Ware
1
21.1
20.5
26.3
102
13301
Georgia
Warren
10
32.6
27
26.5
103
13303
Georgia
Washington
10
21.6
22.9
21.4
104
13309
Georgia
Wheeler
12
30.3
25.3
34.2
105
13315
Georgia
Wilcox
8
28.6
21
29.4
106
16065
Idaho
Madison
2
28.6
30.5
27.4
107
17003
Il inois
Alexander
12
32.2
26.1
24
108
17077
Il inois
Jackson
12
28.4
25.2
25.4
109
17153
Il inois
Pulaski
12
30.2
24.7
22
110
20161
Kansas
Riley
1
21.2
20.6
20.9
111
21001
Kentucky
Adair
1
25.1
24
21.4
112
21013
Kentucky
Bel
5
36.2
31.1
30.3
113
21025
Kentucky
Breathitt
5
39.5
33.2
29.2
114
21043
Kentucky
Carter
5
26.8
22.3
20
115
21045
Kentucky
Casey
1
29.4
25.5
25.2
116
21051
Kentucky
Clay
5
40.2
39.7
32.6
117
21053
Kentucky
Clinton
1
38.1
25.8
23.4
118
21057
Kentucky
Cumberland
1
31.6
23.8
23
119
21063
Kentucky
El iott
5
38
25.9
27.7
120
21065
Kentucky
Estil
6
29
26.4
22.7
121
21071
Kentucky
Floyd
5
31.2
30.3
27.4
122
21075
Kentucky
Fulton
1
30.3
23.1
25.6
123
21095
Kentucky
Harlan
5
33.1
32.5
31.1
Congressional Research Service
12
link to page 26 The 10-20-30 Provision: Defining Persistent Poverty Counties
Poverty Poverty Poverty
FIPS
Congressional
Rate
Rate
Rate
Geographic
District(s)
1989
1999
2018,
Identification
Representing
(1990
(Census
from
Count
Code
State
County
the Countya
Census)
2000)
SAIPE
124
21099
Kentucky
Hart
2
27.1
22.4
20.1
125
21109
Kentucky
Jackson
5
38.2
30.2
27.8
126
21115
Kentucky
Johnson
5
28.7
26.6
25.8
127
21119
Kentucky
Knott
5
40.4
31.1
30.5
128
21121
Kentucky
Knox
5
38.9
34.8
31.5
129
21125
Kentucky
Laurel
5
24.8
21.3
21.4
130
21127
Kentucky
Lawrence
5
36
30.7
23.4
131
21129
Kentucky
Lee
5
37.4
30.4
34.9
132
21131
Kentucky
Leslie
5
35.6
32.7
32.3
133
21133
Kentucky
Letcher
5
31.8
27.1
28.9
134
21135
Kentucky
Lewis
4
30.7
28.5
23.2
135
21137
Kentucky
Lincoln
5
27.2
21.1
19.7
136
21147
Kentucky
McCreary
5
45.5
32.2
34.5
137
21153
Kentucky
Magoffin
5
42.5
36.6
29.4
138
21159
Kentucky
Martin
5
35.4
37
34.4
139
21165
Kentucky
Menifee
6
35
29.6
26.1
140
21169
Kentucky
Metcalfe
1
27.9
23.6
22.6
141
21171
Kentucky
Monroe
1
26.9
23.4
21.7
142
21175
Kentucky
Morgan
5
38.8
27.2
26.5
143
21189
Kentucky
Owsley
5
52.1
45.4
35.5
144
21193
Kentucky
Perry
5
32.1
29.1
24.2
145
21195
Kentucky
Pike
5
25.4
23.4
24
146
21197
Kentucky
Powel
6
26.2
23.5
21.5
147
21201
Kentucky
Robertson
6
24.8
22.2
22
148
21203
Kentucky
Rockcastle
5
30.7
23.1
21
149
21205
Kentucky
Rowan
5
28.9
21.3
23.3
150
21207
Kentucky
Russel
1
25.6
24.3
22.6
151
21231
Kentucky
Wayne
5
37.3
29.4
23.8
152
21235
Kentucky
Whitley
5
33
26.4
22.6
153
21237
Kentucky
Wolfe
6
44.3
35.9
30.1
154
22001
Louisiana
Acadia Parish
3
30.5
24.5
20.3
155
22003
Louisiana
Al en Parish
4
29.9
19.9
21.6
156
22009
Louisiana
Avoyel es Parish
5
37.1
25.9
24.4
157
22013
Louisiana
Bienvil e Parish
4
31.2
26.1
24.4
158
22017
Louisiana
Caddo Parish
4
24
21.1
24.1
Congressional Research Service
13
link to page 26 The 10-20-30 Provision: Defining Persistent Poverty Counties
Poverty Poverty Poverty
FIPS
Congressional
Rate
Rate
Rate
Geographic
District(s)
1989
1999
2018,
Identification
Representing
(1990
(Census
from
Count
Code
State
County
the Countya
Census)
2000)
SAIPE
159
22021
Louisiana
Caldwel Parish
5
28.8
21.2
19.5
160
22025
Louisiana
Catahoula Parish
5
36.8
28.1
26.4
161
22027
Louisiana
Claiborne Parish
4
32
26.5
32.5
162
22029
Louisiana
Concordia Parish
5
30.6
29.1
27.5
163
22035
Louisiana
East Carrol Parish
5
56.8
40.5
38.4
164
22039
Louisiana
Evangeline Parish
4
35.1
32.2
28.6
165
22041
Louisiana
Franklin Parish
5
34.5
28.4
25.8
166
22045
Louisiana
Iberia Parish
3
25.8
23.6
21.9
167
22061
Louisiana
Lincoln Parish
5
26.6
26.5
29.5
168
22065
Louisiana
Madison Parish
5
44.6
36.7
41.1
169
22067
Louisiana
Morehouse Parish
5
31
26.8
31
170
22069
Louisiana
Natchitoches Parish
4
33.9
26.5
19.6
171
22071
Louisiana
Orleans Parish
1, 2
31.6
27.9
23.5
172
22073
Louisiana
Ouachita Parish
5
24.7
20.7
23.9
173
22077
Louisiana
Pointe Coupee Parish 6
30.3
23.1
20
174
22081
Louisiana
Red River Parish
4
35.1
29.9
23.9
175
22083
Louisiana
Richland Parish
5
33.2
27.9
25.1
176
22091
Louisiana
St. Helena Parish
5, 6
34.4
26.8
19.6
177
22097
Louisiana
St. Landry Parish
3, 4, 5
36.3
29.3
22.6
178
22101
Louisiana
St. Mary Parish
3
27
23.6
23.8
179
22105
Louisiana
Tangipahoa Parish
1, 5
31.5
22.7
21.7
180
22107
Louisiana
Tensas Parish
5
46.3
36.3
28.9
181
22117
Louisiana
Washington Parish
5
31.6
24.7
24.9
182
22119
Louisiana
Webster Parish
4
25.1
20.2
29.6
183
22123
Louisiana
West Carrol Parish
5
27.4
23.4
21
184
22125
Louisiana
West Feliciana Parish 5
33.8
19.9
22.1
185
22127
Louisiana
Winn Parish
5
27.5
21.5
23.4
186
24510
Maryland
Baltimore city
2, 3, 7
21.9
22.9
20.4
187
26073
Michigan
Isabel a
4
24.9
20.4
22.9
188
28001
Mississippi
Adams
3
30.5
25.9
27.9
189
28005
Mississippi
Amite
3
30.9
22.6
20.9
190
28007
Mississippi
Attala
2
30.2
21.8
24.1
191
28009
Mississippi
Benton
1
29.7
23.2
20.7
192
28011
Mississippi
Bolivar
2
42.9
33.3
36.6
193
28017
Mississippi
Chickasaw
1
21.3
20
22.7
Congressional Research Service
14
link to page 26 The 10-20-30 Provision: Defining Persistent Poverty Counties
Poverty Poverty Poverty
FIPS
Congressional
Rate
Rate
Rate
Geographic
District(s)
1989
1999
2018,
Identification
Representing
(1990
(Census
from
Count
Code
State
County
the Countya
Census)
2000)
SAIPE
194
28019
Mississippi
Choctaw
1
25
24.7
20.9
195
28021
Mississippi
Claiborne
2
43.6
32.4
37.5
196
28023
Mississippi
Clarke
3, 4
23.4
23
23.2
197
28025
Mississippi
Clay
1
25.9
23.5
29.7
198
28027
Mississippi
Coahoma
2
45.5
35.9
38.2
199
28029
Mississippi
Copiah
2
32
25.1
22.1
200
28031
Mississippi
Covington
3
31.2
23.5
21.3
201
28035
Mississippi
Forrest
4
27.5
22.5
23.3
202
28037
Mississippi
Franklin
3
33.3
24.1
19.6
203
28041
Mississippi
Greene
4
26.8
19.6
21.8
204
28043
Mississippi
Grenada
2
22.3
20.9
20.3
205
28049
Mississippi
Hinds
2, 3
21.2
19.9
20.1
206
28051
Mississippi
Holmes
2
53.2
41.1
33.8
207
28053
Mississippi
Humphreys
2
45.9
38.2
37.1
208
28055
Mississippi
Issaquena
2
49.3
33.2
35.8
209
28061
Mississippi
Jasper
3
30.7
22.7
20.5
210
28063
Mississippi
Jefferson
2
46.9
36
28.9
211
28065
Mississippi
Jefferson Davis
3
33.3
28.2
24.3
212
28067
Mississippi
Jones
4
22.7
19.8
23.8
213
28069
Mississippi
Kemper
3
35.1
26
28
214
28075
Mississippi
Lauderdale
3
22.8
20.8
21.5
215
28077
Mississippi
Lawrence
3
27.9
19.6
19.7
216
28079
Mississippi
Leake
2
29.6
23.3
23.8
217
28083
Mississippi
Leflore
2
38.9
34.8
35.7
218
28091
Mississippi
Marion
4
29.6
24.8
23.8
219
28093
Mississippi
Marshal
1
30
21.9
20.3
220
28097
Mississippi
Montgomery
2
34
24.3
23.7
221
28099
Mississippi
Neshoba
3
26.6
21
21.7
222
28101
Mississippi
Newton
3
20.9
19.9
20.3
223
28103
Mississippi
Noxubee
3
41.4
32.8
29.2
224
28105
Mississippi
Oktibbeha
1, 3
30.1
28.2
31.1
225
28107
Mississippi
Panola
2
33.8
25.3
22.8
226
28111
Mississippi
Perry
4
29.1
22
19.9
227
28113
Mississippi
Pike
3
32.9
25.3
26.2
228
28119
Mississippi
Quitman
2
41.6
33.1
35
Congressional Research Service
15
link to page 26 The 10-20-30 Provision: Defining Persistent Poverty Counties
Poverty Poverty Poverty
FIPS
Congressional
Rate
Rate
Rate
Geographic
District(s)
1989
1999
2018,
Identification
Representing
(1990
(Census
from
Count
Code
State
County
the Countya
Census)
2000)
SAIPE
229
28123
Mississippi
Scott
3
27.4
20.7
19.7
230
28125
Mississippi
Sharkey
2
47.5
38.3
33.4
231
28133
Mississippi
Sunflower
2
41.8
30
34
232
28135
Mississippi
Tal ahatchie
2
41.9
32.2
37.9
233
28143
Mississippi
Tunica
2
56.8
33.1
28.1
234
28147
Mississippi
Walthal
3
35.9
27.8
21.7
235
28151
Mississippi
Washington
2
33.8
29.2
33.7
236
28153
Mississippi
Wayne
4
29.5
25.4
22.2
237
28157
Mississippi
Wilkinson
3
42.2
37.7
31.2
238
28159
Mississippi
Winston
1
26.6
23.7
25.4
239
28161
Mississippi
Yalobusha
2
26.4
21.8
24.4
240
28163
Mississippi
Yazoo
2
39.2
31.9
36.4
241
29035
Missouri
Carter
8
27.6
25.2
19.8
242
29069
Missouri
Dunklin
8
29.9
24.5
26.7
243
29133
Missouri
Mississippi
8
29.7
23.7
27.7
244
29143
Missouri
New Madrid
8
26.9
22.1
22.5
245
29149
Missouri
Oregon
8
27.4
22
20.6
246
29153
Missouri
Ozark
8
22.1
21.6
22.7
247
29155
Missouri
Pemiscot
8
35.8
30.4
26.9
248
29179
Missouri
Reynolds
8
24.2
20.1
21.7
249
29181
Missouri
Ripley
8
31.5
22
19.7
250
29203
Missouri
Shannon
8
24.1
26.9
22.6
251
29215
Missouri
Texas
8
22.9
21.4
21
252
29221
Missouri
Washington
8
27.2
20.8
22.4
253
29223
Missouri
Wayne
8
29
21.9
20.6
254
29229
Missouri
Wright
8
25.3
21.7
19.6
255
29510
Missouri
St. Louis city
1
24.6
24.6
20.4
256
30003
Montana
Big Horn
at large
35.3
29.2
26.1
257
30005
Montana
Blaine
at large
27.7
28.1
21.3
258
30035
Montana
Glacier
at large
35.7
27.3
25.7
259
30037
Montana
Golden Val ey
at large
27.5
25.8
19.7
260
30085
Montana
Roosevelt
at large
27.7
32.4
24.3
261
31173
Nebraska
Thurston
1
30.9
25.6
24.9
262
35003
New Mexico
Catron
2
25.6
24.5
20.6
263
35006
New Mexico
Cibola
2
33.6
24.8
25.5
Congressional Research Service
16
link to page 26 The 10-20-30 Provision: Defining Persistent Poverty Counties
Poverty Poverty Poverty
FIPS
Congressional
Rate
Rate
Rate
Geographic
District(s)
1989
1999
2018,
Identification
Representing
(1990
(Census
from
Count
Code
State
County
the Countya
Census)
2000)
SAIPE
264
35013
New Mexico
Doña Ana
2
26.5
25.4
23.8
265
35019
New Mexico
Guadalupe
2
38.5
21.6
23.5
266
35023
New Mexico
Hidalgo
2
20.7
27.3
22.9
267
35029
New Mexico
Luna
2
31.5
32.9
23.8
268
35031
New Mexico
McKinley
2, 3
43.5
36.1
30.1
269
35033
New Mexico
Mora
3
36.2
25.4
21.2
270
35037
New Mexico
Quay
3
25.1
20.9
21.7
271
35039
New Mexico
Rio Arriba
3
27.5
20.3
22.2
272
35045
New Mexico
San Juan
3
28.3
21.5
19.9
273
35047
New Mexico
San Miguel
3
30.2
24.4
23.8
274
35051
New Mexico
Sierra
2
19.6
20.9
27.6
275
35053
New Mexico
Socorro
2
29.9
31.7
26
276
36005
New York
Bronx
13, 14, 15, 16
28.7
30.7
26.2
277
37015
North Carolina
Bertie
1
25.9
23.5
24.2
278
37017
North Carolina
Bladen
7, 9
21.9
21
21.2
279
37047
North Carolina
Columbus
7
24
22.7
22.3
280
37065
North Carolina
Edgecombe
1
20.9
19.6
21
281
37083
North Carolina
Halifax
1
25.6
23.9
23.8
282
37117
North Carolina
Martin
1
22.3
20.2
20.6
283
37131
North Carolina
Northampton
1
23.6
21.3
21.6
284
37155
North Carolina
Robeson
9
24.1
22.8
31.5
285
37177
North Carolina
Tyrrel
3
25
23.3
25.4
286
37187
North Carolina
Washington
1
20.4
21.8
21.3
287
38005
North Dakota
Benson
at large
31.7
29.1
23.3
288
38079
North Dakota
Rolette
at large
40.7
31
25.9
289
38085
North Dakota
Sioux
at large
47.4
39.2
32.1
290
39009
Ohio
Athens
6, 15
28.7
27.4
26.6
291
40001
Oklahoma
Adair
2
26.7
23.2
23.6
292
40015
Oklahoma
Caddo
3
27.8
21.7
20.6
293
40021
Oklahoma
Cherokee
2
28.8
22.9
21.4
294
40023
Oklahoma
Choctaw
2
32.7
24.3
22.5
295
40055
Oklahoma
Greer
3
23.4
19.6
24.1
296
40057
Oklahoma
Harmon
3
34.2
29.7
23.7
297
40061
Oklahoma
Haskel
2
27.1
20.5
20.2
298
40063
Oklahoma
Hughes
2
26.9
21.9
21.4
Congressional Research Service
17
link to page 26 The 10-20-30 Provision: Defining Persistent Poverty Counties
Poverty Poverty Poverty
FIPS
Congressional
Rate
Rate
Rate
Geographic
District(s)
1989
1999
2018,
Identification
Representing
(1990
(Census
from
Count
Code
State
County
the Countya
Census)
2000)
SAIPE
299
40069
Oklahoma
Johnston
2
28.5
22
21
300
40089
Oklahoma
McCurtain
2
30.2
24.7
21.9
301
40107
Oklahoma
Okfuskee
2
29.4
23
27.4
302
40119
Oklahoma
Payne
3
21.7
20.3
23
303
40127
Oklahoma
Pushmataha
2
30.2
23.2
23.9
304
40133
Oklahoma
Seminole
5
24
20.8
22
305
40135
Oklahoma
Sequoyah
2
24.7
19.8
21.6
306
40141
Oklahoma
Til man
4
22.9
21.9
20.4
307
42101
Pennsylvania
Philadelphia
2, 3, 5
20.3
22.9
23
308
45005
South Carolina
Al endale
6
35.8
34.5
30.2
309
45009
South Carolina
Bamberg
6
28.2
27.8
24.2
310
45011
South Carolina
Barnwel
2
21.8
20.9
24.9
311
45027
South Carolina
Clarendon
6
29
23.1
25.1
312
45029
South Carolina
Col eton
1, 6
23.4
21.1
21
313
45031
South Carolina
Darlington
7
19.9
20.3
19.6
314
45033
South Carolina
Dil on
7
28.1
24.2
26.8
315
45049
South Carolina
Hampton
6
27.7
21.8
23.2
316
45061
South Carolina
Lee
5
29.6
21.8
25.4
317
45067
South Carolina
Marion
7
28.6
23.2
24.9
318
45069
South Carolina
Marlboro
7
26.6
21.7
28.9
319
45075
South Carolina
Orangeburg
2, 6
24.9
21.4
26.3
320
45089
South Carolina
Wil iamsburg
6
28.7
27.9
27.8
321
46007
South Dakota
Bennett
at large
37.6
39.2
31.6
322
46017
South Dakota
Buffalo
at large
45.1
56.9
39.8
323
46023
South Dakota
Charles Mix
at large
31.4
26.9
21.2
324
46031
South Dakota
Corson
at large
42.5
41
40.3
325
46041
South Dakota
Dewey
at large
44.4
33.6
27.6
326
46071
South Dakota
Jackson
at large
38.8
36.5
29.9
327
46085
South Dakota
Lyman
at large
24.7
24.3
21.1
328
46089
South Dakota
McPherson
at large
21.5
22.6
19.5
329
46095
South Dakota
Mel ette
at large
41.3
35.8
33.3
330
46102
South Dakota
Oglala Lakotac
at large
63.1
52.3
40.1
331
46109
South Dakota
Roberts
at large
26.4
22.1
19.6
332
46121
South Dakota
Todd
at large
50.2
48.3
43.4
333
46137
South Dakota
Ziebach
at large
51.1
49.9
47.7
Congressional Research Service
18
link to page 26 The 10-20-30 Provision: Defining Persistent Poverty Counties
Poverty Poverty Poverty
FIPS
Congressional
Rate
Rate
Rate
Geographic
District(s)
1989
1999
2018,
Identification
Representing
(1990
(Census
from
Count
Code
State
County
the Countya
Census)
2000)
SAIPE
334
47013
Tennessee
Campbel
2, 3
26.8
22.8
21.9
335
47025
Tennessee
Claiborne
2
25.7
22.6
19.7
336
47029
Tennessee
Cocke
1
25.3
22.5
22.8
337
47049
Tennessee
Fentress
6
32.3
23.1
20.9
338
47061
Tennessee
Grundy
4
23.9
25.8
21.4
339
47067
Tennessee
Hancock
1
40
29.4
26.4
340
47075
Tennessee
Haywood
8
27.5
19.5
20.7
341
47091
Tennessee
Johnson
1
28.5
22.6
25.2
342
47095
Tennessee
Lake
8
27.5
23.6
35.5
343
47151
Tennessee
Scott
3
27.8
20.2
22
344
48025
Texas
Bee
34
27.4
24
24
345
48041
Texas
Brazos
17
26.7
26.9
20
346
48047
Texas
Brooks
15
36.8
40.2
29.6
347
48061
Texas
Cameron
34
39.7
33.1
25.5
348
48079
Texas
Cochran
19
28.3
27
19.5
349
48107
Texas
Crosby
19
29.5
28.1
22.1
350
48109
Texas
Culberson
23
29.8
25.1
19.7
351
48115
Texas
Dawson
11
30.5
19.7
20.6
352
48127
Texas
Dimmit
23
48.9
33.2
25.3
353
48131
Texas
Duval
15
39
27.2
23.9
354
48137
Texas
Edwards
23
41.7
31.6
20.7
355
48145
Texas
Fal s
17
27.5
22.6
21.6
356
48163
Texas
Frio
23
39.1
29
27.7
357
48169
Texas
Garza
19
23.1
22.3
24.2
358
48191
Texas
Hal
13
29.1
26.3
25.4
359
48207
Texas
Haskel
19
20.8
22.8
20.7
360
48215
Texas
Hidalgo
15, 28, 34
41.9
35.9
26.9
361
48225
Texas
Houston
8
25.6
21
20.9
362
48229
Texas
Hudspeth
23
38.9
35.8
28
363
48247
Texas
Jim Hogg
15
35.3
25.9
22.8
364
48249
Texas
Jim Wel s
34
30.3
24.1
21
365
48255
Texas
Karnes
15
36.5
21.9
21
366
48273
Texas
Kleberg
34
27.4
26.7
23.3
367
48283
Texas
La Sal e
23, 28
37
29.8
26.6
368
48315
Texas
Marion
4
60.6
22.4
21.4
Congressional Research Service
19
link to page 26 The 10-20-30 Provision: Defining Persistent Poverty Counties
Poverty Poverty Poverty
FIPS
Congressional
Rate
Rate
Rate
Geographic
District(s)
1989
1999
2018,
Identification
Representing
(1990
(Census
from
Count
Code
State
County
the Countya
Census)
2000)
SAIPE
369
48323
Texas
Maverick
23
50.4
34.8
26.9
370
48327
Texas
Menard
11
31.1
25.8
20.7
371
48347
Texas
Nacogdoches
1
25.2
23.3
20.9
372
48389
Texas
Reeves
23
28.8
28.9
22.1
373
48395
Texas
Robertson
17
28.4
20.6
20.7
374
48405
Texas
San Augustine
1
29.7
21.2
22.5
375
48427
Texas
Starr
28
60
50.9
32.5
376
48445
Texas
Terry
19
25.5
23.3
21.6
377
48463
Texas
Uvalde
23
31.1
24.3
19.8
378
48465
Texas
Val Verde
23
36.4
26.1
20.8
379
48479
Texas
Webb
28
38.2
31.2
20.9
380
48489
Texas
Wil acy
34
44.5
33.2
30.5
381
48505
Texas
Zapata
28
41
35.8
30.1
382
48507
Texas
Zavala
23
50.4
41.8
29.6
383
49037
Utah
San Juan
3
36.4
31.4
21.9
384
51027
Virginia
Buchanan
9
21.9
23.2
21.7
385
51051
Virginia
Dickenson
9
25.9
21.3
24.2
386
51105
Virginia
Lee
9
28.7
23.9
27.1
387
51121
Virginia
Montgomery
9
22.1
23.2
20.5
388
51195
Virginia
Wise
9
21.6
20
20.4
389
51540
Virginia
Charlottesvil e city
5
23.7
25.9
22.1
390
51660
Virginia
Harrisonburg city
6
21.5
30.1
24.9
391
51730
Virginia
Petersburg city
4
20.3
19.6
21.6
392
51750
Virginia
Radford city
9
32.2
31.4
30.5
393
53075
Washington
Whitman
5
24.2
25.6
26.3
394
54013
West Virginia
Calhoun
2
32
25.1
21.6
395
54015
West Virginia
Clay
2
39.2
27.5
22.5
396
54019
West Virginia
Fayette
3
24.4
21.7
20.6
397
54021
West Virginia
Gilmer
1
33.5
25.9
25.5
398
54041
West Virginia
Lewis
2
23.7
19.9
19.5
399
54043
West Virginia
Lincoln
3
33.8
27.9
19.7
400
54045
West Virginia
Logan
3
27.7
24.1
21.9
401
54047
West Virginia
McDowel
3
37.7
37.7
33.8
402
54059
West Virginia
Mingo
3
30.9
29.7
27.3
403
54089
West Virginia
Summers
3
24.5
24.4
23.5
Congressional Research Service
20
link to page 26 The 10-20-30 Provision: Defining Persistent Poverty Counties
Poverty Poverty Poverty
FIPS
Congressional
Rate
Rate
Rate
Geographic
District(s)
1989
1999
2018,
Identification
Representing
(1990
(Census
from
Count
Code
State
County
the Countya
Census)
2000)
SAIPE
404
54099
West Virginia
Wayne
3
21.8
19.6
19.6
405
54101
West Virginia
Webster
3
34.8
31.8
21.8
406
54109
West Virginia
Wyoming
3
27.9
25.1
22.9
407
55078
Wisconsin
Menominee
8
48.7
28.8
25.3
Source: Congressional Research Service (CRS) tabulation of data from U.S. Census Bureau , 1990 Census, Census 2000, 2019 Smal Area Income and Poverty Estimates, and Nation-Based Relationship File for Congressional Districts and Counties (116th Congress). Notes: FIPS: Federal Information Processing Standard. a. Numbers are ordinal, referring 19.5% or Greater
|
Count |
FIPS Geographic Identification Code |
State |
County |
|
Poverty Rate 1989 (1990 Census) |
Poverty Rate 1999 (Census 2000) |
Poverty Rate 2018, from SAIPE |
|
1 |
01005 |
Alabama |
Barbour |
2 |
25.2 |
26.8 |
30.9 |
|
2 |
01007 |
Alabama |
Bibb |
6 |
21.2 |
20.6 |
21.8 |
|
3 |
01011 |
Alabama |
Bullock |
2 |
36.5 |
33.5 |
42.5 |
|
4 |
01013 |
Alabama |
Butler |
2 |
31.5 |
24.6 |
24.5 |
|
5 |
01023 |
Alabama |
Choctaw |
7 |
30.2 |
24.5 |
22.1 |
|
6 |
01025 |
Alabama |
Clarke |
1, 7 |
25.9 |
22.6 |
22.8 |
|
7 |
01035 |
Alabama |
Conecuh |
2 |
29.7 |
26.6 |
24.4 |
|
8 |
01041 |
Alabama |
Crenshaw |
2 |
24.3 |
22.1 |
19.5 |
|
9 |
01047 |
Alabama |
Dallas |
7 |
36.2 |
31.1 |
31.4 |
|
10 |
01053 |
Alabama |
Escambia |
1 |
28.1 |
20.9 |
23.6 |
|
11 |
01061 |
Alabama |
Geneva |
2 |
19.5 |
19.6 |
21.3 |
|
12 |
01063 |
Alabama |
Greene |
7 |
45.6 |
34.3 |
30.1 |
|
13 |
01065 |
Alabama |
Hale |
7 |
35.6 |
26.9 |
25.6 |
|
14 |
01085 |
Alabama |
Lowndes |
7 |
38.6 |
31.4 |
25.1 |
|
15 |
01087 |
Alabama |
Macon |
3 |
34.5 |
32.8 |
30.2 |
|
16 |
01091 |
Alabama |
Marengo |
7 |
30.0 |
25.9 |
24.0 |
|
17 |
01099 |
Alabama |
Monroe |
1 |
22.7 |
21.3 |
21.9 |
|
18 |
01105 |
Alabama |
Perry |
7 |
42.6 |
35.4 |
35.3 |
|
19 |
01107 |
Alabama |
Pickens |
7 |
28.9 |
24.9 |
23.1 |
|
20 |
01109 |
Alabama |
Pike |
2 |
27.2 |
23.1 |
23.6 |
|
21 |
01113 |
Alabama |
Russell |
3 |
20.4 |
19.9 |
21.7 |
|
22 |
01119 |
Alabama |
Sumter |
7 |
39.7 |
38.7 |
34.7 |
|
23 |
01131 |
Alabama |
Wilcox |
7 |
45.2 |
39.9 |
33.4 |
|
24 |
02050 |
Alaska |
Bethel Census Area |
at large |
30.0 |
20.6 |
32.7 |
|
25 |
02070 |
Alaska |
Dillingham Census Area |
at large |
24.6 |
21.4 |
22.0 |
|
26 |
02158 |
Alaska |
|
at large |
31.0 |
26.2 |
35.1 |
|
27 |
02290 |
Alaska |
Yukon-Koyukuk Census Area |
at large |
26.0 |
23.8 |
23.7 |
|
28 |
04001 |
Arizona |
Apache |
1 |
47.1 |
37.8 |
37.3 |
|
29 |
04009 |
Arizona |
Graham |
1 |
26.7 |
23.0 |
20.2 |
|
30 |
04012 |
Arizona |
La Paz |
4 |
28.2 |
19.6 |
23.7 |
|
31 |
04017 |
Arizona |
Navajo |
1 |
34.7 |
29.5 |
28.5 |
|
32 |
04023 |
Arizona |
Santa Cruz |
3 |
26.4 |
24.5 |
24.4 |
|
33 |
05011 |
Arkansas |
Bradley |
4 |
24.9 |
26.3 |
21.7 |
|
34 |
05017 |
Arkansas |
Chicot |
1 |
40.4 |
28.6 |
31.4 |
|
35 |
05027 |
Arkansas |
Columbia |
4 |
24.4 |
21.1 |
22.4 |
|
36 |
05041 |
Arkansas |
Desha |
1 |
34.0 |
28.9 |
24.3 |
|
37 |
05057 |
Arkansas |
Hempstead |
4 |
22.7 |
20.3 |
20.6 |
|
38 |
05069 |
Arkansas |
Jefferson |
1, 4 |
23.9 |
20.5 |
22.2 |
|
39 |
05073 |
Arkansas |
Lafayette |
4 |
34.7 |
23.2 |
22.8 |
|
40 |
05077 |
Arkansas |
Lee |
1 |
47.3 |
29.9 |
43.0 |
|
41 |
05079 |
Arkansas |
Lincoln |
1 |
26.2 |
19.5 |
27.5 |
|
42 |
05093 |
Arkansas |
Mississippi |
1 |
26.2 |
23.0 |
25.7 |
|
43 |
05095 |
Arkansas |
Monroe |
1 |
35.9 |
27.5 |
26.0 |
|
44 |
05099 |
Arkansas |
Nevada |
4 |
20.3 |
22.8 |
21.3 |
|
45 |
05103 |
Arkansas |
Ouachita |
4 |
21.2 |
19.5 |
23.3 |
|
46 |
05107 |
Arkansas |
Phillips |
1 |
43.0 |
32.7 |
35.4 |
|
47 |
05111 |
Arkansas |
Poinsett |
1 |
25.6 |
21.2 |
23.7 |
|
48 |
05123 |
Arkansas |
St. Francis |
1 |
36.6 |
27.5 |
35.6 |
|
49 |
05129 |
Arkansas |
Searcy |
1, 3 |
29.9 |
23.8 |
24.3 |
|
50 |
05147 |
Arkansas |
Woodruff |
1 |
34.5 |
27.0 |
23.7 |
|
51 |
06019 |
California |
Fresno |
4, 16, 21, 22 |
21.4 |
22.9 |
21.3 |
|
52 |
06025 |
California |
Imperial |
51 |
23.8 |
22.6 |
21.4 |
|
53 |
06047 |
California |
Merced |
16 |
19.9 |
21.7 |
21.2 |
|
54 |
06107 |
California |
Tulare |
21, 22, 23 |
22.6 |
23.9 |
22.2 |
|
55 |
08011 |
Colorado |
Bent |
4 |
20.4 |
19.5 |
33.9 |
|
56 |
08021 |
Colorado |
Conejos |
3 |
33.9 |
23.0 |
21.4 |
|
57 |
08023 |
Colorado |
Costilla |
3 |
34.6 |
26.8 |
25.2 |
|
58 |
08099 |
Colorado |
Prowers |
4 |
21.0 |
19.5 |
21.6 |
|
59 |
08109 |
Colorado |
Saguache |
3 |
30.6 |
22.6 |
24.6 |
|
60 |
12001 |
Florida |
Alachua |
3 |
23.5 |
22.8 |
19.8 |
|
61 |
12039 |
Florida |
Gadsden |
5 |
28.0 |
19.9 |
23.6 |
|
62 |
12047 |
Florida |
Hamilton |
5 |
27.8 |
26.0 |
27.6 |
|
63 |
12049 |
Florida |
Hardee |
17 |
22.8 |
24.6 |
27.0 |
|
64 |
12079 |
Florida |
Madison |
5 |
25.9 |
23.1 |
22.8 |
|
65 |
13003 |
Georgia |
Atkinson |
8 |
26.0 |
23.0 |
26.1 |
|
66 |
13005 |
Georgia |
Bacon |
1 |
24.1 |
23.7 |
22.8 |
|
67 |
13007 |
Georgia |
Baker |
2 |
24.8 |
23.4 |
22.9 |
|
68 |
13017 |
Georgia |
Ben Hill |
8 |
22.0 |
22.3 |
26.2 |
|
69 |
13027 |
Georgia |
Brooks |
8 |
25.9 |
23.4 |
24.5 |
|
70 |
13031 |
Georgia |
Bulloch |
12 |
27.5 |
24.5 |
22.9 |
|
71 |
13033 |
Georgia |
Burke |
12 |
30.3 |
28.7 |
22.0 |
|
72 |
13037 |
Georgia |
Calhoun |
2 |
31.8 |
26.5 |
37.2 |
|
73 |
13043 |
Georgia |
Candler |
12 |
24.1 |
26.1 |
24.6 |
|
74 |
13059 |
Georgia |
Clarke |
9, 10 |
27.0 |
28.3 |
27.0 |
|
75 |
13061 |
Georgia |
Clay |
2 |
35.7 |
31.3 |
29.8 |
|
76 |
13065 |
Georgia |
Clinch |
1 |
26.4 |
23.4 |
25.8 |
|
77 |
13071 |
Georgia |
Colquitt |
8 |
22.8 |
19.8 |
23.9 |
|
78 |
13075 |
Georgia |
Cook |
8 |
22.4 |
20.7 |
24.5 |
|
79 |
13081 |
Georgia |
Crisp |
2 |
29.0 |
29.3 |
27.4 |
|
80 |
13087 |
Georgia |
Decatur |
2 |
23.3 |
22.7 |
23.2 |
|
81 |
13093 |
Georgia |
Dooly |
2 |
32.9 |
22.1 |
29.1 |
|
82 |
13095 |
Georgia |
Dougherty |
2 |
24.4 |
24.8 |
29.5 |
|
83 |
13099 |
Georgia |
Early |
2 |
31.4 |
25.7 |
26.5 |
|
84 |
13107 |
Georgia |
Emanuel |
12 |
25.7 |
27.4 |
25.1 |
|
85 |
13109 |
Georgia |
Evans |
12 |
25.4 |
27.0 |
26.6 |
|
86 |
13131 |
Georgia |
Grady |
2 |
22.3 |
21.3 |
20.0 |
|
87 |
13141 |
Georgia |
Hancock |
10 |
30.1 |
29.4 |
30.7 |
|
88 |
13163 |
Georgia |
Jefferson |
10 |
31.3 |
23.0 |
22.3 |
|
89 |
13165 |
Georgia |
Jenkins |
12 |
27.8 |
28.4 |
31.8 |
|
90 |
13167 |
Georgia |
Johnson |
10 |
22.2 |
22.6 |
30.0 |
|
91 |
13193 |
Georgia |
Macon |
2 |
29.2 |
25.8 |
30.5 |
|
92 |
13197 |
Georgia |
Marion |
2 |
28.2 |
22.4 |
22.8 |
|
93 |
13201 |
Georgia |
Miller |
2 |
22.1 |
21.2 |
22.4 |
|
94 |
13205 |
Georgia |
Mitchell |
2 |
28.7 |
26.4 |
29.3 |
|
95 |
13209 |
Georgia |
Montgomery |
12 |
24.5 |
19.9 |
22.1 |
|
96 |
13225 |
Georgia |
Peach |
2 |
24.0 |
20.2 |
24.0 |
|
97 |
13239 |
Georgia |
Quitman |
2 |
33.0 |
21.9 |
25.5 |
|
98 |
13243 |
Georgia |
Randolph |
2 |
35.9 |
27.7 |
30.8 |
|
99 |
13251 |
Georgia |
Screven |
12 |
22.9 |
20.1 |
25.9 |
|
100 |
13253 |
Georgia |
Seminole |
2 |
29.1 |
23.2 |
25.4 |
|
101 |
13259 |
Georgia |
Stewart |
2 |
31.4 |
22.2 |
37.9 |
|
102 |
13261 |
Georgia |
Sumter |
2 |
24.8 |
21.4 |
25.7 |
|
103 |
13263 |
Georgia |
Talbot |
2 |
24.9 |
24.2 |
24.8 |
|
104 |
13265 |
Georgia |
Taliaferro |
10 |
31.9 |
23.4 |
24.6 |
|
105 |
13267 |
Georgia |
Tattnall |
12 |
21.9 |
23.9 |
25.6 |
|
106 |
13269 |
Georgia |
Taylor |
2 |
29.5 |
26.0 |
22.9 |
|
107 |
13271 |
Georgia |
Telfair |
8 |
27.3 |
21.2 |
31.9 |
|
108 |
13273 |
Georgia |
Terrell |
2 |
29.1 |
28.6 |
27.8 |
|
109 |
13277 |
Georgia |
Tift |
8 |
22.9 |
19.9 |
19.6 |
|
110 |
13279 |
Georgia |
Toombs |
12 |
24.0 |
23.9 |
24.9 |
|
111 |
13283 |
Georgia |
Treutlen |
12 |
27.1 |
26.3 |
26.3 |
|
112 |
13287 |
Georgia |
Turner |
8 |
31.3 |
26.7 |
27.9 |
|
113 |
13289 |
Georgia |
Twiggs |
8 |
26.0 |
19.7 |
21.3 |
|
114 |
13299 |
Georgia |
Ware |
1 |
21.1 |
20.5 |
23.6 |
|
115 |
13301 |
Georgia |
Warren |
10 |
32.6 |
27.0 |
25.7 |
|
116 |
13303 |
Georgia |
Washington |
10 |
21.6 |
22.9 |
25.9 |
|
117 |
13309 |
Georgia |
Wheeler |
12 |
30.3 |
25.3 |
39.6 |
|
118 |
13315 |
Georgia |
Wilcox |
8 |
28.6 |
21.0 |
30.8 |
|
119 |
16065 |
Idaho |
Madison |
2 |
28.6 |
30.5 |
23.9 |
|
120 |
17003 |
Illinois |
Alexander |
12 |
32.2 |
26.1 |
27.6 |
|
121 |
17059 |
Illinois |
Gallatin |
15 |
21.4 |
20.7 |
20.5 |
|
122 |
17077 |
Illinois |
Jackson |
12 |
28.4 |
25.2 |
25.7 |
|
123 |
17153 |
Illinois |
Pulaski |
12 |
30.2 |
24.7 |
19.7 |
|
124 |
20161 |
Kansas |
Riley |
1 |
21.2 |
20.6 |
20.7 |
|
125 |
21001 |
Kentucky |
Adair |
1 |
25.1 |
24.0 |
23.8 |
|
126 |
21011 |
Kentucky |
Bath |
6 |
27.3 |
21.9 |
20.4 |
|
127 |
21013 |
Kentucky |
Bell |
5 |
36.2 |
31.1 |
31.3 |
|
128 |
21025 |
Kentucky |
Breathitt |
5 |
39.5 |
33.2 |
32.5 |
|
129 |
21043 |
Kentucky |
Carter |
5 |
26.8 |
22.3 |
31.1 |
|
130 |
21045 |
Kentucky |
Casey |
1 |
29.4 |
25.5 |
26.0 |
|
131 |
21051 |
Kentucky |
Clay |
5 |
40.2 |
39.7 |
38.2 |
|
132 |
21053 |
Kentucky |
Clinton |
1 |
38.1 |
25.8 |
25.7 |
|
133 |
21057 |
Kentucky |
Cumberland |
1 |
31.6 |
23.8 |
23.3 |
|
134 |
21063 |
Kentucky |
Elliott |
5 |
38.0 |
25.9 |
25.2 |
|
135 |
21065 |
Kentucky |
Estill |
6 |
29.0 |
26.4 |
25.3 |
|
136 |
21071 |
Kentucky |
Floyd |
5 |
31.2 |
30.3 |
34.2 |
|
137 |
21075 |
Kentucky |
Fulton |
1 |
30.3 |
23.1 |
30.2 |
|
138 |
21095 |
Kentucky |
Harlan |
5 |
33.1 |
32.5 |
33.4 |
|
139 |
21099 |
Kentucky |
Hart |
2 |
27.1 |
22.4 |
22.2 |
|
140 |
21109 |
Kentucky |
Jackson |
5 |
38.2 |
30.2 |
26.5 |
|
141 |
21115 |
Kentucky |
Johnson |
5 |
28.7 |
26.6 |
25.0 |
|
142 |
21119 |
Kentucky |
Knott |
5 |
40.4 |
31.1 |
32.1 |
|
143 |
21121 |
Kentucky |
Knox |
5 |
38.9 |
34.8 |
31.9 |
|
144 |
21125 |
Kentucky |
Laurel |
5 |
24.8 |
21.3 |
20.6 |
|
145 |
21127 |
Kentucky |
Lawrence |
5 |
36.0 |
30.7 |
25.5 |
|
146 |
21129 |
Kentucky |
Lee |
5 |
37.4 |
30.4 |
34.4 |
|
147 |
21131 |
Kentucky |
Leslie |
5 |
35.6 |
32.7 |
30.8 |
|
148 |
21133 |
Kentucky |
Letcher |
5 |
31.8 |
27.1 |
31.1 |
|
149 |
21135 |
Kentucky |
Lewis |
4 |
30.7 |
28.5 |
25.2 |
|
150 |
21137 |
Kentucky |
Lincoln |
5 |
27.2 |
21.1 |
20.6 |
|
151 |
21147 |
Kentucky |
McCreary |
5 |
45.5 |
32.2 |
33.7 |
|
152 |
21153 |
Kentucky |
Magoffin |
5 |
42.5 |
36.6 |
28.4 |
|
153 |
21159 |
Kentucky |
Martin |
5 |
35.4 |
37.0 |
39.1 |
|
154 |
21165 |
Kentucky |
Menifee |
6 |
35.0 |
29.6 |
26.4 |
|
155 |
21169 |
Kentucky |
Metcalfe |
1 |
27.9 |
23.6 |
23.3 |
|
156 |
21171 |
Kentucky |
Monroe |
1 |
26.9 |
23.4 |
23.0 |
|
157 |
21175 |
Kentucky |
Morgan |
5 |
38.8 |
27.2 |
27.3 |
|
158 |
21189 |
Kentucky |
Owsley |
5 |
52.1 |
45.4 |
39.2 |
|
159 |
21193 |
Kentucky |
Perry |
5 |
32.1 |
29.1 |
28.9 |
|
160 |
21195 |
Kentucky |
Pike |
5 |
25.4 |
23.4 |
23.8 |
|
161 |
21197 |
Kentucky |
Powell |
6 |
26.2 |
23.5 |
22.0 |
|
162 |
21203 |
Kentucky |
Rockcastle |
5 |
30.7 |
23.1 |
22.8 |
|
163 |
21205 |
Kentucky |
Rowan |
5 |
28.9 |
21.3 |
22.7 |
|
164 |
21207 |
Kentucky |
Russell |
1 |
25.6 |
24.3 |
21.6 |
|
165 |
21231 |
Kentucky |
Wayne |
5 |
37.3 |
29.4 |
28.1 |
|
166 |
21235 |
Kentucky |
Whitley |
5 |
33.0 |
26.4 |
25.7 |
|
167 |
21237 |
Kentucky |
Wolfe |
6 |
44.3 |
35.9 |
31.4 |
|
168 |
22001 |
Louisiana |
Acadia Parish |
3 |
30.5 |
24.5 |
25.2 |
|
169 |
22003 |
Louisiana |
Allen Parish |
4 |
29.9 |
19.9 |
19.6 |
|
170 |
22007 |
Louisiana |
Assumption Parish |
2, 6 |
28.2 |
21.8 |
20.7 |
|
171 |
22009 |
Louisiana |
Avoyelles Parish |
5 |
37.1 |
25.9 |
27.4 |
|
172 |
22013 |
Louisiana |
Bienville Parish |
4 |
31.2 |
26.1 |
26.9 |
|
173 |
22017 |
Louisiana |
Caddo Parish |
4 |
24.0 |
21.1 |
22.4 |
|
174 |
22021 |
Louisiana |
Caldwell Parish |
5 |
28.8 |
21.2 |
20.8 |
|
175 |
22025 |
Louisiana |
Catahoula Parish |
5 |
36.8 |
28.1 |
26.0 |
|
176 |
22027 |
Louisiana |
Claiborne Parish |
4 |
32.0 |
26.5 |
32.7 |
|
177 |
22029 |
Louisiana |
Concordia Parish |
5 |
30.6 |
29.1 |
27.2 |
|
178 |
22035 |
Louisiana |
East Carroll Parish |
5 |
56.8 |
40.5 |
45.7 |
|
179 |
22037 |
Louisiana |
East Feliciana Parish |
5, 6 |
25.0 |
23.0 |
19.6 |
|
180 |
22039 |
Louisiana |
Evangeline Parish |
4 |
35.1 |
32.2 |
27.3 |
|
181 |
22041 |
Louisiana |
Franklin Parish |
5 |
34.5 |
28.4 |
27.3 |
|
182 |
22043 |
Louisiana |
Grant Parish |
5 |
25.5 |
21.5 |
20.0 |
|
183 |
22045 |
Louisiana |
Iberia Parish |
3 |
25.8 |
23.6 |
24.1 |
|
184 |
22047 |
Louisiana |
Iberville Parish |
2, 6 |
28.0 |
23.1 |
23.8 |
|
185 |
22049 |
Louisiana |
Jackson Parish |
5 |
23.9 |
19.8 |
21.6 |
|
186 |
22061 |
Louisiana |
Lincoln Parish |
5 |
26.6 |
26.5 |
25.8 |
|
187 |
22065 |
Louisiana |
Madison Parish |
5 |
44.6 |
36.7 |
41.7 |
|
188 |
22067 |
Louisiana |
Morehouse Parish |
5 |
31.0 |
26.8 |
27.4 |
|
189 |
22069 |
Louisiana |
Natchitoches Parish |
4 |
33.9 |
26.5 |
32.8 |
|
190 |
22071 |
Louisiana |
Orleans Parish |
1, 2 |
31.6 |
27.9 |
23.8 |
|
191 |
22073 |
Louisiana |
Ouachita Parish |
5 |
24.7 |
20.7 |
21.3 |
|
192 |
22077 |
Louisiana |
Pointe Coupee Parish |
6 |
30.3 |
23.1 |
20.3 |
|
193 |
22081 |
Louisiana |
Red River Parish |
4 |
35.1 |
29.9 |
23.1 |
|
194 |
22083 |
Louisiana |
Richland Parish |
5 |
33.2 |
27.9 |
26.2 |
|
195 |
22085 |
Louisiana |
Sabine Parish |
4 |
27.1 |
21.5 |
23.1 |
|
196 |
22091 |
Louisiana |
St. Helena Parish |
5, 6 |
34.4 |
26.8 |
19.6 |
|
197 |
22097 |
Louisiana |
St. Landry Parish |
3, 4, 5 |
36.3 |
29.3 |
32.7 |
|
198 |
22101 |
Louisiana |
St. Mary Parish |
3 |
27.0 |
23.6 |
21.0 |
|
199 |
22107 |
Louisiana |
Tensas Parish |
5 |
46.3 |
36.3 |
31.6 |
|
200 |
22117 |
Louisiana |
Washington Parish |
5 |
31.6 |
24.7 |
24.6 |
|
201 |
22119 |
Louisiana |
Webster Parish |
4 |
25.1 |
20.2 |
26.0 |
|
202 |
22123 |
Louisiana |
West Carroll Parish |
5 |
27.4 |
23.4 |
23.3 |
|
203 |
22125 |
Louisiana |
West Feliciana Parish |
5 |
33.8 |
19.9 |
24.4 |
|
204 |
22127 |
Louisiana |
Winn Parish |
5 |
27.5 |
21.5 |
22.8 |
|
205 |
26073 |
Michigan |
Isabella |
4 |
24.9 |
20.4 |
23.4 |
|
206 |
28001 |
Mississippi |
Adams |
3 |
30.5 |
25.9 |
29.4 |
|
207 |
28005 |
Mississippi |
Amite |
3 |
30.9 |
22.6 |
22.2 |
|
208 |
28007 |
Mississippi |
Attala |
2 |
30.2 |
21.8 |
23.7 |
|
209 |
28009 |
Mississippi |
Benton |
1 |
29.7 |
23.2 |
22.1 |
|
210 |
28011 |
Mississippi |
Bolivar |
2 |
42.9 |
33.3 |
29.4 |
|
211 |
28017 |
Mississippi |
Chickasaw |
1 |
21.3 |
20.0 |
20.3 |
|
212 |
28019 |
Mississippi |
Choctaw |
1 |
25.0 |
24.7 |
20.4 |
|
213 |
28021 |
Mississippi |
Claiborne |
2 |
43.6 |
32.4 |
36.3 |
|
214 |
28023 |
Mississippi |
Clarke |
3, 4 |
23.4 |
23.0 |
21.6 |
|
215 |
28025 |
Mississippi |
Clay |
1 |
25.9 |
23.5 |
21.9 |
|
216 |
28027 |
Mississippi |
Coahoma |
2 |
45.5 |
35.9 |
35.9 |
|
217 |
28029 |
Mississippi |
Copiah |
2 |
32.0 |
25.1 |
26.5 |
|
218 |
28031 |
Mississippi |
Covington |
3 |
31.2 |
23.5 |
26.5 |
|
219 |
28035 |
Mississippi |
Forrest |
4 |
27.5 |
22.5 |
24.0 |
|
220 |
28037 |
Mississippi |
Franklin |
3 |
33.3 |
24.1 |
20.1 |
|
221 |
28041 |
Mississippi |
Greene |
4 |
26.8 |
19.6 |
22.6 |
|
222 |
28043 |
Mississippi |
Grenada |
2 |
22.3 |
20.9 |
22.3 |
|
223 |
28051 |
Mississippi |
Holmes |
2 |
53.2 |
41.1 |
33.2 |
|
224 |
28053 |
Mississippi |
Humphreys |
2 |
45.9 |
38.2 |
37.0 |
|
225 |
28055 |
Mississippi |
Issaquena |
2 |
49.3 |
33.2 |
40.5 |
|
226 |
28063 |
Mississippi |
Jefferson |
2 |
46.9 |
36.0 |
35.5 |
|
227 |
28065 |
Mississippi |
Jefferson Davis |
3 |
33.3 |
28.2 |
26.0 |
|
228 |
28067 |
Mississippi |
Jones |
4 |
22.7 |
19.8 |
19.9 |
|
229 |
28069 |
Mississippi |
Kemper |
3 |
35.1 |
26.0 |
27.5 |
|
230 |
28075 |
Mississippi |
Lauderdale |
3 |
22.8 |
20.8 |
25.5 |
|
231 |
28079 |
Mississippi |
Leake |
2 |
29.6 |
23.3 |
25.4 |
|
232 |
28083 |
Mississippi |
Leflore |
2 |
38.9 |
34.8 |
35.1 |
|
233 |
28087 |
Mississippi |
Lowndes |
1 |
22.1 |
21.3 |
23.1 |
|
234 |
28091 |
Mississippi |
Marion |
4 |
29.6 |
24.8 |
27.2 |
|
235 |
28093 |
Mississippi |
Marshall |
1 |
30.0 |
21.9 |
20.9 |
|
236 |
28097 |
Mississippi |
Montgomery |
2 |
34.0 |
24.3 |
22.9 |
|
237 |
28099 |
Mississippi |
Neshoba |
3 |
26.6 |
21.0 |
26.9 |
|
238 |
28101 |
Mississippi |
Newton |
3 |
20.9 |
19.9 |
21.2 |
|
239 |
28103 |
Mississippi |
Noxubee |
3 |
41.4 |
32.8 |
29.0 |
|
240 |
28105 |
Mississippi |
Oktibbeha |
1, 3 |
30.1 |
28.2 |
27.3 |
|
241 |
28107 |
Mississippi |
Panola |
2 |
33.8 |
25.3 |
21.8 |
|
242 |
28111 |
Mississippi |
Perry |
4 |
29.1 |
22.0 |
22.0 |
|
243 |
28113 |
Mississippi |
Pike |
3 |
32.9 |
25.3 |
30.6 |
|
244 |
28119 |
Mississippi |
Quitman |
2 |
41.6 |
33.1 |
37.6 |
|
245 |
28123 |
Mississippi |
Scott |
3 |
27.4 |
20.7 |
25.5 |
|
246 |
28125 |
Mississippi |
Sharkey |
2 |
47.5 |
38.3 |
33.6 |
|
247 |
28127 |
Mississippi |
Simpson |
3 |
22.7 |
21.6 |
19.8 |
|
248 |
28133 |
Mississippi |
Sunflower |
2 |
41.8 |
30.0 |
32.6 |
|
249 |
28135 |
Mississippi |
Tallahatchie |
2 |
41.9 |
32.2 |
33.4 |
|
250 |
28143 |
Mississippi |
Tunica |
2 |
56.8 |
33.1 |
26.5 |
|
251 |
28147 |
Mississippi |
Walthall |
3 |
35.9 |
27.8 |
23.4 |
|
252 |
28151 |
Mississippi |
Washington |
2 |
33.8 |
29.2 |
32.6 |
|
253 |
28153 |
Mississippi |
Wayne |
4 |
29.5 |
25.4 |
21.4 |
|
254 |
28157 |
Mississippi |
Wilkinson |
3 |
42.2 |
37.7 |
30.3 |
|
255 |
28159 |
Mississippi |
Winston |
1 |
26.6 |
23.7 |
21.0 |
|
256 |
28163 |
Mississippi |
Yazoo |
2 |
39.2 |
31.9 |
37.1 |
|
257 |
29001 |
Missouri |
Adair |
6 |
24.9 |
23.3 |
23.9 |
|
258 |
29035 |
Missouri |
Carter |
8 |
27.6 |
25.2 |
22.6 |
|
259 |
29069 |
Missouri |
Dunklin |
8 |
29.9 |
24.5 |
26.1 |
|
260 |
29133 |
Missouri |
Mississippi |
8 |
29.7 |
23.7 |
26.8 |
|
261 |
29149 |
Missouri |
Oregon |
8 |
27.4 |
22.0 |
23.8 |
|
262 |
29153 |
Missouri |
Ozark |
8 |
22.1 |
21.6 |
22.0 |
|
263 |
29155 |
Missouri |
Pemiscot |
8 |
35.8 |
30.4 |
29.1 |
|
264 |
29179 |
Missouri |
Reynolds |
8 |
24.2 |
20.1 |
20.3 |
|
265 |
29181 |
Missouri |
Ripley |
8 |
31.5 |
22.0 |
23.5 |
|
266 |
29203 |
Missouri |
Shannon |
8 |
24.1 |
26.9 |
22.6 |
|
267 |
29215 |
Missouri |
Texas |
8 |
22.9 |
21.4 |
24.6 |
|
268 |
29221 |
Missouri |
Washington |
8 |
27.2 |
20.8 |
21.7 |
|
269 |
29223 |
Missouri |
Wayne |
8 |
29.0 |
21.9 |
23.3 |
|
270 |
29229 |
Missouri |
Wright |
8 |
25.3 |
21.7 |
23.9 |
|
271 |
29510 |
Missouri |
St. Louis city |
1 |
24.6 |
24.6 |
22.8 |
|
272 |
30003 |
Montana |
Big Horn |
at large |
35.3 |
29.2 |
25.6 |
|
273 |
30005 |
Montana |
Blaine |
at large |
27.7 |
28.1 |
20.8 |
|
274 |
30035 |
Montana |
Glacier |
at large |
35.7 |
27.3 |
27.0 |
|
275 |
30085 |
Montana |
Roosevelt |
at large |
27.7 |
32.4 |
25.4 |
|
276 |
31173 |
Nebraska |
Thurston |
1 |
30.9 |
25.6 |
23.9 |
|
277 |
35003 |
New Mexico |
Catron |
2 |
25.6 |
24.5 |
23.3 |
|
278 |
35006 |
New Mexico |
Cibola |
2 |
33.6 |
24.8 |
28.6 |
|
279 |
35013 |
New Mexico |
Doña Ana |
2 |
26.5 |
25.4 |
24.9 |
|
280 |
35019 |
New Mexico |
Guadalupe |
2 |
38.5 |
21.6 |
24.3 |
|
281 |
35023 |
New Mexico |
Hidalgo |
2 |
20.7 |
27.3 |
25.7 |
|
282 |
35029 |
New Mexico |
Luna |
2 |
31.5 |
32.9 |
27.2 |
|
283 |
35031 |
New Mexico |
McKinley |
2, 3 |
43.5 |
36.1 |
32.3 |
|
284 |
35033 |
New Mexico |
Mora |
3 |
36.2 |
25.4 |
23.5 |
|
285 |
35037 |
New Mexico |
Quay |
3 |
25.1 |
20.9 |
24.1 |
|
286 |
35039 |
New Mexico |
Rio Arriba |
3 |
27.5 |
20.3 |
22.0 |
|
287 |
35041 |
New Mexico |
Roosevelt |
2, 3 |
26.9 |
22.7 |
22.6 |
|
288 |
35045 |
New Mexico |
San Juan |
3 |
28.3 |
21.5 |
23.1 |
|
289 |
35047 |
New Mexico |
San Miguel |
3 |
30.2 |
24.4 |
28.2 |
|
290 |
35051 |
New Mexico |
Sierra |
2 |
19.6 |
20.9 |
25.7 |
|
291 |
35053 |
New Mexico |
Socorro |
2 |
29.9 |
31.7 |
29.6 |
|
292 |
35055 |
New Mexico |
Taos |
3 |
27.5 |
20.9 |
21.4 |
|
293 |
36005 |
New York |
Bronx |
13, 14, 15, 16 |
28.7 |
30.7 |
27.3 |
|
294 |
37015 |
North Carolina |
Bertie |
1 |
25.9 |
23.5 |
23.5 |
|
295 |
37017 |
North Carolina |
Bladen |
7, 9 |
21.9 |
21.0 |
29.1 |
|
296 |
37047 |
North Carolina |
Columbus |
7 |
24.0 |
22.7 |
25.3 |
|
297 |
37065 |
North Carolina |
Edgecombe |
1 |
20.9 |
19.6 |
22.9 |
|
298 |
37083 |
North Carolina |
Halifax |
1 |
25.6 |
23.9 |
22.0 |
|
299 |
37117 |
North Carolina |
Martin |
1 |
22.3 |
20.2 |
20.3 |
|
300 |
37131 |
North Carolina |
Northampton |
1 |
23.6 |
21.3 |
21.4 |
|
301 |
37147 |
North Carolina |
Pitt |
1, 3 |
22.1 |
20.3 |
23.2 |
|
302 |
37155 |
North Carolina |
Robeson |
9 |
24.1 |
22.8 |
24.5 |
|
303 |
37177 |
North Carolina |
Tyrrell |
3 |
25.0 |
23.3 |
25.2 |
|
304 |
37181 |
North Carolina |
Vance |
1 |
19.6 |
20.5 |
26.3 |
|
305 |
37187 |
North Carolina |
Washington |
1 |
20.4 |
21.8 |
21.1 |
|
306 |
38005 |
North Dakota |
Benson |
at large |
31.7 |
29.1 |
30.8 |
|
307 |
38079 |
North Dakota |
Rolette |
at large |
40.7 |
31.0 |
24.7 |
|
308 |
38085 |
North Dakota |
Sioux |
at large |
47.4 |
39.2 |
32.9 |
|
309 |
39009 |
Ohio |
Athens |
6, 15 |
28.7 |
27.4 |
30.7 |
|
310 |
40001 |
Oklahoma |
Adair |
2 |
26.7 |
23.2 |
24.6 |
|
311 |
40005 |
Oklahoma |
Atoka |
2 |
31.1 |
19.8 |
20.8 |
|
312 |
40015 |
Oklahoma |
Caddo |
3 |
27.8 |
21.7 |
19.5 |
|
313 |
40021 |
Oklahoma |
Cherokee |
2 |
28.8 |
22.9 |
21.0 |
|
314 |
40023 |
Oklahoma |
Choctaw |
2 |
32.7 |
24.3 |
23.0 |
|
315 |
40029 |
Oklahoma |
Coal |
2 |
27.4 |
23.1 |
22.6 |
|
316 |
40055 |
Oklahoma |
Greer |
3 |
23.4 |
19.6 |
26.0 |
|
317 |
40057 |
Oklahoma |
Harmon |
3 |
34.2 |
29.7 |
23.9 |
|
318 |
40061 |
Oklahoma |
Haskell |
2 |
27.1 |
20.5 |
23.3 |
|
319 |
40063 |
Oklahoma |
Hughes |
2 |
26.9 |
21.9 |
24.6 |
|
320 |
40069 |
Oklahoma |
Johnston |
2 |
28.5 |
22.0 |
19.5 |
|
321 |
40089 |
Oklahoma |
McCurtain |
2 |
30.2 |
24.7 |
21.1 |
|
322 |
40107 |
Oklahoma |
Okfuskee |
2 |
29.4 |
23.0 |
26.1 |
|
323 |
40119 |
Oklahoma |
Payne |
3 |
21.7 |
20.3 |
22.8 |
|
324 |
40127 |
Oklahoma |
Pushmataha |
2 |
30.2 |
23.2 |
19.7 |
|
325 |
40141 |
Oklahoma |
Tillman |
4 |
22.9 |
21.9 |
21.1 |
|
326 |
42101 |
Pennsylvania |
Philadelphia |
2, 3, 5 |
20.3 |
22.9 |
24.3 |
|
327 |
45005 |
South Carolina |
Allendale |
6 |
35.8 |
34.5 |
37.3 |
|
328 |
45009 |
South Carolina |
Bamberg |
6 |
28.2 |
27.8 |
26.7 |
|
329 |
45011 |
South Carolina |
Barnwell |
2 |
21.8 |
20.9 |
22.4 |
|
330 |
45027 |
South Carolina |
Clarendon |
6 |
29.0 |
23.1 |
26.4 |
|
331 |
45029 |
South Carolina |
Colleton |
1, 6 |
23.4 |
21.1 |
20.0 |
|
332 |
45031 |
South Carolina |
Darlington |
7 |
19.9 |
20.3 |
23.5 |
|
333 |
45033 |
South Carolina |
Dillon |
7 |
28.1 |
24.2 |
32.1 |
|
334 |
45039 |
South Carolina |
Fairfield |
5 |
20.6 |
19.6 |
23.7 |
|
335 |
45049 |
South Carolina |
Hampton |
6 |
27.7 |
21.8 |
25.8 |
|
336 |
45061 |
South Carolina |
Lee |
5 |
29.6 |
21.8 |
28.1 |
|
337 |
45067 |
South Carolina |
Marion |
7 |
28.6 |
23.2 |
25.5 |
|
338 |
45069 |
South Carolina |
Marlboro |
7 |
26.6 |
21.7 |
30.0 |
|
339 |
45075 |
South Carolina |
Orangeburg |
2, 6 |
24.9 |
21.4 |
25.9 |
|
340 |
45089 |
South Carolina |
Williamsburg |
6 |
28.7 |
27.9 |
26.0 |
|
341 |
46007 |
South Dakota |
Bennett |
at large |
37.6 |
39.2 |
32.5 |
|
342 |
46017 |
South Dakota |
Buffalo |
at large |
45.1 |
56.9 |
45.7 |
|
343 |
46023 |
South Dakota |
Charles Mix |
at large |
31.4 |
26.9 |
20.9 |
|
344 |
46027 |
South Dakota |
Clay |
at large |
24.6 |
21.2 |
19.5 |
|
345 |
46031 |
South Dakota |
Corson |
at large |
42.5 |
41.0 |
33.6 |
|
346 |
46041 |
South Dakota |
Dewey |
at large |
44.4 |
33.6 |
25.8 |
|
347 |
46071 |
South Dakota |
Jackson |
at large |
38.8 |
36.5 |
32.7 |
|
348 |
46085 |
South Dakota |
Lyman |
at large |
24.7 |
24.3 |
21.1 |
|
349 |
46095 |
South Dakota |
Mellette |
at large |
41.3 |
35.8 |
35.2 |
|
350 |
46102 |
South Dakota |
|
at large |
63.1 |
52.3 |
54.0 |
|
351 |
46109 |
South Dakota |
Roberts |
at large |
26.4 |
22.1 |
21.3 |
|
352 |
46121 |
South Dakota |
Todd |
at large |
50.2 |
48.3 |
48.4 |
|
353 |
46123 |
South Dakota |
Tripp |
at large |
20.6 |
19.9 |
19.9 |
|
354 |
46137 |
South Dakota |
Ziebach |
at large |
51.1 |
49.9 |
43.9 |
|
355 |
47013 |
Tennessee |
Campbell |
2, 3 |
26.8 |
22.8 |
21.6 |
|
356 |
47025 |
Tennessee |
Claiborne |
2 |
25.7 |
22.6 |
23.4 |
|
357 |
47029 |
Tennessee |
Cocke |
1 |
25.3 |
22.5 |
22.5 |
|
358 |
47049 |
Tennessee |
Fentress |
6 |
32.3 |
23.1 |
20.6 |
|
359 |
47061 |
Tennessee |
Grundy |
4 |
23.9 |
25.8 |
21.2 |
|
360 |
47067 |
Tennessee |
Hancock |
1 |
40.0 |
29.4 |
29.9 |
|
361 |
47069 |
Tennessee |
Hardeman |
7 |
23.3 |
19.7 |
23.5 |
|
362 |
47075 |
Tennessee |
Haywood |
8 |
27.5 |
19.5 |
20.5 |
|
363 |
47091 |
Tennessee |
Johnson |
1 |
28.5 |
22.6 |
20.7 |
|
364 |
47095 |
Tennessee |
Lake |
8 |
27.5 |
23.6 |
36.5 |
|
365 |
47151 |
Tennessee |
Scott |
3 |
27.8 |
20.2 |
21.2 |
|
366 |
47173 |
Tennessee |
Union |
3 |
21.3 |
19.6 |
19.8 |
|
367 |
48007 |
Texas |
Aransas |
27 |
25.2 |
19.9 |
19.9 |
|
368 |
48025 |
Texas |
Bee |
34 |
27.4 |
24.0 |
26.7 |
|
369 |
48041 |
Texas |
Brazos |
17 |
26.7 |
26.9 |
23.2 |
|
370 |
48047 |
Texas |
Brooks |
15 |
36.8 |
40.2 |
31.0 |
|
371 |
48061 |
Texas |
Cameron |
34 |
39.7 |
33.1 |
27.9 |
|
372 |
48079 |
Texas |
Cochran |
19 |
28.3 |
27.0 |
21.9 |
|
373 |
48107 |
Texas |
Crosby |
19 |
29.5 |
28.1 |
23.7 |
|
374 |
48109 |
Texas |
Culberson |
23 |
29.8 |
25.1 |
20.3 |
|
375 |
48115 |
Texas |
Dawson |
11 |
30.5 |
19.7 |
22.9 |
|
376 |
48127 |
Texas |
Dimmit |
23 |
48.9 |
33.2 |
24.6 |
|
377 |
48131 |
Texas |
Duval |
15 |
39.0 |
27.2 |
25.5 |
|
378 |
48137 |
Texas |
Edwards |
23 |
41.7 |
31.6 |
22.1 |
|
379 |
48141 |
Texas |
El Paso |
16, 23 |
26.8 |
23.8 |
20.5 |
|
380 |
48145 |
Texas |
Falls |
17 |
27.5 |
22.6 |
21.7 |
|
381 |
48153 |
Texas |
Floyd |
13, 19 |
27.1 |
21.5 |
21.0 |
|
382 |
48163 |
Texas |
Frio |
23 |
39.1 |
29.0 |
27.5 |
|
383 |
48169 |
Texas |
Garza |
19 |
23.1 |
22.3 |
24.6 |
|
384 |
48191 |
Texas |
Hall |
13 |
29.1 |
26.3 |
24.1 |
|
385 |
48207 |
Texas |
Haskell |
19 |
20.8 |
22.8 |
23.1 |
|
386 |
48215 |
Texas |
Hidalgo |
15, 28, 34 |
41.9 |
35.9 |
30.0 |
|
387 |
48225 |
Texas |
Houston |
8 |
25.6 |
21.0 |
26.1 |
|
388 |
48247 |
Texas |
Jim Hogg |
15 |
35.3 |
25.9 |
25.2 |
|
389 |
48249 |
Texas |
Jim Wells |
34 |
30.3 |
24.1 |
21.2 |
|
390 |
48255 |
Texas |
Karnes |
15 |
36.5 |
21.9 |
21.8 |
|
391 |
48271 |
Texas |
Kinney |
23 |
28.6 |
24.0 |
21.1 |
|
392 |
48273 |
Texas |
Kleberg |
34 |
27.4 |
26.7 |
25.0 |
|
393 |
48275 |
Texas |
Knox |
13 |
23.6 |
22.9 |
20.4 |
|
394 |
48279 |
Texas |
Lamb |
19 |
27.1 |
20.9 |
20.0 |
|
395 |
48283 |
Texas |
La Salle |
23, 28 |
37.0 |
29.8 |
29.6 |
|
396 |
48315 |
Texas |
Marion |
4 |
60.6 |
22.4 |
21.9 |
|
397 |
48323 |
Texas |
Maverick |
23 |
50.4 |
34.8 |
25.9 |
|
398 |
48327 |
Texas |
Menard |
11 |
31.1 |
25.8 |
21.6 |
|
399 |
48347 |
Texas |
Nacogdoches |
1 |
25.2 |
23.3 |
21.6 |
|
400 |
48371 |
Texas |
Pecos |
23 |
29.6 |
20.4 |
19.5 |
|
401 |
48377 |
Texas |
Presidio |
23 |
48.1 |
36.4 |
22.4 |
|
402 |
48389 |
Texas |
Reeves |
23 |
28.8 |
28.9 |
21.5 |
|
403 |
48405 |
Texas |
San Augustine |
1 |
29.7 |
21.2 |
22.2 |
|
404 |
48427 |
Texas |
Starr |
28 |
60.0 |
50.9 |
33.2 |
|
405 |
48445 |
Texas |
Terry |
19 |
25.5 |
23.3 |
22.4 |
|
406 |
48463 |
Texas |
Uvalde |
23 |
31.1 |
24.3 |
22.9 |
|
407 |
48479 |
Texas |
Webb |
28 |
38.2 |
31.2 |
25.7 |
|
408 |
48489 |
Texas |
Willacy |
34 |
44.5 |
33.2 |
35.0 |
|
409 |
48505 |
Texas |
Zapata |
28 |
41.0 |
35.8 |
32.1 |
|
410 |
48507 |
Texas |
Zavala |
23 |
50.4 |
41.8 |
32.0 |
|
411 |
49037 |
Utah |
San Juan |
3 |
36.4 |
31.4 |
22.6 |
|
412 |
51027 |
Virginia |
Buchanan |
9 |
21.9 |
23.2 |
27.6 |
|
413 |
51029 |
Virginia |
Buckingham |
5 |
19.5 |
20.0 |
20.2 |
|
414 |
51051 |
Virginia |
Dickenson |
9 |
25.9 |
21.3 |
25.2 |
|
415 |
51105 |
Virginia |
Lee |
9 |
28.7 |
23.9 |
24.8 |
|
416 |
51121 |
Virginia |
Montgomery |
9 |
22.1 |
23.2 |
24.1 |
|
417 |
51195 |
Virginia |
Wise |
9 |
21.6 |
20.0 |
25.4 |
|
418 |
51540 |
Virginia |
Charlottesville city |
5 |
23.7 |
25.9 |
23.1 |
|
419 |
51660 |
Virginia |
Harrisonburg city |
6 |
21.5 |
30.1 |
28.0 |
|
420 |
51720 |
Virginia |
Norton city |
9 |
26.7 |
22.8 |
20.8 |
|
421 |
51730 |
Virginia |
Petersburg city |
4 |
20.3 |
19.6 |
24.1 |
|
422 |
51750 |
Virginia |
Radford city |
9 |
32.2 |
31.4 |
30.4 |
|
423 |
51760 |
Virginia |
Richmond city |
4 |
20.9 |
21.4 |
22.3 |
|
424 |
53075 |
Washington |
Whitman |
5 |
24.2 |
25.6 |
25.4 |
|
425 |
54001 |
West Virginia |
Barbour |
1 |
28.5 |
22.6 |
20.0 |
|
426 |
54005 |
West Virginia |
Boone |
3 |
27.0 |
22.0 |
22.5 |
|
427 |
54007 |
West Virginia |
Braxton |
2 |
25.8 |
22.0 |
21.6 |
|
428 |
54013 |
West Virginia |
Calhoun |
2 |
32.0 |
25.1 |
22.8 |
|
429 |
54015 |
West Virginia |
Clay |
2 |
39.2 |
27.5 |
25.1 |
|
430 |
54019 |
West Virginia |
Fayette |
3 |
24.4 |
21.7 |
22.5 |
|
431 |
54021 |
West Virginia |
Gilmer |
1 |
33.5 |
25.9 |
24.8 |
|
432 |
54043 |
West Virginia |
Lincoln |
3 |
33.8 |
27.9 |
23.3 |
|
433 |
54045 |
West Virginia |
Logan |
3 |
27.7 |
24.1 |
24.6 |
|
434 |
54047 |
West Virginia |
McDowell |
3 |
37.7 |
37.7 |
35.4 |
|
435 |
54055 |
West Virginia |
Mercer |
3 |
20.4 |
19.7 |
22.7 |
|
436 |
54059 |
West Virginia |
Mingo |
3 |
30.9 |
29.7 |
27.0 |
|
437 |
54087 |
West Virginia |
Roane |
2 |
28.1 |
22.6 |
22.1 |
|
438 |
54089 |
West Virginia |
Summers |
3 |
24.5 |
24.4 |
26.9 |
|
439 |
54099 |
West Virginia |
Wayne |
3 |
21.8 |
19.6 |
20.9 |
|
440 |
54101 |
West Virginia |
Webster |
3 |
34.8 |
31.8 |
23.0 |
|
441 |
54109 |
West Virginia |
Wyoming |
3 |
27.9 |
25.1 |
24.1 |
|
442 |
55078 |
Wisconsin |
Menominee |
8 |
48.7 |
28.8 |
26.5 |
|
443 |
56001 |
Wyoming |
Albany |
at large |
19.8 |
21.0 |
20.4 |
Source: Congressional Research Service (CRS) tabulation of data from U.S. Census Bureau, 1990 Census, Census 2000, 2018 Small Area Income and Poverty Estimates, and Nation-Based Relationship File for Congressional Districts and Counties (116th Congress).
Notes: FIPS: Federal Information Processing Standard.
a. Numbers are ordinal, referring to the name of the congressional district(s) present in the county. For example, to the name of the congressional district(s) present in the county. For
example, Barbour County, AL, is represented by Alabama's 2nd’s 2nd Congressional District (indicated by the 2). A congressional district may span multiple counties; conversely, a single county may be split among multiple congressional congressional districts. Part of Clarke County, AL, for example, is represented by Alabama's 1st Congressional ’s 1st Congressional District (indicated by the 1) and part by the 7th7th Congressional District (indicated by the 7). Counties labeled "“at large"” are located in states that have only one member of the House of Representatives for the entire state.
b.
b. Changed name and geographic code effective July 1, 2015, from Wade Hampton Census Area (02270) to Kusilvak
Kusilvak Census Area (02158).
c.
c. Changed name and geographic code effective May 1, 2015, from Shannon County (46113) to Oglala Lakota
County (46102).
Congressional Research Service
21
County (46102).
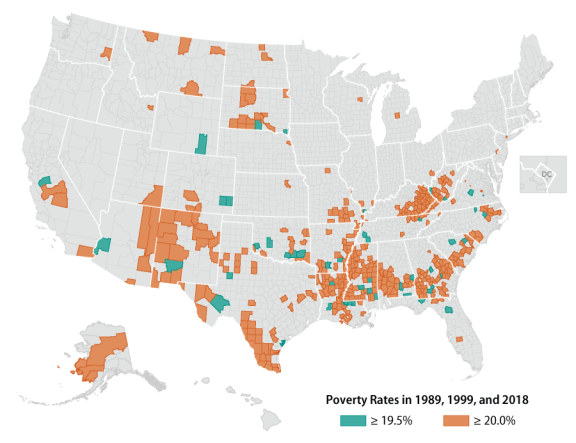
Appendix. Details on the Data Sources
Decennial Census of Population and Housing, "Long Form"
Poverty estimates are computed using data from household surveys, which are based on a sample of households. In order to obtain meaningful estimates for any geographic area, the sample has to include enough responses from that area so that selecting a different sample of households from
that area would not likely result in a dramaticallydramatical y different estimate. If estimates for smaller smal er geographic areas are desired, a larger sample size is needed. A national-level survey, for instance, could produce reliable estimates for the United States without obtaining any responses from many counties, particularly counties with small smal populations. In order to produce estimates for all al 3,143 county areas in the nation, however, not only are responses needed from every county, but those
responses have to be plentiful enough from each county so that the estimates are meaningful (i.e.,
their margins of error are not unhelpfully wide).
Before the mid-1990s, the only data source with a sample size large enough to provide
meaningful estimates at the county level (and for other small smal geographic areas) was the decennial census. The other household surveys available prior to that time did not have a sample size large enough to produce meaningful estimates for small smal areas such as counties. Income questions were asked on the census long form, which was sent to one-sixth of all al U.S. households; the rest received the census short form, which did not ask about income. While technically still stil a sample,
one-sixth of all al households was a large enough sample to provide poverty estimates for every county in the nation, and even for smallersmal er areas such as small smal towns. The long form was discontinued after Census 2000, and therefore poverty data are no longer available from the decennial census for the 50 states, the District of Columbia, and Puerto Rico.1618 Beginning in the mid-1990s, however, two additional data sources were developed to ensure that poverty estimates for small
for smal areas such as counties would still stil be available: the American Community Survey
(ACS), and the Small Smal Area Income and Poverty Estimates program (SAIPE).
American Community Survey (ACS)
The ACS replaced the decennial census long form. It was developed to accommodate the needs of local government officials and other stakeholders who needed detailed information on small smal communities on a more frequent basis than once every 10 years. To that end, the ACS
questionnaire was designed to reflect the same topics asked in the census long form.
In order to produce meaningful estimates for small smal communities, however, the ACS needs to collect a number of responses comparable to what was collected in the decennial census.1719 In order to collect that many responses while providing information more currently than once every
10 years, the ACS collects information from respondents continuously, in every month, as opposed to at one time of the year, and responses over time are pooled to provide estimates at varying geographic levels. To obtain estimates for geographic areas of 65,000 or more persons,
18 Poverty estimates from the decennial census continue to be produced for American Samoa, the Commonwealth of the Northern Mariana Islands, Guam, and the U.S. Virgin Islands. SAIPE and ACS estimates are not. See footnote 12.
19 A sample of approximately 18.3 million households received the Census 2000 long form. Scott Boggess and Nikki L. Graf, “Measuring Education: A Comparison of the Decennial Census and the American Community Survey,” prese nted at Joint Statistical Meetings, San Francisco, CA, August 7, 2003. http://census.gov/content/dam/Census/library/working-papers/2003/acs/2003_Boggess_01_doc.pdf. From 2014 to 2018, 17.7 million housing unit addresses were sampled in the ACS. http://www.census.gov/acs/www/methodology/sample-size-and-data-quality/sample-size/index.php.
Congressional Research Service
23
The 10-20-30 Provision: Defining Persistent Poverty Counties
one year’varying geographic levels. To obtain estimates for geographic areas of 65,000 or more persons, one year's worth of responses are pooled—these are the ACS one-year estimates. For the smallest smal est geographic levels, which include the complete set of U.S. counties, five years of monthly responses are needed: these are the ACS five-year estimates. Even though data collection is ongoing, the publication of the data takes place only once every year, both for the one-year
estimates and the estimates that represent the previous five-year span.
Small Area Income and Poverty Estimates (SAIPE)
The SAIPE program was developed in the 1990s in order to provide state and local government
officials with poverty estimates for local areas in between the decennial census years. In the Improving America'’s Schools Act of 1994 (IASA, P.L. 103-382), which amended the Elementary and Secondary Education Act of 1965 (ESEA), Congress recognized that providing funding for children in disadvantaged communities created a need for poverty data for those communities that were more current than the once-a-decade census. In the IASA, Congress provided for the
development and evaluation of the SAIPE program for its use in Title I-A funding allocations.18
al ocations.20
SAIPE estimates are model-based, meaning they use a mathematical procedure to compute estimates using both survey data (ACS one-year data) and administrative data (from tax returns
and numbers of participants in the Supplemental Nutrition Assistance Program, or SNAP). The modeling procedure produces estimates with less variability than estimates computed from survey
data alone, especiallyespecial y for counties with small populations.
smal populations.
Guidance from the U.S. Census Bureau, " “Which Data Source to Use"19
The CPS ASEC20”21
The CPS ASEC22 provides the most timely and accurate national data on income and is the source of official national poverty estimates, hence it is the preferred source for national analysis. Because of its large sample size, the ACS is preferred for subnational data on income and poverty by detailed demographic characteristics. The Census income and poverty by detailed demographic characteristics. The Census Bureau recommends using the ACS for 1-year estimates of income and poverty at the state level. Users looking for consistent, state-level trends should use CPS ASEC 2-year averages and CPS ASEC 3-year averages for state to state comparisons.
For substate areas, like counties, users should consider their specific needs when picking the appropriate data source. The SAIPE program produces overall poverty and household income 1-year estimates with standard errors usually smaller than direct survey estimates. Users looking to compare estimates of the number and percentage of people in poverty for counties or school districts or the median household income for counties should use SAIPE, especially if the population is less than 65,000. Users who need other characteristics such as poverty among Hispanics or median earnings, should use the ACS, where and when available.
The SIPP21
20 Details about the origins of the SAIPE project are available on the Census Bureau’s website at https://www.census.gov/programs-surveys/saipe/about/origins.html.
21 Downloaded from http://www.census.gov/topics/income-poverty/poverty/guidance/data-sources.html, November 29, 2016.
22 Author’s note: CPS ASEC: Current Population Survey Annual Social and Economic Supplement.
Congressional Research Service
24
link to page 30 link to page 30 link to page 30 The 10-20-30 Provision: Defining Persistent Poverty Counties
The SIPP23 is the only Census Bureau source of longitudinal poverty data. As SIPP collects monthly income over 2.5 to 5 year panels, it is also a source of poverty estimates for time periods more or less than one year, including monthly poverty rates.
Table A-1 below reproduces the Census Bureau'’s recommendations, summarized for various
geographic levels:
Table A-1. U.S. Census Bureau'’s Guidance on Poverty Data Sources by Geographic
Level and Type of Estimate
Cross-Sectional Estimates
Geographic
Detailed
Longitudinal
Level
Income/Poverty Rate
Characteristics
Year-to-Year Change
Estimates
CPS ASEC/
United States
CPS ASEC
ACS 1-year estimates for CPS ASEC
SIPP
detailed race groups
ACS 1-year estimates
States
CPS ASEC 3-year
ACS 1-year estimates
ACS 1-year estimates
averages
Substate (areas ACS 1-year estimates/
with populations
ACS 1-year estimates /
of 65,000 or
SAIPE for counties and ACS 1-year estimates
SAIPE for counties and
None
school districts
more)
school districts
SAIPE for counties and
school districts/
SAIPE for counties and
Substate (areas
ACS 5-year estimates/
school districts/
with populations ACS using 5-year period less than
estimates for al other
Decennial Census 2000
ACS using 5-year period None
geographic entities/
20,000)a
and prior
estimates for al other
Decennial Census 2000
geographic entitiesb
and prior
State-to-Nation
comparison
CPS ASEC
CPS ASEC
CPS ASEC
Source: Congressional Research Service Level and Type of Estimate
|
Cross-Sectional Estimates |
||||
|
Geographic Level |
Income/Poverty Rate |
Detailed Characteristics |
Year-to-Year Change |
Longitudinal Estimates |
|
United States |
CPS ASEC |
CPS ASEC/ ACS 1-year estimates for detailed race groups |
CPS ASEC |
SIPP |
|
States |
ACS 1-year estimates CPS ASEC 3-year averages |
ACS 1-year estimates |
ACS 1-year estimates |
|
|
Substate (areas with populations of 65,000 or more) |
ACS 1-year estimates/ SAIPE for counties and school districts |
ACS 1-year estimates |
ACS 1-year estimates / SAIPE for counties and school districts |
None |
|
SAIPE for counties and school districts/ ACS using 5-year period estimates for all other geographic entities/ Decennial Census 2000 and prior |
ACS 5-year estimates/ Decennial Census 2000 and prior |
SAIPE for counties and school districts/
|
None |
|
State-to-Nation comparison |
CPS ASEC |
CPS ASEC |
CPS ASEC |
|
Source: Congressional Research Service (CRS) formatted reproduction of table by U.S. Census Bureau, with an expansion to the notes. Original table downloaded from http://www.census.gov/topics/income-poverty/poverty/guidance/data-sources.html, January 16, 2020.
Notes:
ACS: American Community Survey.
CPS ASEC: Current Population Survey, Annual Social and Economic Supplement.
SAIPE: Small Smal Area Income and Poverty Estimates.
SIPP: Survey of Income and Program Participation.
a. a. Author'’s note:: Data for areas with populations of 20,000 to 65,000 persons previously had been produced
using ACS three-year estimates, but are now only produced using the ACS five-year estimates. ACS three-year estimates are no longer produced (with 2011-2013 data as the last in the series). For details, see https://www.census.gov/programs-surveys/acs/guidance/estimates.html.
b. .
b. Use non-overlapping periods for ACS trend analysis with multiyear estimates. For example, comparing
2006-2010 ACS five-year estimates with 2011-2015 ACS five-year estimates is preferred for identifying change.
23 Author’s note: SIPP: Survey of Income and Program Participation; mentioned here only as part of a quotation.
Congressional Research Service
25
The 10-20-30 Provision: Defining Persistent Poverty Counties
Author Information
Joseph Dalaker
Analyst in Social Policy
Acknowledgments
The author is grateful for the assistance of Sarah Caldwell, CRS Senior Research Librarian, for assistance with legislative research, and Calvin DeSouza, CRS GIS Analyst, in creating the county map.
Disclaimer
This document was prepared by the Congressional Research Service (CRS). CRS serves as nonpartisan shared staff to congressional committees and Members of Congress. It operates solely at the behest of and under the direction of Congress. Information in a CRS Report should n ot be relied upon for purposes other than public understanding of information that has been provided by CRS to Members of Congress in
connection with CRS’s institutional role. CRS Reports, as a work of the United States Government, are not subject to copyright protection in the United States. Any CRS Report may be reproduced and distributed in its entirety without permission from CRS. However, as a CRS Report may include copyrighted images or material from a third party, you may need to obtain the permission of the copyright holder if you wish to copy or otherwise use copyrighted material.
Congressional Research Service
R45100 · VERSION 10 · UPDATED
26 change.
Author Contact Information
Acknowledgments
The author is grateful for the assistance of Sarah Caldwell, CRS Senior Research Librarian, for assistance with legislative research, and Calvin DeSouza, CRS GIS Analyst, and Mari Lee, CRS Visual Information Specialist, in creating the county map.
Footnotes
| 1. |
While the 1980-2000 period is actually 20 years, local communities have traditionally relied upon the decennial census data for small areas up to 10 years after their publication, hence the reference to "30 years." However, since the late 1990s newer data sources have become available for small communities at intervals shorter than 10 years, which has implications that will be discussed in this report. |
| 2. |
In the 116th Congress, the Consolidated Appropriations Act, 2019 (P.L. 116-6) included 10-20-30 language in numerous sections: Section 752, in reference to loans and grants for rural housing, business and economic development, and utilities; Section 539, in reference to grants authorized by the Public Works and Economic Development Act of 1965 and grants authorized by Section 27 of the Stevenson-Wydler Technology Innovation Act of 1980; Division D, Title I, in reference to the Community Development Financial Institutions (CDFI) Fund Program Account; and Division E, Title II, in reference to the Comprehensive Environmental Response, Compensation, and Liability Act (CERCLA) of 1980 and its role in authorizing funding for brownfields site assessment and remediation. The sections varied in the data sources used to define "persistent poverty counties," which means the sections varied in the lists of counties targeted for the funding set-aside. These same programs, with the addition of Transit Infrastructure Grants, were included in two appropriations acts for FY2020: the Consolidated Appropriations Act, 2020 (P.L. 116-93; public works grants in Division B, Title V, Section 533, and CDFI in Division C, Title I), and the Further Consolidation Appropriations Act, 2020 (P.L. 116-94; rural programs in Division B, Title VII, Section 740; CERCLA in Division D, Title II; and Transit Infrastructure Grants in Division H, Title I). Additionally, the following bills referencing 10-20-30 had been introduced but not enacted into public law at the time of this report's release: H.R. 2055 and S. 1066 (An Act Targeting Resources to Communities in Need). Persistent poverty counties were referenced in the following bills, using policy tools other than the 10-20-30 provision: H.R. 3538 and S. 2028 (Rural Jobs Act), H.R. 186 and S. 2100 (Veterans Jobs Opportunity Act), H.R. 4808 and S. 2684 (Housing, Opportunity, Mobility, and Equity Act of 2019), H.R. 5495 (Federal Electronic Equipment Donation Act of 2019), and H.R. 2228 (to offer persistent poverty counties and political subdivisions of such counties the opportunity to have their rural development loans restructured). |
| 3. |
For instance, George Galster of Wayne State University conducted a literature review that suggested "that the independent impacts of neighborhood poverty rates in encouraging negative outcomes for individuals like crime, school leaving, and duration of poverty spells appear to be nil unless the neighborhood exceeds about 20 percent poverty." Galster distinguishes the effects of living in a poor neighborhood from the effects of being poor oneself but not necessarily in a poor neighborhood. Cited in George C. Galster, "The Mechanism(s) of Neighborhood Effects: Theory, Evidence, and Policy Implications," presented at the Economic and Social Research Council Seminar, "Neighbourhood Effects: Theory & Evidence," St. Andrews University, Scotland, UK, February 2010. Additionally, the Census Bureau has published a series of reports examining local areas (census tracts) with poverty rates of 20% or greater. See, for instance, Alemayehu Bishaw, "Changes in Areas With Concentrated Poverty: 2000 to 2010," U.S. Census Bureau, American Community Survey Reports ACS-27, June 2014; and Leatha Lamison-White, "Poverty Areas," U.S. Census Bureau Statistical Brief, June 1995. |
| 4. |
The effects of poverty rates on property values are explored by George C. Galster, Jackie M. Cutsinger, and Ron Malega in "The Costs of Concentrated Poverty: Neighborhood Property Markets and the Dynamics of Decline," pp. 93-113 in N. Retsinas and E. Belsky, eds., Revisiting Rental Housing: Policies, Programs, and Priorities (Washington, DC: Brookings Institution Press, 2008). They indicate that "the relationship between changes in a neighborhood's poverty rate and maintenance choices by local residential property owners will be lumpy and non-linear. Substantial variations in poverty rates in the low-moderate range yield no deviations in the owner's decision to highly maintain the building.... Past some percentage of poverty, however, the owner will switch to an undermaintenance mode whereby net depreciation will occur." |
| 5. |
See, for instance, a 2008 report issued jointly by the Federal Reserve System and the Brookings Institution, "The Enduring Challenge of Concentrated Poverty in America: Case Studies from Communities Across the U.S.," David Erickson et al., eds., 2008. Additional research into concentrated poverty in both rural and urban areas has been undertaken for decades; for example, educational attainment and health disability were discussed in a rural context by Calvin Beale in "Income and Poverty," chapter 11 in Glenn V. Fuguitt, David L. Brown, and Calvin L. Beale, eds., Rural and Small Town America, Russell Sage Foundation, 1988. |
| 6. |
In the 116th Congress, P.L. 116-6 (Consolidated Appropriations Act, 2019), P.L. 116-93 (Consolidated Appropriations Act, 2020), and P.L. 116-94 (Further Consolidated Appropriations Act, 2020) used the 10-20-30 provision; see footnote 2 for details. Of the public laws passed by the 115th Congress, 10-20-30 language was included in P.L. 115-31 (Consolidated Appropriations Act, 2017), P.L. 115-141 (Consolidated Appropriations Act, 2018), and P.L. 115-334 (Agricultural Improvement Act of 2018). Multiple other bills were introduced but not enacted into public law. In the 114th Congress, no bills containing 10-20-30 language were enacted into public law, but 10-20-30 language was included in H.R. 1360 (America's FOCUS Act of 2015), H.R. 5393 (Commerce, Justice, Science, and Related Agencies Appropriations Act, 2017), H.R. 5054 (Agriculture, Rural Development, Food and Drug Administration, and Related Agencies Appropriations Act, 2017), H.R. 5538 (Department of the Interior, Environment, and Related Agencies Appropriations Act, 2017), and S. 3067 and H.R. 5485 (Financial Services and General Government Appropriations Act, 2017). However, the Consolidated Appropriations Acts for 2017, 2018, and 2019 used language analogous to the bills introduced in the 114th Congress, with some modification. Additionally, in the 113th Congress, H.R. 5571 (The 10-20-30 Act of 2014) was introduced and referred to committee but not passed. |
| 7. |
There are two definitions of poverty used in the United States: one for statistical purposes, which is used by the Census Bureau and described in Statistical Policy Directive 14 by the Office of Management and Budget; and the other for administrative purposes, which is used by the Department of Health and Human Services and is referred to in the Omnibus Budget Reconciliation Act of 1981. Measuring the poverty rates of counties, which are in turn used in the 10-20-30 plan, is a statistical use of poverty data; thus, the statistical definition of poverty (used by the Census Bureau) applies. |
| 8. |
For further details about the official definition of poverty, see CRS Report R44780, An Introduction to Poverty Measurement, by Joseph Dalaker. |
| 9. |
Poverty rates are computed using adjusted population totals because there are some individuals whose poverty status is not determined. These include unrelated individuals under age 15, such as foster children, who are not asked income questions and who are not related to anyone else in their residence by birth, marriage, or adoption; persons living in military barracks; and persons in institutions such as nursing homes or prisons. Some surveys (such as those described in this report) do not compute poverty status for persons living in college dormitories. These persons are excluded from the total population when computing poverty rates. Furthermore, people who have no traditional housing and who do not live in shelters are typically not sampled in household surveys. |
| 10. |
The decennial census still collects income information in American Samoa, the Commonwealth of the Northern Mariana Islands, Guam, and the U.S. Virgin Islands. Neither the ACS nor the SAIPE program is conducted for these island areas; decennial census data are the only small-area poverty data available for them. The 2020 Census questionnaire for these island areas are to cover the same topics as the ACS; see the Island Areas Censuses Operation Detailed Operational Plan at https://www.census.gov/programs-surveys/decennial-census/2020-census/planning-management/planning-docs/IAC-detailed-op-plan.html. For Puerto Rico, ACS estimates are still produced, but SAIPE estimates stopped being produced after 2003. For details see https://www.census.gov/programs-surveys/saipe/technical-documentation/methodology/puerto-rico.html. |
| 11. |
|
| 12. |
SAIPE county-level estimates are available for the poverty status of the total population, persons under age 18, and related children ages 5 to 17 living in families, and for median household income. |
| 13. |
Details on the poverty universe in the ACS are available at https://www2.census.gov/programs-surveys/acs/tech_docs/subject_definitions/2018_ACSSubjectDefinitions.pdf?#page=107 and for the SAIPE estimates at https://www.census.gov/programs-surveys/saipe/guidance/model-input-data/denominators/poverty.html. |
| 14. |
For some counties, the percentage-point difference could be large when off-campus students are excluded. Using ACS data for 2009-2011, Whitman County, WA, experienced the largest poverty rate difference among all counties when off-campus students were excluded—its poverty rate fell by 16.5 percentage points. For the United States as a whole, the poverty rate fell from 15.2% to 14.5% when off-campus students were excluded (based on the same dataset). For details, see Alemayehu Bishaw, "Examining the Effect of Off-Campus College Students on Poverty Rates," Working Paper SEHSD 2013-17, U.S. Census Bureau, May 1, 2013. |
| 15. |
P.L. 111-5, Section 105. |
| 16. |
Poverty estimates from the decennial census continue to be produced for American Samoa, the Commonwealth of the Northern Mariana Islands, Guam, and the U.S. Virgin Islands. SAIPE and ACS estimates are not. See footnote 10. |
| 17. |
|
| 18. |
Details about the origins of the SAIPE project are available on the Census Bureau's website at https://www.census.gov/programs-surveys/saipe/about/origins.html. |
| 19. |
Downloaded from http://www.census.gov/topics/income-poverty/poverty/guidance/data-sources.html, November 29, 2016. |
| 20. |
Author's note: CPS ASEC: Current Population Survey Annual Social and Economic Supplement. |
| 21. |
Author's note: SIPP: Survey of Income and Program Participation; mentioned here only as part of a quotation. |