The Temporary Assistance for Needy Families (TANF) Block Grant: Responses to Frequently Asked Questions
Changes from December 30, 2019 to July 16, 2020
This page shows textual changes in the document between the two versions indicated in the dates above. Textual matter removed in the later version is indicated with red strikethrough and textual matter added in the later version is indicated with blue.
The Temporary Assistance for Needy Families (TANF) Block Grant: Responses to Frequently Asked Questions
Contents
- Introduction
- Funding and Expenditures
- What Is TANF's Funding Status?
- How Are State TANF Programs Funded?
- How Much Has the Value of the TANF Basic Block Grant Changed Over Time?
- How Have States Used TANF Funds?
- How Much of the TANF Grant Has Gone Unspent?
- The Caseload
- How Many Families Receive TANF- or MOE-Funded Benefits and Services?
- How Many Families and People Currently Receive TANF- or MOE-Funded "Assistance"?
- How Does the Current Assistance Caseload Level Compare with Historical Levels?
- What Are the Characteristics of Families Receiving TANF Assistance?
- TANF Cash Benefits: How Much Does a Family Receive in TANF Cash Per Month?
- TANF Work Participation Standards
- What Is the TANF Work Participation Standard States Must Meet?
- Have There Been Changes in the Work Participation Rules Enacted Since the 1996 Welfare Reform Law?
- What Work Participation Rates Have the States Achieved?
- How Many Jurisdictions Did Not Meet the All-Families Standard?
- Have States Met the Two-Parent Work Participation Standard?
Figures
- Figure 1. Uses of TANF Funds by Spending Category, FY2018
- Figure 2. Number of Families Receiving Cash Assistance, July 1959-September 2018
- Figure 3. Characteristics of Assistance Families, Selected Years FY1988 to FY2017
- Figure 4. TANF Cash Assistance Maximum Monthly Benefit Amounts for a Single Parent Family with Two Children, 50 States and the District of Columbia, July 2018
- Figure 5. National Average TANF Work Participation Rate for All Families, FY2002-FY2018
- Figure 6.States That Met or Did Not Meet the TANF All-Families Work Participation Standard: FY2006-FY2018
- Figure 7.Two-Parent TANF Work Participation Standard, Status by State: FY2006-FY2018
Tables
- Table 1. TANF Basic Block Grant Funding in Nominal and Constant Dollars
- Table 2. TANF Assistance Caseload: September 2018
- Table A-1. Trends in the Cash Assistance Caseload: 1961-2018
- Table A-2. Families Receiving AFDC/TANF Assistance by Family Category, Selected Years, FY1988-FY2017
- Table B-1. Use of FY2018 TANF and MOE Funds by Category
- Table B-2. Uses of FY2018 TANF and MOE Funds by Category as a Percentage of Total Federal TANF and State MOE Spending
- Table B-3. Unspent TANF Funds at the End of FY2018
- Table B-4. Number of Families, Recipients, Children, and Adults Receiving TANF Assistance by State, September 2018
- Table B-5. Number of Needy Families with Children Receiving Assistance by State, September of Selected Years
- Table B-6. TANF Assistance Families by Number of Parents by State: September 2018
Summary
The Temporary Assistance for
July 16, 2020
Needy Families (TANF) Block Grant:
Gene Falk
Responses to Frequently Asked Questions
Specialist in Social Policy
The Temporary Assistance for Needy Families (TANF) block grant funds a wide range of
Patrick A. Landers
benefits and services for low-income families with children. TANF was created in the Personal
Analyst in Social Policy
Responsibility and Work Opportunity Act of 1996 (P.L. 104-193). ). This report responds to some
frequently asked questions about TANF; it does not describe TANF rules (see, instead, CRS Report RL32748, The Temporary Assistance for Needy Families (TANF) Block Grant: A Primer
For a copy of the ful report,
on TANF Financing and Federal Requirements, by Gene Falk).
please cal 7-5700 or visit www.crs.gov.
TANF Funding and Expenditures. TANF provides fixed funding for the 50 states, the District of Columbia, the territories, and American Indian tribes. The basic block grant totals $16.5 billion per year. States are also als o required in total to contribute, from their own funds, at least $10.3 billion annually under a maintenance -of-effort (MOE) requirement.
The basic block grant is not adjusted for changes in circumstances (e.g., inflation, population) over time. In FY2019, the TANF basic block grant was 37% below what its value (adjusting for inflation) was in FY1997. Though TANF is best known for funding assistance payments for needy families with children, the block grant and MOE funds are used for a wide variety of benefits and activities. In FY2018, expenditures on assistance totaled $6.7 billion—21% of total federal TANF and MOE dollars. Assistance is often—but not exclusively—paid as cash. In addition to funding basic assistance, TANF also contributes funds for child care, employment services (for both assistance recipients and others), state refundable tax credits for low income families, pre-Kindergarten and Head Start programs, and services for children who have been, or are at risk of being, abused and neglected. Some states also count expenditures in prekindergarten programs toward the MOE requirement.
The TANF Assistance Caseload. A total of 1.21 million families, composed of 3.12.9 million recipients, received TANF- or MOE-funded assistance in September 2018.2019 (as of June 2020, the latest data available) The bulk of the "recipients"“recipients” were children—2.31 million in that month. The assistance caseload is heterogeneous. The type of family once thought of as the "typical"
“typical” assistance family—one with an unemployed adult recipient—accounted for 3132% of all families on the rolls in FY2017. FY2018. Additionally, 3127% of cash assistance families had an employed adult, while 3841% of all TANF families were "“child-only"only” and had no adult recipient. Child-only families include those with disabled adults receiving Supplemental Security Income (SSI), adults who are nonparents (e.g., grandparents, aunts, uncles) caring for children, and families consisting of citizen children and ineligible noncitizen parents.
Assistance Benefits. TANF assistance benefit amounts are set by states. In July 2018, the maximum monthly benefit for a family of three ranged from $1,039 in New Hampshire to $170 in Mississippi. Only New Hampshire (at 60% of the federal poverty guidelines) had a maximum TANF assistance amount for this sized family in excess of 50% of poverty-level income.
Work Requirements. TANF'’s main federal work requirement is actually a performance measure that applies to the states. States determine the work rules that apply to individual recipients. TANF law requires states to engage 50% of all families and 90% of two-parent families with work-eligible individuals in work activities, though these standards can be reduced by "
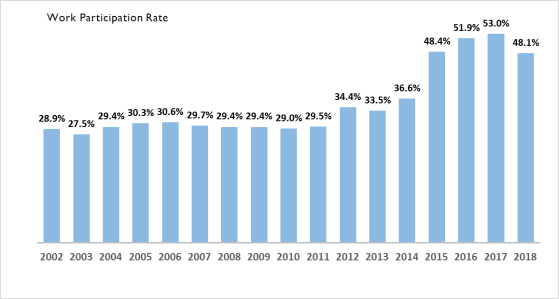
“credits."” Therefore, the effective standards states face are often less than the 50% or 90% targets, and vary by state. In FY2018, states achieved, on average, an all-family participation rate of 48.1% and a two-parent rate of 57.9%. In FY2018, only Montana did not meet the all-family participation standard. This is a reduction from FY2012, when 16 states did not meet that standard. In FY2018, seven jurisdictions did not meet the two-parent standard. States that do not meet work standards are at risk of being penalized by a reduction in their block grant.
Introduction
Congressional Research Service
link to page 5 link to page 5 link to page 5 link to page 5 link to page 5 link to page 6 link to page 7 link to page 8 link to page 8 link to page 8 link to page 8 link to page 9 link to page 10 link to page 11 link to page 12 link to page 12 link to page 13 link to page 13 link to page 13 link to page 14 link to page 16 link to page 7 link to page 9 link to page 11 link to page 12 link to page 12 link to page 14 link to page 14 link to page 15 link to page 15 link to page 17 link to page 17 link to page 6 link to page 8 link to page 18 The Temporary Assistance for Needy Families (TANF) Block Grant: FAQs
Contents
Introduction ................................................................................................................... 1 Funding and Expenditures ................................................................................................ 1
What Is TANF’s Funding Status? ................................................................................. 1 How Are State TANF Programs Funded? ...................................................................... 1 How Much Has the Value of the TANF Basic Block Grant Changed Over Time?................. 1 How Have States Used TANF Funds? ........................................................................... 2 How Much of the TANF Grant Has Gone Unspent? ........................................................ 3
The Caseload.................................................................................................................. 4
How Many Families Receive TANF- or MOE-Funded Benefits and Services? .................... 4 How Many Families and People Currently Receive TANF- or MOE-Funded
Assistance? ............................................................................................................ 4
How Does the Current Assistance Caseload Level Compare with Historical Levels? ............ 5 What Are the Characteristics of Families Receiving TANF Assistance?.............................. 6
TANF Cash Benefits: How Much Does a Family Receive in TANF Cash Per Month?................ 7 TANF Work Participation Standards .................................................................................. 8
What Is the TANF Work Participation Standard States Must Meet? ................................... 8 Have There Been Changes in the Work Participation Rules Enacted Since the 1996
Welfare Reform Law?.............................................................................................. 9
What Work Participation Rates Have the States Achieved?............................................... 9 How Many Jurisdictions Did Not Meet the All-Families Standard? ................................. 10 Have Jurisdictions Met the Two-Parent Work Participation Standard? .............................. 12
Figures Figure 1. Uses of TANF Funds by Spending Category, FY2018.............................................. 3 Figure 2. Number of Families Receiving Cash Assistance, July 1959-September 2019 ............... 5 Figure 3. Characteristics of Assistance Families, Selected Years FY1988 to FY2018 ................. 7 Figure 4. TANF Cash Assistance Maximum Monthly Benefit Amounts for a Single-
Parent Family with Two Children, 50 States and the District of Columbia, July 2018 .............. 8
Figure 5. National Average TANF Work Participation Rate for Al Families,
FY2002-FY2018 ........................................................................................................ 10
Figure 6. Jurisdictions That Met or Did Not Meet the TANF Al -Families Work
Participation Standard: FY2006-FY2018 ....................................................................... 11
Figure 7.Two-Parent TANF Work Participation Standard, Status by State: FY2006-
FY2018 .................................................................................................................... 13
Tables
Table 1. TANF Basic Block Grant Funding in Nominal and Constant Dollars ........................... 2 Table 2. TANF Assistance Caseload: September 2019 ........................................................... 4
Table A-1. Trends in the Cash Assistance Caseload: 1961-2018 ............................................ 14
Congressional Research Service
link to page 20 link to page 20 link to page 21 link to page 24 link to page 24 link to page 27 link to page 28 link to page 28 link to page 30 link to page 30 link to page 32 link to page 32 link to page 18 link to page 21 link to page 34 The Temporary Assistance for Needy Families (TANF) Block Grant: FAQs
Table A-2. Families Receiving AFDC/TANF Assistance by Family Category, Selected
Years, FY1988-FY2018............................................................................................... 16
Table B-1. Use of FY2018 TANF and MOE Funds by Category ........................................... 17 Table B-2. Uses of FY2018 TANF and MOE Funds by Category as a Percentage of Total
Federal TANF and State MOE Spending ........................................................................ 20
Table B-3. Unspent TANF Funds at the End of FY2018 ...................................................... 23 Table B-4. Number of Families, Recipients, Children, and Adults Receiving TANF
Assistance by Jurisdiction, September 2019.................................................................... 24
Table B-5. Number of Needy Families with Children Receiving Assistance
by Jurisdiction, September of Selected Years .................................................................. 26
Table B-6. TANF Assistance Families by Number of Parents by Jurisdiction:
September 2019 ......................................................................................................... 28
Appendixes Appendix A. Supplementary Tables ................................................................................. 14 Appendix B. State Tables ............................................................................................... 17
Contacts
Author Information ....................................................................................................... 30
Congressional Research Service
link to page 18 link to page 21 link to page 6 The Temporary Assistance for Needy Families (TANF) Block Grant: FAQs
Introduction This report provides responses to frequently asked questions about the Temporary Assistance for Needy Families (TANF) block grant. It is intended to serve as a quick reference to provide easy access to information and data. Appendix A provides additional data on families receiving TANF assistance over time. Appendix B presents a series of tables with state-level data. on TANF
expenditures and families receiving assistance.
This report does not provide information on TANF program rules (for a discussion of TANF rules, see CRS Report RL32748, The Temporary Assistance for Needy Families (TANF) Block
Grant: A Primer on TANF Financing and Federal Requirements, by Gene Falk).
Funding and Expenditures
What Is TANF'’s Funding Status? The Coronavirus Aid, Relief, and Economic Security Act (CARES Act; P.L. 116-136) funds
TANF through November 30, 2020.
s Funding Status?
P.L. 116-94, the Further Consolidated Appropriations Act, 2020, extends TANF funding through May 22, 2020.1
How Are State TANF Programs Funded?
TANF programs are funded through a combination of federal and state funds. In FY2018, TANF
has two federal grants to states. The bulk of the TANF funding is in a basic block grant to the states, totaling $16.5 billion bil ion for the 50 states, the District of Columbia, Puerto Rico, Guam, the Virgin Islands, and American Indian tribes. There is also a contingency fund available that
provides extra federal funds to states that meet certain conditions.
Additionally,
Additional y, states are required to expend a minimum amount of their own funds for TANF and TANF-related activities under what is known as the maintenance of effort (MOE) requirement. States are required to spend at least 75% of what they spent in FY1994 on TANF'’s predecessor programs. The minimum MOE amount, in total, is $10.3 billion bil ion per year for the 50 states, the
District of Columbia, and the territories.
How Much Has the Value of the TANF Basic Block Grant Changed Over Time?
TANF was created in the 1996 welfare reform law, the Personal Responsibility and Work Opportunity Reconciliation Act of 1996 (PRWORA, P.L. 104-193). A TANF basic block grant
amount—both nationallynational y and for each state—was established in the 1996 welfare reform law. The amount established in that law for the 50 states, District of Columbia, territories, and tribes was $16.6 billion bil ion in total. From FY1997 through FY2016, that amount remained the same. It was not adjusted for changes that occur over time, such as inflation, the size of the TANF assistance caseload, or changes in the poverty population. During this period, the real (inflation-adjusted) value of the block grant declined by one-third (33.1%). Beginning with FY2017, the state family
assistance grant was reduced by 0.33% from its historical levels to finance TANF-related research
and technical assistance. The reduced block grant amount is $16.5 billion.
bil ion.
Table 1 shows the state family assistance grant, in both nominal (actual) and real (inflation-adjusted) dollars for each year, FY1997 through FY2018FY2019. In real (inflation-adjusted) terms, the FY2018
FY2019 block grant was 3637% below its value in FY1997.
Congressional Research Service
1
The Temporary Assistance for Needy Families (TANF) Block Grant: FAQs
Table 1. TANF Basic Block Grant Funding in Nominal and Constant Dollars
(In bil ions of $)
Cumulative Change in
State Family Assistance State Family Assistance
the Purchasing Power of
Grant (50 states, DC,
Grant in FY1997
the State Family
Fiscal Year
territories, and tribes)
Dollars
Assistance Grant
1997
$16.567
$16.567
1998
16.567
16.300
-1.6%
1999
16.567
15.993
-3.5
2000
16.567
15.501
-6.4
2001
16.567
15.017
-9.4
2002
16.567
14.796
-10.7
2003
16.567
14.456
-12.7
2004
16.567
14.128
-14.7
2005
16.567
13.679
-17.4
2006
16.567
13.193
-20.4
2007
16.567
12.891
-22.2
2008
16.567
12.342
-25.5
2009
16.567
12.382
-25.3
2010
16.567
12.177
-26.5
2011
16.567
11.862
-28.4
2012
16.567
11.583
-30.1
2013
16.567
11.397
-31.2
2014
16.567
11.215
-32.3
2015
16.567
11.181
-32.5
2016
16.567
11.078
-33.1
2017
16.512
10.819
-34.7
2018
16.512
10.563
-36.2
2019
16.512
10.371
-37.4
Source: Congressional Research Service (CRS), based on data from the U.S. Department of Health and Human Services % below its value in FY1997.
|
Fiscal Year |
State Family Assistance Grant: 50 States, DC, Tribes, and Territories |
State Family Assistance Grant Constant 1997 Dollars |
Cumulative Percentage Change (constant dollars) |
|
1997 |
$16.567 |
$16.567 |
|
|
1998 |
16.567 |
16.306 |
-1.6% |
|
1999 |
16.567 |
15.991 |
-3.5 |
|
2000 |
16.567 |
15.498 |
-6.5 |
|
2001 |
16.567 |
15.020 |
-9.3 |
|
2002 |
16.567 |
14.792 |
-10.7 |
|
2003 |
16.567 |
14.456 |
-12.7 |
|
2004 |
16.567 |
14.124 |
-14.7 |
|
2005 |
16.567 |
13.680 |
-17.4 |
|
2006 |
16.567 |
13.190 |
-20.4 |
|
2007 |
16.567 |
12.893 |
-22.2 |
|
2008 |
16.567 |
12.345 |
-25.5 |
|
2009 |
16.567 |
12.382 |
-25.3 |
|
2010 |
16.567 |
12.182 |
-26.5 |
|
2011 |
16.567 |
11.859 |
-28.4 |
|
2012 |
16.567 |
11.585 |
-30.1 |
|
2013 |
16.567 |
11.394 |
-31.2 |
|
2014 |
16.567 |
11.217 |
-32.3 |
|
2015 |
16.567 |
11.179 |
-32.5 |
|
2016 |
16.567 |
11.082 |
-33.1 |
|
2017 |
16.512 |
10.820 |
-34.7 |
|
2018 |
16.512 |
10.564 |
-36.2 |
Source: Congressional Research Service (CRS) based on data from the U.S. Department of Health and Human Services (HHS), and the U.S. Department of Labor, Bureau of Labor Statistics (BLS).
Notes: Constant dollars (HHS), and the U.S. Department of Labor, Bureau of Labor Statistics (BLS). Notes: Constant dol ars were computed using the Consumer Price Index for all al Urban Consumers (CPI -U).
-U).
How Have States Used TANF Funds?
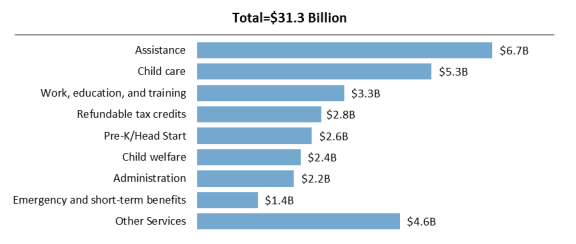
In FY2018, a total of $31.3 billion bil ion of both federal TANF and state MOE expenditures were either expended or transferred to other block grant programs. Assistance—ongoing benefits to families to meet basic needs—represented 21% ($6.7 billionbil ion) of total FY2018 TANF and MOE dollars.
TANF is a major contributor of child care funding. In FY2018, $5.3 billionbil ion (17% of all al TANF and MOE funds) were either expended on child care or transferred to the child care block grant (the
Congressional Research Service
2
link to page 7 link to page 21 link to page 24 link to page 27
The Temporary Assistance for Needy Families (TANF) Block Grant: FAQs
Child Care and Development Fund, or CCDF). TANF work-related activities (including education and training) were the third-largest TANF and MOE spending category at $3.3 billionbil ion, or 11% of total TANF and MOE funds. TANF also helps low-wage parents by helping to finance state refundable tax credits, such as state add-ons to the Earned Income Tax Credit (EITC). TANF and MOE expenditures on refundable tax credits in FY2018 totaled $2.8 billionbil ion, or 9% of total TANF and MOE spending.
TANF and MOE funds also help fund state prekindergarten (pre-K) programs, with total FY2018 expenditures for that category at $2.6 bil ion. TANF is also a major contributor to the child welfare system, which provides foster care, adoption assistance, and services to families with children who either have experienced or are at risk of experiencing child abuse or neglect, spending about $2.4 billion bil ion on such activities. TANF and MOE funds also help fund state prekindergarten (pre-K) programs, with total FY2018 expenditures for that category at $2.6 billion. TANF and MOE funds are also used for short-term
and emergency benefits and a wide range of other social services. Figure 1 shows the uses of federal TANF grants to states and state MOE funds in FY2018.
For state-specific information on the use of TANF funds, seesee Table B-1 andand Table B-2.
How Much of the TANF Grant Has Gone Unspent?
TANF law permits states to "reserve"“reserve” unused funds without time limit. This permits flexibility in timing of the use of TANF funds, including the ability to "save" to “save” funds for unexpected
occurrences that might increase costs (such as recessions or natural disasters).
At the end of FY2018 (September 30, 2018, the most recent data currently available), a total of $5.1 bil ion $5.1 billion of federal TANF funding remained neither transferred nor spent. However, some of these unspent funds represent monies that states had already committed to spend later. At the end of FY2018, states had made such commitments to spend—that is, had obligated—a total of $1.4 billionbil ion. At the end of FY2018, states had $3.7 billion of "bil ion of “unobligated balances."” These funds are available
available to states to make new spending commitments. Table B-3 shows unspent TANF funds by state.
by state.
Congressional Research Service
3
link to page 8 link to page 28 The Temporary Assistance for Needy Families (TANF) Block Grant: FAQs
The Caseload
The Caseload
How Many Families Receive TANF- or MOE-Funded Benefits and Services?
This number is not known. Federal TANF reporting requirements focus on families receiving
only ongoing assistanceassistance. There is no complete reporting on families receiving other TANF
benefits and services.
Assistance
“Assistance” is defined as benefits provided to families to meet ongoing, basic needs.21 It is most
often paid in cash. However, some states use TANF or MOE funds to provide an "“earnings supplement"supplement” to working parents added to monthly Supplemental Nutrition Assistance Program (SNAP) allotmentsal otments. These "earnings supplements" are paid separately from the regular TANF cash assistance program. AdditionallyAdditional y, TANF MOE dollars are used to fund food assistance for immigrants barred from regular SNAP benefits in certain states. These forms of nutrition aid meet
an ongoing need, and thus are considered TANF assistance.
As discussed in a previous section of this report, TANF basic assistance accounts for about 24% of all 21%
of al TANF expenditures. Therefore, the federal reporting requirements that pertain to families receiving "assistance"assistance are likely to undercount the number of families receiving any TANF-funded
benefit or service.
How Many Families and People Currently Receive TANF- or MOE-Funded Assistance? Funded "Assistance"?
Table 2 provides assistance caseload information. A total of 1.2 million1 mil ion families, composed of 3.1 million 2.9
mil ion recipients, received TANF- or MOE-funded assistance in September 20182019 (as of June 2020, the latest data available). The bulk of the "recipients"“recipients” were children—2.3 million1 mil ion in that
month. For state-by-state assistance caseloads, seesee Table B-4.
Table 2. TANF Assistance Caseload: September 2019
Families
1,090,066
Recipients
2,863,340
Child Recipients
2,106,950
Adult Recipients
756,390
Source: Congressional Research Service (CRS), based on data from the U.S. Department of Health and Human Services (HHS). Notes: TANF cash assistance caseload includes families receiving Table 2. TANF Assistance Caseload: September 2018
|
Families |
1,175,335 |
|
Recipients |
3,104,094 |
|
Child Recipients |
2,280,173 |
|
Adult Recipients |
823,921 |
Source: Congressional Research Service (CRS) based on data from the U.S. Department of Health and Human Services (HHS).
Notes: TANF cash assistance caseload includes families receiving assistance in state-funded programs counted toward the TANF maintenance of effort (MOE) requirement.
1 T he definition of T ANF assistance is not in statute. However, because the statutory language has most T ANF requirements triggered by a family receiving “assistance,” the Department of Health and Human Services (HHS) regulations define assistance at 45 C.F.R. §260.31. Congressional Research Service 4 link to page 9 link to page 18 The Temporary Assistance for Needy Families (TANF) Block Grant: FAQs How Does the Current Assistance Caseload Level Compare with Historical Levels?
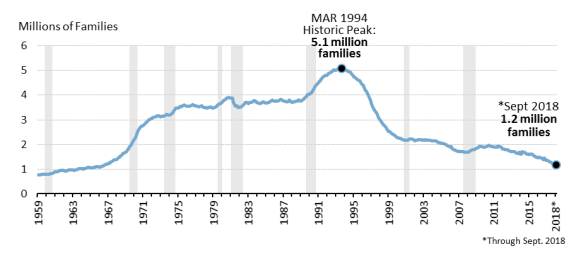
Figure 2 provides a long-term historical perspective on the number of families receiving assistance from TANF or its predecessor program, from July 1959 to September 20172019. The shaded areas of the figure represent months when the national economy was in recession. Though the health of the national economy has affected the trend in the cash assistance caseload, the long-
term trend in receipt of cash assistance does not follow a classic countercyclical pattern. Such a pattern would have the caseload rise during economic slumps, and then fall fal again during periods of economic growth. Factors other than the health of the economy (demographic trends, policy
changes) also have influenced the caseload trend.
The figure shows two periods of sustained caseload increases: the period from the mid-1960s to the mid-1970s and a second period from 1988 to 1994. The number of families receiving assistance peaked in March 1994 at 5.1 millionmil ion families. The assistance caseload fell fel rapidly in the late 1990s (after the 1996 welfare reform law) before leveling off in 2001. In 2004, the
caseload began another decline, albeit at a slower pace than in the late 1990s. During the recent 2007-2009 recession and its aftermath, the caseload began to rise from 1.7 millionmil ion families in August 2008, peaking in December 2010 at close to 2.0 millionmil ion families. By September 20182019, the assistance caseload had declined to 1.2 million families.
1 mil ion families. As of June 2020, TANF assistance caseload data are unavailable for the early part of 2020, including months of the economic
recession associated with the COVID-19 pandemic.
Figure 2. Number of Families Receiving Cash Assistance, July 1959-September |
 |
Notes: Shaded areas denote months when the national economy was in recession. |
2019.
Congressional Research Service
5
link to page 30 link to page 11 The Temporary Assistance for Needy Families (TANF) Block Grant: FAQs
Table B-5 shows recent trends in the number of cash assistance families by state.
What Are the Characteristics of Families Receiving TANF Assistance?
Before PRWORA, the "typical"“typical” family receiving assistance hashad been headed by a single parent (usually
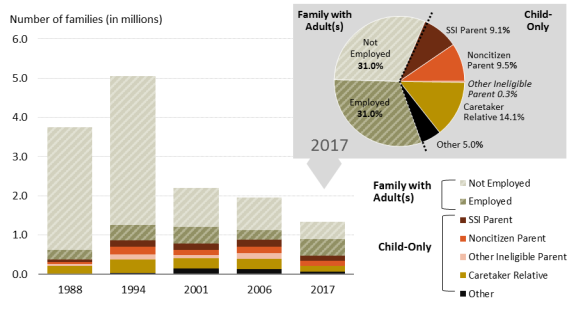
(usual y the mother) with one or two children. That single parent has also typicallyhad also typical y been unemployed. However, over the past 20 years the assistance caseload decline has occurred together with a major shift in the composition of the rolls. Figure 3 shows the change in the size and composition of the assistance caseload under both AFDC (1988 and 1994) and TANF. In FY1988, an estimated 84% of AFDC families were headed by an unemployed adult recipient. In FY2016
FY2018, families with an unemployed adult recipient represented 32% of all al cash assistance families. This decline occurred, in large part, as the number of families headed by unemployed adult recipients declined more rapidly than other components of the assistance caseload. In FY1994, a monthly average of 3.8 million mil ion families per month who received AFDC cash assistance had adult recipients who were not working. In FY2016FY2018, a monthly average of 485394,000
families per month had adult recipients or work-eligible individuals, with no adult recipient or
work-eligible individual working.
With the decline in families headed by unemployed adults, the share of the caseload represented
by families with employed adults and "child only" families has increased. In FY2017, families with all adult recipients unemployed and families with employed adult recipients each represented 31% of all assistance families. The latter“child-only” families has increased. The first category includes families in "“earnings supplement"” programs separate from the regular TANF cash assistance program. "Child-only"In FY2018, families with an employed adult comprised 27% of al TANF
families.
Child-only TANF families are those where no adult recipient receives benefits in their own right; the family receives benefits on behalf of its children. The share of the caseload that was child-only in FY2017FY2018 was 3841%. In FY2017FY2018, families with a nonrecipientnon-recipient, nonparent relative (grandparents, aunts, uncles) represented 1416% of all al assistance families. Families with ineligible,
noncitizen adults or adults who have not reported their citizenship status made up 910% of the assistance caseload in that year. Families where the parent received Supplemental Security Income (SSI) and the children received TANF also made up 910% of all al assistance families in FY2017.
TANF Cash Benefits: How Much Does a Family Receive in TANF Cash Per Month?
There are no federal rules that help determine the amount of TANF cash benefits paid to a family. (There are also no federal rules that require states to use TANF to pay cash benefits, though all al
states do so.) Benefit amounts are determined solely by the states.
Most states base TANF cash benefit amounts on family size, paying larger cash benefits to larger families on the presumption that they have greater financial needs. The maximum monthly cash benefit is usuallyusual y paid to a family that receives no other income (e.g., no earned or unearned income) and complies with program rules. Families with income other than TANF often are paid a reduced benefit. Moreover, some families are financiallyfinancial y sanctioned for not meeting a program
requirement (e.g., a work requirement), and are also paid a lower benefit.
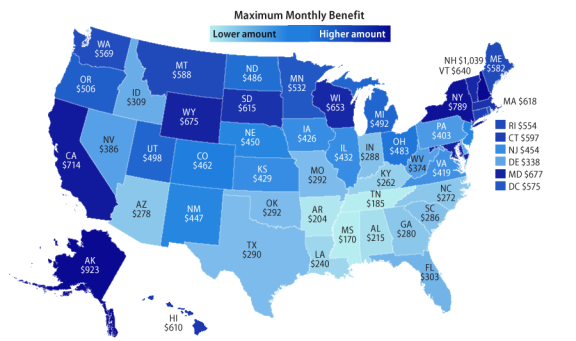
Figure 4 shows the maximum monthly TANF cash benefit by state for a single motherparent caring for two children (family of three) in July 2018.32 The benefit amounts shown are those for a single-
parent family with two children.43 For a family of three, the maximum TANF benefit paid in July 2018 varied from $170 per month in Mississippi to $1,039 per month in New Hampshire. The map shows a regional pattern to the maximum monthly benefit paid, with lower benefit amounts 2 States are not required to report to the federal government their cash assistance benefit amounts in either the T ANF state plan (under Section 402 of the Social Security Act) or in annual program reports (unde r Section 411 of the Social Security Act). T he benefit amounts shown are from the “Welfare Rules Database,” maintained by the Urban Institute and funded by the Department of Health and Human Services (HHS).
3 Some states vary their benefit amounts for other family types such as two-parent families or “child-only” cases. States also vary their benefits by other factors such as housing costs and substate geography.
Congressional Research Service
7
The Temporary Assistance for Needy Families (TANF) Block Grant: FAQs
in the South than in other regions. Only New Hampshire (at 60% of the federal poverty guidelines) had a maximum TANF cash assistance amount for this sized family in excess of 50%
of poverty-level income.5
TANF Work Participation Standards
TANF'’s main federal work requirement is actuallyactual y a performance measure that applies to the
states, rather than individual recipients. States determine the work rules that apply to individual recipients.
recipients. What Is the TANF Work Participation Standard States Must Meet?
The TANF statute requires states to have 50% of their caseload meet standards of participationpartic ipation in work or activities—that is, a family member must be in specified activities for a minimum number of hours.65 There is a separate participation standard that applies to the two-parent portion
4 In 2018, the HHS poverty guidelines for the contiguous 48 states and the District of Columbia for a family of three was $1,732 per month. Higher poverty lines applied in Alaska ($2,165 per month for a family of three) and Hawaii ($1,992 per month for a family of three). 5 Families without a work-eligible individual are excluded from the participat ion rate calculation. It excludes families where the parent is a nonrecipient (for example, disabled receiving Supplemental Security Income or an ineligible noncitizen) or the children in the family are being cared for by a nonparent relative (e.g., grandp arent, aunt, uncle) who does not receive assistance on his or her behalf.
Congressional Research Service
8
The Temporary Assistance for Needy Families (TANF) Block Grant: FAQs
of a state’ There is a separate participation standard that applies to the two-parent portion of a state's caseload, requiring 90% of the state'’s two-parent caseload to meet participation standards.
standards.
However, the statutory work participation standards are reduced by a "“caseload reduction credit." ”
The caseload reduction credit reduces the participation standard one percentage point for each percentage point decline in a state'’s caseload. Additionally, Additional y, under a regulatory provision, a state may get "extra"“extra” credit for caseload reduction if it spends more than required under the TANF MOE. Therefore, the effective standards states face are often less than the 50% and 90% targets,
and vary by state and by year.
States that do not meet the TANF work participation standard are at risk of being penalized through a reduction in their block grant. However, penalties can be forgiven if a state claims, and the Secretary of HHS finds, that it had "“reasonable cause"” for not meeting the standard. Penalties
can also be forgiven for states that enter into "“corrective compliance plans,"” and subsequently
meet the work standard.
Have There Been Changes in the Work Participation Rules Enacted Since the 1996 Welfare Reform Law?
The 50% and 90% target standards that states face, as well wel as the caseload reduction credit, date back to the 1996 welfare reform law. However, the Deficit Reduction Act of 2005 (DRA, P.L.
109-171) made several changes to the work participation rules effective in FY2007
- .
The caseload reduction credit was changed to measure caseload reduction from
FY2005, rather than the original law
'’s FY1995. -
The work participation standards were broadened to include families receiving
cash aid in
"“separate state programs."” Separate state programs are programs run with state funds, distinct from a state's "’s “TANF program,"” but with expenditures countable toward the TANF MOE. -
HHS was instructed to provide definition to the
allowableal owable TANF work activities listed in law. HHS was also required to define what is meant by a"“work-eligible"” individual, - States were required to develop plans and procedures to verify work activities.
The American Recovery and Reinvestment Act of 2009 (ARRA, P.L. 111-5), a law enacted in response to the sharp economic downturn of 2007-2009, held states "harmless"“harmless” for caseload increases affecting the work participation standards for FY2009 through FY2011. It did so by allowingal owing states to "freeze"“freeze” caseload reduction credits at pre-recession levels through the FY2011 standards.
standards. What Work Participation Rates Have the States Achieved?
HHS computes two work participation rates for each state that are then compared with the effective (after-credit) standard to determine if it has met the TANF work standard. An "all-families"“al -families” work participation rate is computed and compared with the allal -families effective standard (50% minus the state'’s caseload reduction credit). HHS also computes a two-parent work participation rate that is compared with the two-parent effective standard (90% minus the state'
state’s caseload reduction credit).
Congressional Research Service
9
link to page 14 link to page 15
The Temporary Assistance for Needy Families (TANF) Block Grant: FAQs
Figure 5 shows the national average allal -families work participation rate for FY2002 through FY2018. For the period FY2002 through FY2011, states achieved an average allal -families work participation rate hovering around 30%. The work participation rate increased since then. In FY2016, it exceeded 50% for the first time since TANF was established. However, it is important to note that the increase in the work participation rate has not come from an increase in the number of recipients in regular TANF assistance programs who are either working or in job
preparation activities. This increase stems mostly from states creating new "“earnings supplement" ” programs that use TANF funds to aid working parents in the Supplemental Nutrition Assistance Program (SNAP, formerly food stamps) or who have left the regular TANF assistance programs for work.6
for work.7
How Many Jurisdictions Did Not Meet the All-Families Standard?
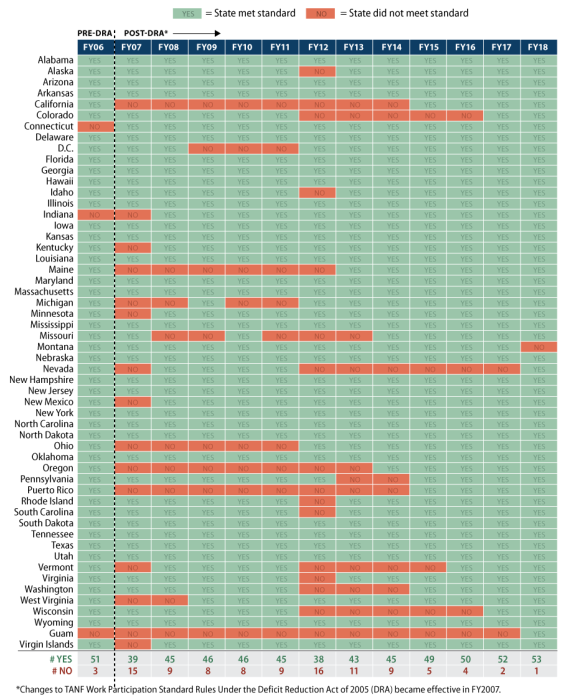
Figure 6 shows which states and territories did not meet the TANF allal -families work participation
standards from FY2006 through FY2018. Before FY2007, the first year that DRA was effective, only a few jurisdictions did not meet TANF allal -families work participation standards. However, in FY2007, 15 jurisdictions did not meet the allal -families standard. This number declined to 9 in
FY2008 and 8 in FY2009.
In FY2012, despite the uptick in the national average work participation rate, 16 states or territories did not meet the allal -family standard, the largest number of statesjurisdictions that did not meet their participation standards in any one year since the enactment of TANF. FY2012 was the year that ARRA's "freeze"’s “freeze” of the caseload reduction credit expired, and states were generallyjurisdictions were
general y required to meet higher standards than in previous years.
The number of jurisdictions that did not meet the all-familiesal -families participation standard declined over the FY2012 to FY2017FY2018 period. In FY2018, Montana was the only jurisdiction that did not meet the all-family participation standard.
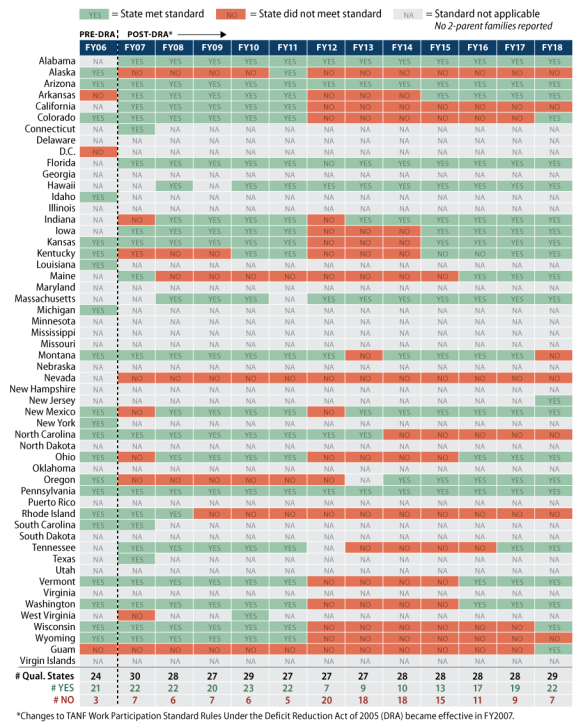
Have States Met the Two-Parent Work Participation Standard?
In addition to meeting a work standard for all al families, TANF also imposes a second standard—90%—for the two-parent portion of its cash assistance caseload. This standard can also be
lowered by caseload reduction.
Figure 7 shows whether each state or territory met its two-parent work participation standard for FY2006 through FY2018. However, the display on the table is more complex than that for
reporting whether a statejurisdiction met or did not meet its "all family"“al family” rate.
A substantial number of states and territories have reported no two-parent families subject to the work participation standard. These statesjurisdictions are denoted on the table with an "“NA,"” indicating that the two-parent standard was not applicable to the statejurisdiction in that year. Before the changes made by the DRA were effective, a number of statesjurisdictions had their two-parent families in
separate state programs that were not included in the work participation calculation. When DRA brought families receiving assistance in separate state programs into the work participation rate calculations, a number of statesjurisdictions moved these families into solely state-funded programs. These are state-funded programs with expenditures not countable toward the TANF maintenance
of effort requirement, and hence are outside of TANF'’s rules.
For states
For jurisdictions with two-parent families in their caseloads, the table reports "Yes"“Yes” for states that met the two-parent standard, and "No"“No” for states that did not meet the two-parent standard. Of the 29 jurisdictions that had two-parent families in their FY2018 TANF work participation
calculation, 22 met the standard and 7 did not.
Appendix A.
Congressional Research Service
13
The Temporary Assistance for Needy Families (TANF) Block Grant: FAQs
Appendix A. Supplementary Tables
Supplementary Tables
|
TANF Child Recipients |
||||||||
|
Year |
Families (millions) |
Recipients (millions) |
Adults (millions) |
Children (millions) |
As a Percentage of All Children |
As a Percentage of All Poor Children |
||
|
1961 |
0.873 |
3.363 |
0.765 |
2.598 |
3.7% |
14.3% |
||
|
1962 |
0.939 |
3.704 |
0.860 |
2.844 |
4.0 |
15.7 |
||
|
1963 |
0.963 |
3.945 |
0.988 |
2.957 |
4.1 |
17.4 |
||
|
1964 |
1.010 |
4.195 |
1.050 |
3.145 |
4.3 |
18.6 |
||
|
1965 |
1.060 |
4.422 |
1.101 |
3.321 |
4.5 |
21.5 |
||
|
1966 |
1.096 |
4.546 |
1.112 |
3.434 |
4.7 |
26.5 |
||
|
1967 |
1.220 |
5.014 |
1.243 |
3.771 |
5.2 |
31.2 |
||
|
1968 |
1.410 |
5.702 |
1.429 |
4.274 |
5.9 |
37.8 |
||
|
1969 |
1.696 |
6.689 |
1.716 |
4.973 |
6.9 |
49.7 |
||
|
1970 |
2.207 |
8.462 |
2.250 |
6.212 |
8.6 |
57.7 |
||
|
1971 |
2.763 |
10.242 |
2.808 |
7.435 |
10.4 |
68.5 |
||
|
1972 |
3.048 |
10.944 |
3.039 |
7.905 |
11.1 |
74.9 |
||
|
1973 |
3.148 |
10.949 |
3.046 |
7.903 |
11.2 |
79.9 |
||
|
1974 |
3.219 |
10.847 |
3.041 |
7.805 |
11.2 |
75.0 |
||
|
1975 |
3.481 |
11.319 |
3.248 |
8.071 |
11.8 |
71.2 |
||
|
1976 |
3.565 |
11.284 |
3.302 |
7.982 |
11.8 |
76.2 |
||
|
1977 |
3.568 |
11.015 |
3.273 |
7.743 |
11.6 |
73.9 |
||
|
1978 |
3.517 |
10.551 |
3.188 |
7.363 |
11.2 |
72.8 |
||
|
1979 |
3.509 |
10.312 |
3.130 |
7.181 |
11.0 |
68.0 |
||
|
1980 |
3.712 |
10.774 |
3.355 |
7.419 |
11.5 |
63.2 |
||
|
1981 |
3.835 |
11.079 |
3.552 |
7.527 |
11.7 |
59.2 |
||
|
1982 |
3.542 |
10.358 |
3.455 |
6.903 |
10.8 |
49.6 |
||
|
1983 |
3.686 |
10.761 |
3.663 |
7.098 |
11.1 |
50.1 |
||
|
1984 |
3.714 |
10.831 |
3.687 |
7.144 |
11.2 |
52.3 |
||
|
1985 |
3.701 |
10.855 |
3.658 |
7.198 |
11.3 |
54.4 |
||
|
1986 |
3.763 |
11.038 |
3.704 |
7.334 |
11.5 |
56.0 |
||
|
1987 |
3.776 |
11.027 |
3.661 |
7.366 |
11.5 |
56.4 |
||
|
1988 |
3.749 |
10.915 |
3.586 |
7.329 |
11.4 |
57.8 |
||
|
1989 |
3.798 |
10.992 |
3.573 |
7.419 |
11.5 |
57.9 |
||
|
1990 |
4.057 |
11.695 |
3.784 |
7.911 |
12.1 |
57.9 |
||
|
1991 |
4.497 |
12.930 |
4.216 |
8.715 |
13.2 |
59.8 |
||
|
1992 |
4.829 |
13.773 |
4.470 |
9.303 |
13.9 |
59.9 |
||
|
1993 |
5.012 |
14.205 |
4.631 |
9.574 |
14.1 |
60.0 |
||
|
1994 |
5.033 |
14.161 |
4.593 |
9.568 |
13.9 |
61.7 |
||
|
1995 |
4.791 |
13.418 |
4.284 |
9.135 |
13.1 |
61.5 |
||
|
1996 |
4.434 |
12.321 |
3.928 |
8.600 |
12.3 |
58.7 |
||
|
1997 |
3.740 |
10.376 |
NA |
NA |
10.0 |
50.1 |
||
|
1998 |
3.050 |
8.347 |
NA |
NA |
8.1 |
42.9 |
||
|
1999 |
2.578 |
6.924 |
NA |
NA |
6.7 |
39.4 |
||
|
2000 |
2.303 |
6.143 |
1.655 |
4.479 |
6.1 |
38.1 |
||
|
2001 |
2.192 |
5.717 |
1.514 |
4.195 |
5.7 |
35.3 |
||
|
2002 |
2.187 |
5.609 |
1.479 |
4.119 |
5.6 |
33.6 |
||
|
2003 |
2.180 |
5.490 |
1.416 |
4.063 |
5.5 |
31.3 |
||
|
2004 |
2.153 |
5.342 |
1.362 |
3.969 |
5.4 |
30.2 |
||
|
2005 |
2.061 |
5.028 |
1.261 |
3.756 |
5.1 |
28.9 |
||
|
2006 |
1.906 |
4.582 |
1.120 |
3.453 |
4.6 |
26.7 |
||
|
2007 |
1.730 |
4.075 |
0.956 |
3.119 |
4.2 |
23.2 |
||
|
2008 |
1.701 |
4.005 |
0.946 |
3.059 |
4.1 |
21.6 |
||
|
2009 |
1.838 |
4.371 |
1.074 |
3.296 |
4.4 |
21.2 |
||
|
2010 |
1.919 |
4.598 |
1.163 |
3.435 |
4.6 |
20.9 |
||
|
2011 |
1.907 |
4.557 |
1.149 |
3.408 |
4.6 |
20.9 |
||
|
2012 |
1.852 |
4.402 |
1.104 |
3.298 |
4.4 |
20.3 |
||
|
2013 |
1.726 |
4.042 |
0.993 |
3.050 |
4.1 |
19.1 |
||
|
2014 |
1.650 |
3.957 |
1.007 |
2.950 |
4.0 |
18.9 |
||
|
2015 |
1.609 |
4.126 |
1.155 |
2.971 |
4.0 |
20.4 |
||
|
2016 |
1.479 |
3.780 |
1.037 |
2.743 |
3.7 |
20.7 |
||
|
2017 |
1.358 |
3.516 |
0,930 |
|
3.5 |
20.1 |
||
|
2018 |
1.196 |
3.150 |
0.833 |
|
3.2 |
19.5 |
||
Source: Congressional Research Service (CRS), based on data from the U.S. Department of Health and Human Services (HHS) and the U.S. Census Bureau.
Notes: NA denotes not available. During transition reporting from AFDC Table A-1. Trends in the Cash Assistance Caseload: 1961-2018
TANF Child Recipients
As a
As a
Percentage
Percentage
Families
Recipients
Adults
Children
of All
of All Poor
Year
(millions)
(millions)
(millions)
(millions)
Children
Children
1961
0.873
3.363
0.765
2.598
3.7%
14.3%
1962
0.939
3.704
0.860
2.844
4.0
15.7
1963
0.963
3.945
0.988
2.957
4.1
17.4
1964
1.010
4.195
1.050
3.145
4.3
18.6
1965
1.060
4.422
1.101
3.321
4.5
21.5
1966
1.096
4.546
1.112
3.434
4.7
26.5
1967
1.220
5.014
1.243
3.771
5.2
31.2
1968
1.410
5.702
1.429
4.274
5.9
37.8
1969
1.696
6.689
1.716
4.973
6.9
49.7
1970
2.207
8.462
2.250
6.212
8.6
57.7
1971
2.763
10.242
2.808
7.435
10.4
68.5
1972
3.048
10.944
3.039
7.905
11.1
74.9
1973
3.148
10.949
3.046
7.903
11.2
79.9
1974
3.219
10.847
3.041
7.805
11.2
75.0
1975
3.481
11.319
3.248
8.071
11.8
71.2
1976
3.565
11.284
3.302
7.982
11.8
76.2
1977
3.568
11.015
3.273
7.743
11.6
73.9
1978
3.517
10.551
3.188
7.363
11.2
72.8
1979
3.509
10.312
3.130
7.181
11.0
68.0
1980
3.712
10.774
3.355
7.419
11.5
63.2
1981
3.835
11.079
3.552
7.527
11.7
59.2
1982
3.542
10.358
3.455
6.903
10.8
49.6
1983
3.686
10.761
3.663
7.098
11.1
50.1
1984
3.714
10.831
3.687
7.144
11.2
52.3
1985
3.701
10.855
3.658
7.198
11.3
54.4
1986
3.763
11.038
3.704
7.334
11.5
56.0
1987
3.776
11.027
3.661
7.366
11.5
56.4
1988
3.749
10.915
3.586
7.329
11.4
57.8
1989
3.798
10.992
3.573
7.419
11.5
57.9
1990
4.057
11.695
3.784
7.911
12.1
57.9
1991
4.497
12.930
4.216
8.715
13.2
59.8
Congressional Research Service
14
The Temporary Assistance for Needy Families (TANF) Block Grant: FAQs
TANF Child Recipients
As a
As a
Percentage
Percentage
Families
Recipients
Adults
Children
of All
of All Poor
Year
(millions)
(millions)
(millions)
(millions)
Children
Children
1992
4.829
13.773
4.470
9.303
13.9
59.9
1993
5.012
14.205
4.631
9.574
14.1
60.0
1994
5.033
14.161
4.593
9.568
13.9
61.7
1995
4.791
13.418
4.284
9.135
13.1
61.5
1996
4.434
12.321
3.928
8.600
12.3
58.7
1997
3.740
10.376
NA
NA
10.0
50.1
1998
3.050
8.347
NA
NA
8.1
42.9
1999
2.578
6.924
NA
NA
6.7
39.4
2000
2.303
6.143
1.655
4.479
6.1
38.1
2001
2.192
5.717
1.514
4.195
5.7
35.3
2002
2.187
5.609
1.479
4.119
5.6
33.6
2003
2.180
5.490
1.416
4.063
5.5
31.3
2004
2.153
5.342
1.362
3.969
5.4
30.2
2005
2.061
5.028
1.261
3.756
5.1
28.9
2006
1.906
4.582
1.120
3.453
4.6
26.7
2007
1.730
4.075
0.956
3.119
4.2
23.2
2008
1.701
4.005
0.946
3.059
4.1
21.6
2009
1.838
4.371
1.074
3.296
4.4
21.2
2010
1.919
4.598
1.163
3.435
4.6
20.9
2011
1.907
4.557
1.149
3.408
4.6
20.9
2012
1.852
4.402
1.104
3.298
4.4
20.3
2013
1.726
4.042
0.993
3.050
4.1
19.1
2014
1.650
3.957
1.007
2.950
4.0
18.9
2015
1.609
4.126
1.155
2.971
4.0
20.4
2016
1.479
3.780
1.037
2.743
3.7
20.7
2017
1.358
3.516
0,930
2.577
3.5
20.1
2018
1.196
3.150
0.833
2.317
3.2
19.5
Source: Congressional Research Service (CRS), based on data from the U.S. Department of Health and Human Services (HHS) and the U.S. Census Bureau. Notes: NA denotes not available. During transition reporting from AFDC to TANF, caseload statistics on adult and child recipients were not collected. not col ected. For those years, TANF children as a percent of all al children and percent of al of all poor children were estimated by HHS and published in Welfare Indicators and Risk Factors, Annual Report to Congress, Table TANF 2, p. A-7. See http://aspe.hhs.gov/hsp/14/indicators/rpt_indicators.pdf.
.
Congressional Research Service
15
The Temporary Assistance for Needy Families (TANF) Block Grant: FAQs
Table A-2. Families Receiving AFDC/TANF Assistance by Family Category, Selected
Years, FY1988-FY2018
1988
1994
2001
2006
2018
Adult Recipient or Work-Eligible Parent/Not
3,136,56
3,798,99
992,445
825,490
394,316
Working
6
7
Adult Recipient or Work-Eligible Years, FY1988-FY2017
|
AFDC |
TANF |
||||
|
|
1988 |
1994 |
2001 |
2006 |
2017 |
|
Number of Families Receiving Assistance |
|||||
|
Adult Recipient or Work-Eligible Parent/Not Working |
3,136,566 |
3,798,997 |
992,445 |
825,490 |
434,602 |
|
Adult Recipient or Work-Eligible Parent/Working |
243,573 |
378,620 |
420,794 |
259,001 |
435,259 |
|
Child-Only/SSI Parent |
59,988 |
171,391 |
171,951 |
176,670 |
126,483 |
|
Child-Only/Noncitizen Parent |
47,566 |
184,397 |
125,900 |
153,445 |
133,173 |
|
Child-Only/Other Ineligible Parent |
51,764 |
146,227 |
91,447 |
158,113 |
4,370 |
|
Child-Only/Caretaker Relative |
188,598 |
328,290 |
255,984 |
261,944 |
198,103 |
|
Child-Only/Unknown |
19,897 |
38,341 |
143,834 |
122,738 |
70,882 |
|
Totals |
3,747,952 |
5,046,263 |
2,202,356 |
1,957,402 |
1,402,871 |
|
Percentage of All Families Receiving Assistance |
|||||
|
Adult Recipient or Work-Eligible Parent/Not Working |
83.7% |
75.3% |
45.1% |
42.2% |
31.0% |
|
6.5 |
7.5 |
19.1 |
13.2 |
31.0 |
|
Child-Only/SSI Parent |
1.6 |
3.4 |
7.8 |
9.0 |
9.0 |
|
Child-Only/Noncitizen Parent |
1.3 |
3.7 |
5.7 |
7.8 |
9.5 |
|
Child-Only/Other Ineligible Parent |
1.4 |
2.9 |
4.2 |
8.1 |
0.3 |
|
Child-Only/Caretaker Relative |
5.0 |
6.5 |
11.6 |
13.4 |
14.1 |
|
Child-Only/Unknown |
0.5 |
0.8 |
6.5 |
6.3 |
5.1 |
|
Totals |
100.0 |
100.0 |
100.0 |
100.0 |
100.0 |
Source: Congressional Research Service (CRS) tabulations of the FY1988 and FY1994 AFDC Quality Control (QC) data files and the FY2001, FY2006, and FY2017FY2018 TANF National Data Files.
Notes: FY2001 through FY2017FY2018 data include families receiving assistance from separate state programs (SSPs) with expenditures countable toward the TANF maintenance of effort (MOE) requirement. For FY2017, TANF families For FY2018, TANF families with an adult recipient include those families with "“work-eligible" ” nonrecipient parents. These include nonrecipient parents who have been time-limited or sanctioned off the rolls, rol s, but the family continues to receive a reduced benefit. For FY2001 and FY2006, such families cannot be identified and are classified as "child-only" families.
Appendix B.
“child -only” families.
Congressional Research Service
16
Appendix B. State Tables
State Tables
|
Assistance |
Child Care |
Work, Education, and Training |
Refund-able Tax Credits |
Pre-K/Head Start |
Child Welfare |
Administ-ration |
Emer-gency Short-Term Benefits |
Other Benefits and Services |
Totals |
|
|
Alabama |
$20.322 |
$5.869 |
$6.318 |
$0.000 |
$22.273 |
$40.456 |
$19.381 |
$34.229 |
$34.613 |
$183.461 |
|
Alaska |
42.074 |
18.167 |
8.775 |
0.000 |
0.000 |
0.000 |
8.356 |
0.303 |
15.111 |
92.786 |
|
Arizona |
41.697 |
2.547 |
0.377 |
0.000 |
0.000 |
227.246 |
19.510 |
9.483 |
33.361 |
334.222 |
|
Arkansas |
4.099 |
15.515 |
14.674 |
0.000 |
108.351 |
0.330 |
13.143 |
4.079 |
4.985 |
165.175 |
|
California |
2,329.995 |
742.572 |
1,778.602 |
0.000 |
0.000 |
0.003 |
536.493 |
254.368 |
951.812 |
6,593.846 |
|
Colorado |
55.969 |
17.933 |
10.675 |
78.133 |
62.010 |
46.305 |
23.917 |
20.468 |
65.744 |
381.154 |
|
Connecticut |
50.236 |
39.992 |
11.732 |
56.444 |
76.203 |
62.230 |
36.063 |
19.726 |
145.736 |
498.362 |
|
Delaware |
13.868 |
76.442 |
3.791 |
0.000 |
0.000 |
0.000 |
3.521 |
2.649 |
16.273 |
116.543 |
|
District of Columbia |
114.482 |
59.117 |
29.873 |
0.000 |
0.000 |
0.000 |
9.730 |
67.559 |
8.899 |
289.659 |
|
Florida |
160.443 |
316.879 |
43.770 |
0.000 |
0.000 |
269.205 |
70.038 |
0.902 |
80.325 |
941.562 |
|
Georgia |
95.550 |
22.183 |
10.626 |
0.000 |
0.000 |
247.792 |
19.767 |
4.672 |
89.556 |
490.146 |
|
Hawaii |
28.603 |
11.042 |
41.180 |
0.000 |
0.181 |
0.536 |
13.425 |
5.701 |
98.041 |
198.708 |
|
Idaho |
8.219 |
13.637 |
2.759 |
0.000 |
1.509 |
1.507 |
7.759 |
12.651 |
1.506 |
49.547 |
|
Illinois |
31.883 |
593.251 |
19.252 |
66.150 |
106.476 |
242.283 |
0.062 |
0.740 |
83.502 |
1,143.599 |
|
Indiana |
14.744 |
118.452 |
83.762 |
27.530 |
0.000 |
9.337 |
24.102 |
0.388 |
136.557 |
414.873 |
|
Iowa |
33.549 |
58.003 |
10.485 |
25.939 |
0.000 |
55.569 |
5.965 |
0.298 |
21.696 |
211.506 |
|
Kansas |
13.026 |
6.673 |
1.021 |
49.902 |
15.198 |
24.611 |
11.446 |
0.001 |
43.604 |
165.480 |
|
Kentucky |
172.118 |
36.051 |
29.026 |
0.000 |
0.000 |
0.000 |
11.201 |
0.000 |
13.154 |
261.549 |
|
Louisiana |
19.673 |
11.122 |
33.016 |
13.627 |
45.490 |
37.556 |
18.429 |
11.686 |
34.916 |
225.516 |
|
Maine |
30.393 |
16.412 |
12.457 |
7.592 |
0.719 |
8.425 |
5.099 |
4.867 |
31.073 |
117.038 |
|
Maryland |
111.809 |
7.336 |
28.247 |
152.658 |
58.188 |
26.017 |
21.845 |
42.786 |
51.461 |
500.347 |
|
Massachusetts |
197.096 |
338.728 |
168.496 |
173.120 |
0.000 |
5.412 |
37.800 |
106.280 |
68.388 |
1,095.319 |
|
Michigan |
168.726 |
27.829 |
4.868 |
47.087 |
187.157 |
98.198 |
53.241 |
66.007 |
750.442 |
1,403.556 |
|
Minnesota |
85.569 |
156.198 |
61.434 |
152.779 |
5.700 |
0.000 |
54.632 |
24.678 |
22.180 |
563.170 |
|
Mississippi |
7.283 |
1.715 |
28.282 |
0.000 |
0.000 |
20.758 |
16.345 |
0.000 |
60.413 |
134.797 |
|
Missouri |
35.600 |
48.658 |
77.253 |
0.000 |
0.000 |
131.817 |
7.822 |
76.644 |
37.671 |
415.466 |
|
Montana |
25.091 |
9.410 |
3.931 |
0.000 |
0.000 |
2.460 |
4.688 |
2.748 |
11.092 |
59.420 |
|
Nebraska |
26.057 |
22.244 |
11.926 |
33.834 |
0.000 |
4.174 |
5.032 |
0.146 |
0.741 |
104.154 |
|
Nevada |
38.178 |
16.590 |
1.489 |
0.000 |
0.000 |
15.604 |
8.163 |
2.721 |
20.390 |
103.135 |
|
New Hampshire |
30.651 |
4.582 |
7.689 |
0.000 |
0.000 |
5.309 |
11.234 |
7.129 |
17.733 |
84.327 |
|
New Jersey |
81.594 |
166.219 |
80.724 |
348.961 |
549.240 |
0.000 |
51.532 |
15.091 |
71.483 |
1,364.843 |
|
New Mexico |
55.419 |
31.278 |
18.902 |
71.929 |
41.168 |
0.870 |
4.953 |
2.919 |
19.230 |
246.666 |
|
New York |
1,489.959 |
577.447 |
131.513 |
1,403.065 |
498.970 |
247.188 |
417.750 |
313.621 |
308.739 |
5,388.252 |
|
North Carolina |
36.847 |
216.874 |
5.437 |
0.000 |
120.828 |
124.292 |
44.812 |
5.421 |
42.710 |
597.221 |
|
North Dakota |
3.934 |
1.074 |
3.893 |
0.000 |
0.000 |
28.739 |
4.255 |
0.019 |
1.212 |
43.127 |
|
Ohio |
236.819 |
405.938 |
90.064 |
0.000 |
0.000 |
11.916 |
110.937 |
54.605 |
222.014 |
1,132.292 |
|
Oklahoma |
29.493 |
39.188 |
9.354 |
0.000 |
12.079 |
14.304 |
8.623 |
3.155 |
30.506 |
146.702 |
|
Oregon |
83.385 |
11.175 |
16.521 |
3.381 |
8.630 |
14.588 |
41.043 |
32.056 |
65.658 |
276.435 |
|
Pennsylvania |
167.239 |
478.148 |
102.955 |
0.000 |
176.997 |
0.000 |
73.820 |
14.928 |
140.721 |
1,154.808 |
|
Rhode Island |
25.472 |
40.366 |
9.874 |
22.705 |
0.000 |
23.308 |
8.839 |
24.855 |
12.235 |
167.654 |
|
South Carolina |
52.919 |
4.085 |
33.401 |
0.000 |
26.382 |
5.050 |
18.931 |
0.000 |
23.993 |
164.761 |
|
South Dakota |
15.094 |
0.803 |
3.517 |
0.000 |
0.000 |
4.863 |
2.016 |
3.451 |
2.896 |
32.639 |
|
Tennessee |
18.417 |
0.000 |
7.592 |
0.000 |
85.990 |
0.000 |
26.241 |
0.000 |
0.187 |
138.426 |
|
Texas |
53.170 |
0.000 |
84.856 |
0.000 |
340.550 |
240.425 |
77.213 |
3.802 |
62.412 |
862.428 |
|
Utah |
18.920 |
23.452 |
22.689 |
0.000 |
7.767 |
3.750 |
13.811 |
2.963 |
25.509 |
118.861 |
|
Vermont |
14.148 |
29.849 |
1.989 |
18.312 |
0.000 |
5.770 |
6.032 |
1.317 |
15.925 |
93.342 |
|
Virginia |
67.733 |
37.011 |
39.856 |
0.000 |
4.383 |
8.160 |
40.268 |
4.727 |
76.812 |
278.950 |
|
Washington |
135.807 |
227.095 |
101.517 |
0.000 |
39.450 |
0.000 |
122.470 |
58.065 |
374.341 |
1,058.746 |
|
West Virginia |
26.206 |
16.242 |
0.473 |
0.000 |
0.000 |
31.757 |
14.329 |
12.749 |
25.317 |
127.074 |
|
Wisconsin |
82.282 |
203.163 |
26.142 |
69.700 |
0.000 |
5.364 |
26.429 |
38.640 |
129.371 |
581.091 |
|
Wyoming |
9.075 |
1.554 |
3.033 |
0.000 |
0.939 |
0.000 |
4.270 |
3.175 |
1.582 |
23.628 |
|
Totals |
6,710.93 |
5,326.11 |
3,340.09 |
2,822.85 |
2,602.83 |
2,353.48 |
2,196.78 |
1,379.47 |
4,603.83 |
31,336.37 |
Source: Congressional Research Service (CRS), based on data from the U.S. Department of Health and Human Services (HHS).
Note: Excludes TANF funds used in the territories Table B-1. Use of FY2018 TANF and MOE Funds by Category
(Dol ars in mil ions)
Emer-
Work,
gency
Other
Education,
Refund-
Pre-
Short-
Benefits
Child
and
able Tax
K/Head
Child
Administ-
Term
and
State
Assistance
Care
Training
Credits
Start
Welfare
ration
Benefits
Services
Totals
Alabama
$20.322
$5.869
$6.318
$0.000
$22.273
$40.456
$19.381
$34.229
$34.613
$183.461
Alaska
42.074
18.167
8.775
0.000
0.000
0.000
8.356
0.303
15.111
92.786
Arizona
41.697
2.547
0.377
0.000
0.000
227.246
19.510
9.483
33.361
334.222
Arkansas
4.099
15.515
14.674
0.000
108.351
0.330
13.143
4.079
4.985
165.175
California
2,329.995
742.572
1,778.602
0.000
0.000
0.003
536.493
254.368
951.812
6,593.846
Colorado
55.969
17.933
10.675
78.133
62.010
46.305
23.917
20.468
65.744
381.154
Connecticut
50.236
39.992
11.732
56.444
76.203
62.230
36.063
19.726
145.736
498.362
Delaware
13.868
76.442
3.791
0.000
0.000
0.000
3.521
2.649
16.273
116.543
District of Columbia
114.482
59.117
29.873
0.000
0.000
0.000
9.730
67.559
8.899
289.659
Florida
160.443
316.879
43.770
0.000
0.000
269.205
70.038
0.902
80.325
941.562
Georgia
95.550
22.183
10.626
0.000
0.000
247.792
19.767
4.672
89.556
490.146
Hawai
28.603
11.042
41.180
0.000
0.181
0.536
13.425
5.701
98.041
198.708
Idaho
8.219
13.637
2.759
0.000
1.509
1.507
7.759
12.651
1.506
49.547
Il inois
31.883
593.251
19.252
66.150
106.476
242.283
0.062
0.740
83.502
1,143.599
Indiana
14.744
118.452
83.762
27.530
0.000
9.337
24.102
0.388
136.557
414.873
Iowa
33.549
58.003
10.485
25.939
0.000
55.569
5.965
0.298
21.696
211.506
Kansas
13.026
6.673
1.021
49.902
15.198
24.611
11.446
0.001
43.604
165.480
Kentucky
172.118
36.051
29.026
0.000
0.000
0.000
11.201
0.000
13.154
261.549
CRS-17
Emer-
Work,
gency
Other
Education,
Refund-
Pre-
Short-
Benefits
Child
and
able Tax
K/Head
Child
Administ-
Term
and
State
Assistance
Care
Training
Credits
Start
Welfare
ration
Benefits
Services
Totals
Louisiana
19.673
11.122
33.016
13.627
45.490
37.556
18.429
11.686
34.916
225.516
Maine
30.393
16.412
12.457
7.592
0.719
8.425
5.099
4.867
31.073
117.038
Maryland
111.809
7.336
28.247
152.658
58.188
26.017
21.845
42.786
51.461
500.347
Massachusetts
197.096
338.728
168.496
173.120
0.000
5.412
37.800
106.280
68.388
1,095.319
Michigan
168.726
27.829
4.868
47.087
187.157
98.198
53.241
66.007
750.442
1,403.556
Minnesota
85.569
156.198
61.434
152.779
5.700
0.000
54.632
24.678
22.180
563.170
Mississippi
7.283
1.715
28.282
0.000
0.000
20.758
16.345
0.000
60.413
134.797
Missouri
35.600
48.658
77.253
0.000
0.000
131.817
7.822
76.644
37.671
415.466
Montana
25.091
9.410
3.931
0.000
0.000
2.460
4.688
2.748
11.092
59.420
Nebraska
26.057
22.244
11.926
33.834
0.000
4.174
5.032
0.146
0.741
104.154
Nevada
38.178
16.590
1.489
0.000
0.000
15.604
8.163
2.721
20.390
103.135
New Hampshire
30.651
4.582
7.689
0.000
0.000
5.309
11.234
7.129
17.733
84.327
New Jersey
81.594
166.219
80.724
348.961
549.240
0.000
51.532
15.091
71.483
1,364.843
New Mexico
55.419
31.278
18.902
71.929
41.168
0.870
4.953
2.919
19.230
246.666
New York
1,489.959
577.447
131.513
1,403.065
498.970
247.188
417.750
313.621
308.739
5,388.252
North Carolina
36.847
216.874
5.437
0.000
120.828
124.292
44.812
5.421
42.710
597.221
North Dakota
3.934
1.074
3.893
0.000
0.000
28.739
4.255
0.019
1.212
43.127
Ohio
236.819
405.938
90.064
0.000
0.000
11.916
110.937
54.605
222.014
1,132.292
Oklahoma
29.493
39.188
9.354
0.000
12.079
14.304
8.623
3.155
30.506
146.702
Oregon
83.385
11.175
16.521
3.381
8.630
14.588
41.043
32.056
65.658
276.435
Pennsylvania
167.239
478.148
102.955
0.000
176.997
0.000
73.820
14.928
140.721
1,154.808
Rhode Island
25.472
40.366
9.874
22.705
0.000
23.308
8.839
24.855
12.235
167.654
CRS-18
Emer-
Work,
gency
Other
Education,
Refund-
Pre-
Short-
Benefits
Child
and
able Tax
K/Head
Child
Administ-
Term
and
State
Assistance
Care
Training
Credits
Start
Welfare
ration
Benefits
Services
Totals
South Carolina
52.919
4.085
33.401
0.000
26.382
5.050
18.931
0.000
23.993
164.761
South Dakota
15.094
0.803
3.517
0.000
0.000
4.863
2.016
3.451
2.896
32.639
Tennessee
18.417
0.000
7.592
0.000
85.990
0.000
26.241
0.000
0.187
138.426
Texas
53.170
0.000
84.856
0.000
340.550
240.425
77.213
3.802
62.412
862.428
Utah
18.920
23.452
22.689
0.000
7.767
3.750
13.811
2.963
25.509
118.861
Vermont
14.148
29.849
1.989
18.312
0.000
5.770
6.032
1.317
15.925
93.342
Virginia
67.733
37.011
39.856
0.000
4.383
8.160
40.268
4.727
76.812
278.950
Washington
135.807
227.095
101.517
0.000
39.450
0.000
122.470
58.065
374.341
1,058.746
West Virginia
26.206
16.242
0.473
0.000
0.000
31.757
14.329
12.749
25.317
127.074
Wisconsin
82.282
203.163
26.142
69.700
0.000
5.364
26.429
38.640
129.371
581.091
Wyoming
9.075
1.554
3.033
0.000
0.939
0.000
4.270
3.175
1.582
23.628
Totals
6,710.93 5,326.11
3,340.09
2,822.85
2,602.83
2,353.48
2,196.78
1,379.47
4,603.83
31,336.37
Source: Congressional Research Service (CRS), based on data from the U.S. Department of Health and Human Services (HHS). Note: Excludes TANF funds used in the territories and in tribal TANF programs.
CRS-19
and in tribal TANF programs.
Table B-2. Uses of FY2018 TANF and MOE Funds by Category as a Percentage of Total Federal TANF and State MOE Spending
|
State |
Assistance |
Child Care |
Work, Education and Training |
Refund-able Tax Credits |
Pre-K/Head Start |
Child Welfare |
Admin-istration |
Emer-gency Short-Term Benefits |
Other Benefits and Services |
Totals |
|
Alabama |
11.1% |
3.2% |
3.4% |
0.0% |
12.1% |
22.1% |
10.6% |
18.7% |
18.9% |
100.0% |
|
Alaska |
45.3 |
19.6 |
9.5 |
0.0 |
0.0 |
0.0 |
9.0 |
0.3 |
16.3 |
100.0 |
|
Arizona |
12.5 |
0.8 |
0.1 |
0.0 |
0.0 |
68.0 |
5.8 |
2.8 |
10.0 |
100.0 |
|
Arkansas |
2.5 |
9.4 |
8.9 |
0.0 |
65.6 |
0.2 |
8.0 |
2.5 |
3.0 |
100.0 |
|
California |
35.3 |
11.3 |
27.0 |
0.0 |
0.0 |
0.0 |
8.1 |
3.9 |
14.4 |
100.0 |
|
Colorado |
14.7 |
4.7 |
2.8 |
20.5 |
16.3 |
12.1 |
6.3 |
5.4 |
17.2 |
100.0 |
|
Connecticut |
10.1 |
8.0 |
2.4 |
11.3 |
15.3 |
12.5 |
7.2 |
4.0 |
29.2 |
100.0 |
|
Delaware |
11.9 |
65.6 |
3.3 |
0.0 |
0.0 |
0.0 |
3.0 |
2.3 |
14.0 |
100.0 |
|
District of Columbia |
39.5 |
20.4 |
10.3 |
0.0 |
0.0 |
0.0 |
3.4 |
23.3 |
3.1 |
100.0 |
|
Florida |
17.0 |
33.7 |
4.6 |
0.0 |
0.0 |
28.6 |
7.4 |
0.1 |
8.5 |
100.0 |
|
Georgia |
19.5 |
4.5 |
2.2 |
0.0 |
0.0 |
50.6 |
4.0 |
1.0 |
18.3 |
100.0 |
|
Hawaii |
14.4 |
5.6 |
20.7 |
0.0 |
0.1 |
0.3 |
6.8 |
2.9 |
49.3 |
100.0 |
|
Idaho |
16.6 |
27.5 |
5.6 |
0.0 |
3.0 |
3.0 |
15.7 |
25.5 |
3.0 |
100.0 |
|
Illinois |
2.8 |
51.9 |
1.7 |
5.8 |
9.3 |
21.2 |
0.0 |
0.1 |
7.3 |
100.0 |
|
Indiana |
3.6 |
28.6 |
20.2 |
6.6 |
0.0 |
2.3 |
5.8 |
0.1 |
32.9 |
100.0 |
|
Iowa |
15.9 |
27.4 |
5.0 |
12.3 |
0.0 |
26.3 |
2.8 |
0.1 |
10.3 |
100.0 |
|
Kansas |
7.9 |
4.0 |
0.6 |
30.2 |
9.2 |
14.9 |
6.9 |
0.0 |
26.3 |
100.0 |
|
Kentucky |
65.8 |
13.8 |
11.1 |
0.0 |
0.0 |
0.0 |
4.3 |
0.0 |
5.0 |
100.0 |
|
Louisiana |
8.7 |
4.9 |
14.6 |
6.0 |
20.2 |
16.7 |
8.2 |
5.2 |
15.5 |
100.0 |
|
Maine |
26.0 |
14.0 |
10.6 |
6.5 |
0.6 |
7.2 |
4.4 |
4.2 |
26.5 |
100.0 |
|
Maryland |
22.3 |
1.5 |
5.6 |
30.5 |
11.6 |
5.2 |
4.4 |
8.6 |
10.3 |
100.0 |
|
Massachusetts |
18.0 |
30.9 |
15.4 |
15.8 |
0.0 |
0.5 |
3.5 |
9.7 |
6.2 |
100.0 |
|
Michigan |
12.0 |
2.0 |
0.3 |
3.4 |
13.3 |
7.0 |
3.8 |
4.7 |
53.5 |
100.0 |
|
Minnesota |
15.2 |
27.7 |
10.9 |
27.1 |
1.0 |
0.0 |
9.7 |
4.4 |
3.9 |
100.0 |
|
Mississippi |
5.4 |
1.3 |
21.0 |
0.0 |
0.0 |
15.4 |
12.1 |
0.0 |
44.8 |
100.0 |
|
Missouri |
8.6 |
11.7 |
18.6 |
0.0 |
0.0 |
31.7 |
1.9 |
18.4 |
9.1 |
100.0 |
|
Montana |
42.2 |
15.8 |
6.6 |
0.0 |
0.0 |
4.1 |
7.9 |
4.6 |
18.7 |
100.0 |
|
Nebraska |
25.0 |
21.4 |
11.5 |
32.5 |
0.0 |
4.0 |
4.8 |
0.1 |
0.7 |
100.0 |
|
Nevada |
37.0 |
16.1 |
1.4 |
0.0 |
0.0 |
15.1 |
7.9 |
2.6 |
19.8 |
100.0 |
|
New Hampshire |
36.3 |
5.4 |
9.1 |
0.0 |
0.0 |
6.3 |
13.3 |
8.5 |
21.0 |
100.0 |
|
New Jersey |
6.0 |
12.2 |
5.9 |
25.6 |
40.2 |
0.0 |
3.8 |
1.1 |
5.2 |
100.0 |
|
New Mexico |
22.5 |
12.7 |
7.7 |
29.2 |
16.7 |
0.4 |
2.0 |
1.2 |
7.8 |
100.0 |
|
New York |
27.7 |
10.7 |
2.4 |
26.0 |
9.3 |
4.6 |
7.8 |
5.8 |
5.7 |
100.0 |
|
North Carolina |
6.2 |
36.3 |
0.9 |
0.0 |
20.2 |
20.8 |
7.5 |
0.9 |
7.2 |
100.0 |
|
North Dakota |
9.1 |
2.5 |
9.0 |
0.0 |
0.0 |
66.6 |
9.9 |
0.0 |
2.8 |
100.0 |
|
Ohio |
20.9 |
35.9 |
8.0 |
0.0 |
0.0 |
1.1 |
9.8 |
4.8 |
19.6 |
100.0 |
|
Oklahoma |
20.1 |
26.7 |
6.4 |
0.0 |
8.2 |
9.8 |
5.9 |
2.2 |
20.8 |
100.0 |
|
Oregon |
30.2 |
4.0 |
6.0 |
1.2 |
3.1 |
5.3 |
14.8 |
11.6 |
23.8 |
100.0 |
|
Pennsylvania |
14.5 |
41.4 |
8.9 |
0.0 |
15.3 |
0.0 |
6.4 |
1.3 |
12.2 |
100.0 |
|
Rhode Island |
15.2 |
24.1 |
5.9 |
13.5 |
0.0 |
13.9 |
5.3 |
14.8 |
7.3 |
100.0 |
|
South Carolina |
32.1 |
2.5 |
20.3 |
0.0 |
16.0 |
3.1 |
11.5 |
0.0 |
14.6 |
100.0 |
|
South Dakota |
46.2 |
2.5 |
10.8 |
0.0 |
0.0 |
14.9 |
6.2 |
10.6 |
8.9 |
100.0 |
|
Tennessee |
13.3 |
0.0 |
5.5 |
0.0 |
62.1 |
0.0 |
19.0 |
0.0 |
0.1 |
100.0 |
|
Texas |
6.2 |
0.0 |
9.8 |
0.0 |
39.5 |
27.9 |
9.0 |
0.4 |
7.2 |
100.0 |
|
Utah |
15.9 |
19.7 |
19.1 |
0.0 |
6.5 |
3.2 |
11.6 |
2.5 |
21.5 |
100.0 |
|
Vermont |
15.2 |
32.0 |
2.1 |
19.6 |
0.0 |
6.2 |
6.5 |
1.4 |
17.1 |
100.0 |
|
Virginia |
24.3 |
13.3 |
14.3 |
0.0 |
1.6 |
2.9 |
14.4 |
1.7 |
27.5 |
100.0 |
|
Washington |
12.8 |
21.4 |
9.6 |
0.0 |
3.7 |
0.0 |
11.6 |
5.5 |
35.4 |
100.0 |
|
West Virginia |
20.6 |
12.8 |
0.4 |
0.0 |
0.0 |
25.0 |
11.3 |
10.0 |
19.9 |
100.0 |
|
Wisconsin |
14.2 |
35.0 |
4.5 |
12.0 |
0.0 |
0.9 |
4.5 |
6.6 |
22.3 |
100.0 |
|
Wyoming |
38.4 |
6.6 |
12.8 |
0.0 |
4.0 |
0.0 |
18.1 |
13.4 |
6.7 |
100.0 |
|
Totals |
21.4 |
17.0 |
10.7 |
9.0 |
8.3 |
7.5 |
7.0 |
4.4 |
14.7 |
100.0 |
Source: Congressional Research Service (CRS) based on data from the U.S. Department of Health and Human Services (HHS).
Note: Excludes TANF funds used in the territories Table B-2. Uses of FY2018 TANF and MOE Funds by Category as a Percentage of Total Federal TANF and State MOE
Spending
Emer-
Work,
gency
Other
Education
Refund-
Pre-
Short-
Benefits
Child
and
able Tax
K/Head
Child
Admin-
Term
and
State
Assistance
Care
Training
Credits
Start
Welfare
istration
Benefits
Services
Totals
Alabama
11.1%
3.2%
3.4%
0.0%
12.1%
22.1%
10.6%
18.7%
18.9%
100.0%
Alaska
45.3
19.6
9.5
0.0
0.0
0.0
9.0
0.3
16.3
100.0
Arizona
12.5
0.8
0.1
0.0
0.0
68.0
5.8
2.8
10.0
100.0
Arkansas
2.5
9.4
8.9
0.0
65.6
0.2
8.0
2.5
3.0
100.0
California
35.3
11.3
27.0
0.0
0.0
0.0
8.1
3.9
14.4
100.0
Colorado
14.7
4.7
2.8
20.5
16.3
12.1
6.3
5.4
17.2
100.0
Connecticut
10.1
8.0
2.4
11.3
15.3
12.5
7.2
4.0
29.2
100.0
Delaware
11.9
65.6
3.3
0.0
0.0
0.0
3.0
2.3
14.0
100.0
District of Columbia
39.5
20.4
10.3
0.0
0.0
0.0
3.4
23.3
3.1
100.0
Florida
17.0
33.7
4.6
0.0
0.0
28.6
7.4
0.1
8.5
100.0
Georgia
19.5
4.5
2.2
0.0
0.0
50.6
4.0
1.0
18.3
100.0
Hawai
14.4
5.6
20.7
0.0
0.1
0.3
6.8
2.9
49.3
100.0
Idaho
16.6
27.5
5.6
0.0
3.0
3.0
15.7
25.5
3.0
100.0
Il inois
2.8
51.9
1.7
5.8
9.3
21.2
0.0
0.1
7.3
100.0
Indiana
3.6
28.6
20.2
6.6
0.0
2.3
5.8
0.1
32.9
100.0
Iowa
15.9
27.4
5.0
12.3
0.0
26.3
2.8
0.1
10.3
100.0
Kansas
7.9
4.0
0.6
30.2
9.2
14.9
6.9
0.0
26.3
100.0
Kentucky
65.8
13.8
11.1
0.0
0.0
0.0
4.3
0.0
5.0
100.0
Louisiana
8.7
4.9
14.6
6.0
20.2
16.7
8.2
5.2
15.5
100.0
Maine
26.0
14.0
10.6
6.5
0.6
7.2
4.4
4.2
26.5
100.0
CRS-20
Emer-
Work,
gency
Other
Education
Refund-
Pre-
Short-
Benefits
Child
and
able Tax
K/Head
Child
Admin-
Term
and
State
Assistance
Care
Training
Credits
Start
Welfare
istration
Benefits
Services
Totals
Maryland
22.3
1.5
5.6
30.5
11.6
5.2
4.4
8.6
10.3
100.0
Massachusetts
18.0
30.9
15.4
15.8
0.0
0.5
3.5
9.7
6.2
100.0
Michigan
12.0
2.0
0.3
3.4
13.3
7.0
3.8
4.7
53.5
100.0
Minnesota
15.2
27.7
10.9
27.1
1.0
0.0
9.7
4.4
3.9
100.0
Mississippi
5.4
1.3
21.0
0.0
0.0
15.4
12.1
0.0
44.8
100.0
Missouri
8.6
11.7
18.6
0.0
0.0
31.7
1.9
18.4
9.1
100.0
Montana
42.2
15.8
6.6
0.0
0.0
4.1
7.9
4.6
18.7
100.0
Nebraska
25.0
21.4
11.5
32.5
0.0
4.0
4.8
0.1
0.7
100.0
Nevada
37.0
16.1
1.4
0.0
0.0
15.1
7.9
2.6
19.8
100.0
New Hampshire
36.3
5.4
9.1
0.0
0.0
6.3
13.3
8.5
21.0
100.0
New Jersey
6.0
12.2
5.9
25.6
40.2
0.0
3.8
1.1
5.2
100.0
New Mexico
22.5
12.7
7.7
29.2
16.7
0.4
2.0
1.2
7.8
100.0
New York
27.7
10.7
2.4
26.0
9.3
4.6
7.8
5.8
5.7
100.0
North Carolina
6.2
36.3
0.9
0.0
20.2
20.8
7.5
0.9
7.2
100.0
North Dakota
9.1
2.5
9.0
0.0
0.0
66.6
9.9
0.0
2.8
100.0
Ohio
20.9
35.9
8.0
0.0
0.0
1.1
9.8
4.8
19.6
100.0
Oklahoma
20.1
26.7
6.4
0.0
8.2
9.8
5.9
2.2
20.8
100.0
Oregon
30.2
4.0
6.0
1.2
3.1
5.3
14.8
11.6
23.8
100.0
Pennsylvania
14.5
41.4
8.9
0.0
15.3
0.0
6.4
1.3
12.2
100.0
Rhode Island
15.2
24.1
5.9
13.5
0.0
13.9
5.3
14.8
7.3
100.0
South Carolina
32.1
2.5
20.3
0.0
16.0
3.1
11.5
0.0
14.6
100.0
South Dakota
46.2
2.5
10.8
0.0
0.0
14.9
6.2
10.6
8.9
100.0
CRS-21
Emer-
Work,
gency
Other
Education
Refund-
Pre-
Short-
Benefits
Child
and
able Tax
K/Head
Child
Admin-
Term
and
State
Assistance
Care
Training
Credits
Start
Welfare
istration
Benefits
Services
Totals
Tennessee
13.3
0.0
5.5
0.0
62.1
0.0
19.0
0.0
0.1
100.0
Texas
6.2
0.0
9.8
0.0
39.5
27.9
9.0
0.4
7.2
100.0
Utah
15.9
19.7
19.1
0.0
6.5
3.2
11.6
2.5
21.5
100.0
Vermont
15.2
32.0
2.1
19.6
0.0
6.2
6.5
1.4
17.1
100.0
Virginia
24.3
13.3
14.3
0.0
1.6
2.9
14.4
1.7
27.5
100.0
Washington
12.8
21.4
9.6
0.0
3.7
0.0
11.6
5.5
35.4
100.0
West Virginia
20.6
12.8
0.4
0.0
0.0
25.0
11.3
10.0
19.9
100.0
Wisconsin
14.2
35.0
4.5
12.0
0.0
0.9
4.5
6.6
22.3
100.0
Wyoming
38.4
6.6
12.8
0.0
4.0
0.0
18.1
13.4
6.7
100.0
Totals
21.4
17.0
10.7
9.0
8.3
7.5
7.0
4.4
14.7
100.0
Source: Congressional Research Service (CRS) based on data from the U.S. Department of Health and Human Services (HHS). Note: Excludes TANF funds used in the territories and in tribal TANF programs.
CRS-22
The Temporary Assistance for Needy Families (TANF) Block Grant: FAQs
and in tribal TANF programs.
Table B-3. Unspent TANF Funds at the End of FY2018
(September 30, 2018, in mil ions of dol ars)
Obligated But
Unobligated and
State
Not Spent
Unspent
Alabama
$0.0
$86.4
Alaska
0.0
36.3
Arizona
0.0
49.4
Arkansas
20.4
53.4
California
257.8
0.0
Colorado
0.0
104.5
Connecticut
0.0
0.0
Delaware
0.6
14.1
District of Columbia
0.0
48.7
Florida
15.9
0.0
Georgia
10.7
66.8
Hawai
20.7
280.6
Idaho
0.0
13.8
Il inois
0.0
0.0
Indiana
13.7
50.8
Iowa
0.7
0.0
Kansas
2.0
73.8
Kentucky
0.0
63.8
Louisiana
9.5
0.0
Maine
14.2
130.8
Maryland
0.0
8.6
Massachusetts
0.0
0.0
Michigan
0.0
56.1
Minnesota
0.0
58.0
Mississippi
0.0
8.4
Missouri
0.0
5.3
Montana
0.0
15.6
Nebraska
0.0
70.4
Nevada
0.0
32.8
New Hampshire
0.0
55.4
Congressional Research Service
23
The Temporary Assistance for Needy Families (TANF) Block Grant: FAQs
Obligated But
Unobligated and
State
Not Spent
Unspent
New Jersey
10.9
11.1
New Mexico
0.0
88.7
New York
34.1
513.3
North Carolina
51.1
0.0
North Dakota
1.9
0.0
Ohio
542.3
0.5
Oklahoma
134.5
0.0
Oregon
0.0
13.8
Pennsylvania
77.4
430.7
Rhode Island
0.0
16.8
South Carolina
0.0
0.0
South Dakota
0.0
19.6
Tennessee
0.0
570.7
Texas
204.9
123.5
Utah
0.0
60.6
Vermont
0.0
0.0
Virginia
6.9
133.9
Washington
0.0
48.4
West Virginia
0.0
74.6
Wisconsin
0.0
175.6
Wyoming
4.5
25.4
Totals
1,434.9
3,691.1
Source: Congressional Research Service (CRS), based on data from the U.S. Department of Health and Human Services (HHS). Note: Excludes TANF funds used in the territories (September 30, 2018, in millions of dollars)
|
State |
Obligated But Not Spent |
|
|
Alabama |
$0.0 |
$86.4 |
|
Alaska |
0.0 |
36.3 |
|
Arizona |
0.0 |
49.4 |
|
Arkansas |
20.4 |
53.4 |
|
California |
257.8 |
0.0 |
|
Colorado |
0.0 |
104.5 |
|
Connecticut |
0.0 |
0.0 |
|
Delaware |
0.6 |
14.1 |
|
District of Columbia |
0.0 |
48.7 |
|
Florida |
15.9 |
0.0 |
|
Georgia |
10.7 |
66.8 |
|
Hawaii |
20.7 |
280.6 |
|
Idaho |
0.0 |
13.8 |
|
Illinois |
0.0 |
0.0 |
|
Indiana |
13.7 |
50.8 |
|
Iowa |
0.7 |
0.0 |
|
Kansas |
2.0 |
73.8 |
|
Kentucky |
0.0 |
63.8 |
|
Louisiana |
9.5 |
0.0 |
|
Maine |
14.2 |
130.8 |
|
Maryland |
0.0 |
8.6 |
|
Massachusetts |
0.0 |
0.0 |
|
Michigan |
0.0 |
56.1 |
|
Minnesota |
0.0 |
58.0 |
|
Mississippi |
0.0 |
8.4 |
|
Missouri |
0.0 |
5.3 |
|
Montana |
0.0 |
15.6 |
|
Nebraska |
0.0 |
70.4 |
|
Nevada |
0.0 |
32.8 |
|
New Hampshire |
0.0 |
55.4 |
|
New Jersey |
10.9 |
11.1 |
|
New Mexico |
0.0 |
88.7 |
|
New York |
34.1 |
513.3 |
|
North Carolina |
51.1 |
0.0 |
|
North Dakota |
1.9 |
0.0 |
|
Ohio |
542.3 |
0.5 |
|
Oklahoma |
134.5 |
0.0 |
|
Oregon |
0.0 |
13.8 |
|
Pennsylvania |
77.4 |
430.7 |
|
Rhode Island |
0.0 |
16.8 |
|
South Carolina |
0.0 |
0.0 |
|
South Dakota |
0.0 |
19.6 |
|
Tennessee |
0.0 |
570.7 |
|
Texas |
204.9 |
123.5 |
|
Utah |
0.0 |
60.6 |
|
Vermont |
0.0 |
0.0 |
|
Virginia |
6.9 |
133.9 |
|
Washington |
0.0 |
48.4 |
|
West Virginia |
0.0 |
74.6 |
|
Wisconsin |
0.0 |
175.6 |
|
Wyoming |
4.5 |
25.4 |
|
Totals |
1,434.9 |
3,691.1 |
Source: Congressional Research Service (CRS), based on data from the U.S. Department of Health and Human Services (HHS).
Note: Excludes TANF funds used in the territories and in tribal TANF programs.
and in tribal TANF programs.
Table B-4. Number of Families, Recipients, Children, and Adults Receiving TANF
Assistance by StateJurisdiction, September 2019
Jurisdiction
Families
Recipients
Children
Adults
Alabama
7,687
17,453
14,340
3,113
Alaska
2,245
5,876
4,088
1,788
Arizona
7,010
14,003
11,511
2,492
Congressional Research Service
24
The Temporary Assistance for Needy Families (TANF) Block Grant: FAQs
Jurisdiction
Families
Recipients
Children
Adults
Arkansas
2,357
5,296
4,006
1,290
California
367,313
1,186,031
834,509
351,522
Colorado
14,226
35,165
25,631
9,534
Connecticut
7,724
15,857
11,568
4,289
Delaware
3,249
9,060
5,413
3,647
District of Columbia
7,745
22,316
16,169
6,147
Florida
38,093
60,050
51,103
8,947
Georgia
8,837
16,202
15,214
988
Guam
439
974
826
148
Hawai
4,029
11,005
7,829
3,176
Idaho
2,043
2,946
2,859
87
Il inois
10,874
21,635
19,449
2,186
Indiana
5,164
10,425
9,356
1,069
Iowa
8,922
21,527
16,498
5,029
Kansas
4,039
4,039
2,080
1,959
Kentucky
16,586
33,282
29,002
4,280
Louisiana
4,726
11,496
9,619
1,877
Maine
14,634
49,039
30,601
18,438
Maryland
16,469
39,936
29,814
10,122
Massachusetts
50,166
134,451
95,321
39,130
Michigan
10,794
27,295
22,311
4,984
Minnesota
15,399
36,303
28,132
8,171
Mississippi
3,083
5,863
4,864
999
Missouri
9,760
22,622
17,343
5,279
Montana
3,236
7,785
6,049
1,736
Nebraska
4,364
10,775
9,065
1,710
Nevada
8,042
20,194
15,297
4,897
New Hampshire
5,206
12,363
9,028
3,335
New Jersey
8,857
20,115
15,669
4,446
New Mexico
10,087
25,027
18,877
6,150
New York
113,971
293,343
205,260
88,083
North Carolina
13,064
21,922
20,157
1,765
North Dakota
939
2,325
1,986
339
Ohio
51,140
92,366
83,662
8,704
Oklahoma
5,949
13,048
11,389
1,659
Oregon
36,971
108,967
70,854
38,113
Pennsylvania
39,746
97,743
73,234
24,509
Congressional Research Service
25
The Temporary Assistance for Needy Families (TANF) Block Grant: FAQs
Jurisdiction
Families
Recipients
Children
Adults
Puerto Rico
4,475
12,279
7,625
4,654
Rhode Island
4,002
9,809
7,187
2,622
South Carolina
7,649
16,922
14,339
2,583
South Dakota
2,923
5,741
5,329
412
Tennessee
19,221
41,313
33,537
7,776
Texas
22,821
49,308
42,670
6,638
Utah
3,170
7,448
5,572
1,876
Vermont
2,669
6,031
4,369
1,662
Virgin Islands
96
318
222
96
Virginia
19,875
35,582
27,876
7,706
Washington
36,023
86,306
59,713
26,593
West Virginia
6,331
12,481
10,442
2,039
Wisconsin
15,122
32,503
27,173
5,330
Wyoming
504
1,179
913
266
Totals
1,090,066
2,863,340
2,106,950
756,390
Source: Congressional Research Service (CRS), based on data from the U.S. Department of Health and Human Services (HHS). Notes: TANF cash assistance caseload includes families receiving , September 2018
|
State |
Families |
Recipients |
Children |
Adults |
|
Alabama |
8,182 |
18,425 |
15,032 |
3,393 |
|
Alaska |
2,571 |
6,815 |
4,732 |
2,083 |
|
Arizona |
7,372 |
15,106 |
12,084 |
3,022 |
|
Arkansas |
2,859 |
6,357 |
4,767 |
1,590 |
|
California |
409,043 |
1,331,457 |
940,730 |
390,727 |
|
Colorado |
12,502 |
32,692 |
22,727 |
9,965 |
|
Connecticut |
8,964 |
18,713 |
13,545 |
5,168 |
|
Delaware |
3,761 |
10,450 |
6,272 |
4,178 |
|
District of Columbia |
5,840 |
16,632 |
12,546 |
4,086 |
|
Florida |
41,469 |
65,627 |
56,117 |
9,510 |
|
Georgia |
10,484 |
20,246 |
18,353 |
1,893 |
|
Guam |
491 |
1,083 |
929 |
154 |
|
Hawaii |
4,274 |
11,653 |
8,294 |
3,359 |
|
Idaho |
2,046 |
2,996 |
2,912 |
84 |
|
Illinois |
11,048 |
21,810 |
19,689 |
2,121 |
|
Indiana |
6,048 |
12,053 |
10,982 |
1,071 |
|
Iowa |
9,650 |
23,295 |
17,746 |
5,549 |
|
Kansas |
4,360 |
4,359 |
2,619 |
1,740 |
|
Kentucky |
18,774 |
37,748 |
32,695 |
5,053 |
|
Louisiana |
5,402 |
13,292 |
11,007 |
2,285 |
|
Maine |
17,367 |
57,543 |
35,301 |
22,242 |
|
Maryland |
17,352 |
42,996 |
32,025 |
10,971 |
|
Massachusetts |
50,270 |
124,630 |
85,801 |
38,829 |
|
Michigan |
12,338 |
30,453 |
24,978 |
5,475 |
|
Minnesota |
16,973 |
40,370 |
31,246 |
9,124 |
|
Mississippi |
4,040 |
7,907 |
6,399 |
1,508 |
|
Missouri |
10,761 |
24,687 |
19,063 |
5,624 |
|
Montana |
3,691 |
9,156 |
7,010 |
2,146 |
|
Nebraska |
4,832 |
11,945 |
9,954 |
1,991 |
|
Nevada |
9,023 |
22,836 |
17,191 |
5,645 |
|
New Hampshire |
5,257 |
12,575 |
9,081 |
3,494 |
|
New Jersey |
10,326 |
23,089 |
18,000 |
5,089 |
|
New Mexico |
10,632 |
26,529 |
20,122 |
6,407 |
|
New York |
122,363 |
313,143 |
221,544 |
91,599 |
|
North Carolina |
14,574 |
25,263 |
22,791 |
2,472 |
|
North Dakota |
984 |
2,453 |
2,072 |
381 |
|
Ohio |
42,549 |
75,664 |
69,415 |
6,249 |
|
Oklahoma |
6,176 |
13,696 |
11,958 |
1,738 |
|
Oregon |
40,932 |
120,311 |
77,812 |
42,499 |
|
Pennsylvania |
45,022 |
111,572 |
83,045 |
28,527 |
|
Puerto Rico |
4,992 |
13,559 |
8,411 |
5,148 |
|
Rhode Island |
4,197 |
9,954 |
7,274 |
2,680 |
|
South Carolina |
8,314 |
18,326 |
15,449 |
2,877 |
|
South Dakota |
2,952 |
5,944 |
5,489 |
455 |
|
Tennessee |
20,951 |
45,131 |
36,178 |
8,953 |
|
Texas |
26,109 |
56,501 |
49,307 |
7,194 |
|
Utah |
3,546 |
8,438 |
6,290 |
2,148 |
|
Vermont |
2,918 |
6,599 |
4,703 |
1,896 |
|
Virgin Islands |
160 |
496 |
334 |
162 |
|
Virginia |
20,513 |
35,157 |
27,510 |
7,647 |
|
Washington |
37,270 |
88,286 |
60,717 |
27,569 |
|
West Virginia |
6,572 |
12,845 |
10,768 |
2,077 |
|
Wisconsin |
15,740 |
34,089 |
28,275 |
5,814 |
|
Wyoming |
499 |
1,142 |
882 |
260 |
|
Totals |
1,175,335 |
3,104,094 |
2,280,173 |
823,921 |
Source: Congressional Research Service (CRS), based on data from the U.S. Department of Health and Human Services (HHS).
Notes: TANF cash assistance caseload includes families receiving assistance in state-funded programs counted toward the TANF maintenance of effort (MOE) requirement.
Table B-5. Number of Needy Families with Children Receiving Assistance by State
by Jurisdiction, September of Selected Years
| |||||||
|
State |
1994 |
2010 |
2017 |
2018 |
1994 |
2010 |
2017 |
|
Alabama |
48,752 |
23,052 |
9,326 |
8,182 |
-83.2 |
-64.5 |
-12.3 |
|
Alaska |
12,450 |
3,507 |
3,093 |
2,571 |
-79.3 |
-26.7 |
-16.9 |
|
Arizona |
72,728 |
18,774 |
8,222 |
7,372 |
-89.9 |
-60.7 |
-10.3 |
|
Arkansas |
25,298 |
8,469 |
3,072 |
2,859 |
-88.7 |
-66.2 |
-6.9 |
|
California |
916,795 |
590,121 |
511,311 |
409,043 |
-55.4 |
-30.7 |
-20.0 |
|
Colorado |
40,544 |
11,707 |
16,646 |
12,502 |
-69.2 |
6.8 |
-24.9 |
|
Connecticut |
60,336 |
16,848 |
9,798 |
8,964 |
-85.1 |
-46.8 |
-8.5 |
|
Delaware |
11,408 |
5,508 |
3,873 |
3,761 |
-67.0 |
-31.7 |
-2.9 |
|
District of Columbia |
27,320 |
8,547 |
3,124 |
5,840 |
-78.6 |
-31.7 |
86.9 |
|
Florida |
239,702 |
57,742 |
45,027 |
41,469 |
-82.7 |
-28.2 |
-7.9 |
|
Georgia |
141,596 |
20,133 |
10,399 |
10,484 |
-92.6 |
-47.9 |
0.8 |
|
Guam |
2,089 |
1,276 |
541 |
491 |
-76.5 |
-61.5 |
-9.2 |
|
Hawaii |
21,312 |
9,953 |
4,937 |
4,274 |
-79.9 |
-57.1 |
-13.4 |
|
Idaho |
8,635 |
1,820 |
1,928 |
2,046 |
-76.3 |
12.4 |
6.1 |
|
Illinois |
241,290 |
24,337 |
12,613 |
11,048 |
-95.4 |
-54.6 |
-12.4 |
|
Indiana |
72,654 |
36,062 |
6,962 |
6,048 |
-91.7 |
-83.2 |
-13.1 |
|
Iowa |
39,137 |
21,548 |
10,694 |
9,650 |
-75.3 |
-55.2 |
-9.8 |
|
Kansas |
29,524 |
15,554 |
4,462 |
4,360 |
-85.2 |
-72.0 |
-2.3 |
|
Kentucky |
78,720 |
30,875 |
20,785 |
18,774 |
-76.2 |
-39.2 |
-9.7 |
|
Louisiana |
84,162 |
10,849 |
5,521 |
5,402 |
-93.6 |
-50.2 |
-2.2 |
|
Maine |
22,322 |
15,377 |
18,452 |
17,367 |
-22.2 |
12.9 |
-5.9 |
|
Maryland |
80,266 |
25,110 |
18,611 |
17,352 |
-78.4 |
-30.9 |
-6.8 |
|
Massachusetts |
108,985 |
49,836 |
51,196 |
50,270 |
-53.9 |
0.9 |
-1.8 |
|
Michigan |
215,873 |
67,241 |
13,846 |
12,338 |
-94.3 |
-81.7 |
-10.9 |
|
Minnesota |
59,987 |
24,574 |
18,519 |
16,973 |
-71.7 |
-30.9 |
-8.3 |
|
Mississippi |
55,232 |
11,895 |
4,891 |
4,040 |
-92.7 |
-66.0 |
-17.4 |
|
Missouri |
91,875 |
39,262 |
12,452 |
10,761 |
-88.3 |
-72.6 |
-13.6 |
|
Montana |
11,416 |
3,686 |
4,517 |
3,691 |
-67.7 |
0.1 |
-18.3 |
|
Nebraska |
15,435 |
8,702 |
5,262 |
4,832 |
-68.7 |
-44.5 |
-8.2 |
|
Nevada |
14,620 |
10,612 |
9,828 |
9,023 |
-38.3 |
-15.0 |
-8.2 |
|
New Hampshire |
11,398 |
6,175 |
4,884 |
5,257 |
-53.9 |
-14.9 |
7.6 |
|
New Jersey |
122,376 |
34,516 |
12,640 |
10,326 |
-91.6 |
-70.1 |
-18.3 |
|
New Mexico |
34,535 |
21,223 |
11,066 |
10,632 |
-69.2 |
-49.9 |
-3.9 |
|
New York |
461,751 |
154,936 |
132,675 |
122,363 |
-73.5 |
-21.0 |
-7.8 |
|
North Carolina |
129,258 |
23,705 |
16,108 |
14,574 |
-88.7 |
-38.5 |
-9.5 |
|
North Dakota |
5,410 |
1,996 |
1,105 |
984 |
-81.8 |
-50.7 |
-11.0 |
|
Ohio |
244,099 |
105,140 |
54,161 |
42,549 |
-82.6 |
-59.5 |
-21.4 |
|
Oklahoma |
46,572 |
9,388 |
6,797 |
6,176 |
-86.7 |
-34.2 |
-9.1 |
|
Oregon |
40,504 |
31,751 |
43,754 |
40,932 |
1.1 |
28.9 |
-6.4 |
|
Pennsylvania |
212,457 |
53,274 |
50,615 |
45,022 |
-78.8 |
-15.5 |
-11.1 |
|
Puerto Rico |
57,337 |
13,371 |
7,000 |
4,992 |
-91.3 |
-62.7 |
-28.7 |
|
Rhode Island |
22,776 |
6,758 |
4,466 |
4,197 |
-81.6 |
-37.9 |
-6.0 |
|
South Carolina |
50,430 |
19,347 |
8,672 |
8,314 |
-83.5 |
-57.0 |
-4.1 |
|
South Dakota |
6,601 |
3,291 |
3,030 |
2,952 |
-55.3 |
-10.3 |
-2.6 |
|
Tennessee |
109,678 |
62,714 |
24,562 |
20,951 |
-80.9 |
-66.6 |
-14.7 |
|
Texas |
284,973 |
51,931 |
28,839 |
26,109 |
-90.8 |
-49.7 |
-9.5 |
|
Utah |
17,505 |
6,646 |
4,013 |
3,546 |
-79.7 |
-46.6 |
-11.6 |
|
Vermont |
9,761 |
3,256 |
3,371 |
2,918 |
-70.1 |
-10.4 |
-13.4 |
|
Virgin Islands |
1,146 |
537 |
197 |
160 |
-86.0 |
-70.2 |
-18.8 |
|
Virginia |
74,257 |
37,448 |
22,232 |
20,513 |
-72.4 |
-45.2 |
-7.7 |
|
Washington |
101,542 |
70,200 |
35,284 |
37,270 |
-63.3 |
-46.9 |
5.6 |
|
West Virginia |
40,279 |
10,496 |
7,113 |
6,572 |
-83.7 |
-37.4 |
-7.6 |
|
Wisconsin |
75,086 |
24,746 |
16,318 |
15,740 |
-79.0 |
-36.4 |
-3.5 |
|
Wyoming |
5,351 |
318 |
513 |
499 |
-90.7 |
56.9 |
-2.7 |
|
Totals |
5,015,545 |
1,926,140 |
1,349,323 |
1,175,335 |
-76.6 |
-39.0 |
-12.9 |
Source: Congressional Research Service (CRS), based on data from the U.S. Department of Health and Human Services (HHS).
Notes: Data for Puerto Rico are unavailable for September 2017. Total change excludes data for Puerto Rico for all years. Caseload data for 2000 through 2017 include those families in Separate State Programs with expenditures countable toward the TANF maintenance of effort (MOE) requirement.
countable toward the TANF maintenance of effort (MOE) requirement.
Table B-6. TANF Assistance Families by Number of Parents by State: September 2018
| ||||||||
|
State |
Single Parent |
Two Parent |
No Parent |
Total Fami-lies |
Single Parent |
Two Parent |
No Parent |
Total Families |
|
Alabama |
3,272 |
42 |
4,868 |
8,182 |
40.0% |
0.5% |
59.5% |
100.0% |
|
Alaska |
1,510 |
252 |
809 |
2,571 |
58.7 |
9.8 |
31.5 |
100.0 |
|
Arizona |
2,718 |
114 |
4,540 |
7,372 |
36.9 |
1.5 |
61.6 |
100.0 |
|
Arkansas |
1,462 |
59 |
1,338 |
2,859 |
51.1 |
2.1 |
46.8 |
100.0 |
|
California |
251,231 |
27,704 |
130,108 |
409,043 |
61.4 |
6.8 |
31.8 |
100.0 |
|
Colorado |
9,331 |
0 |
3,171 |
12,502 |
74.6 |
0.0 |
25.4 |
100.0 |
|
Connecticut |
2,942 |
0 |
6,022 |
8,964 |
32.8 |
0.0 |
67.2 |
100.0 |
|
Delaware |
994 |
9 |
2,758 |
3,761 |
26.4 |
0.2 |
73.3 |
100.0 |
|
District of Columbia |
4,086 |
0 |
1,754 |
5,840 |
70.0 |
0.0 |
30.0 |
100.0 |
|
Florida |
5,287 |
215 |
35,967 |
41,469 |
12.7 |
0.5 |
86.7 |
100.0 |
|
Georgia |
1,982 |
0 |
8,502 |
10,484 |
18.9 |
0.0 |
81.1 |
100.0 |
|
Guam |
86 |
27 |
378 |
491 |
17.5 |
5.5 |
77.0 |
100.0 |
|
Hawaii |
2,577 |
611 |
1,086 |
4,274 |
60.3 |
14.3 |
25.4 |
100.0 |
|
Idaho |
84 |
0 |
1,962 |
2,046 |
4.1 |
0.0 |
95.9 |
100.0 |
|
Illinois |
2,199 |
0 |
8,849 |
11,048 |
19.9 |
0.0 |
80.1 |
100.0 |
|
Indiana |
1,366 |
40 |
4,642 |
6,048 |
22.6 |
0.7 |
76.8 |
100.0 |
|
Iowa |
4,682 |
390 |
4,578 |
9,650 |
48.5 |
4.0 |
47.4 |
100.0 |
|
Kansas |
1,806 |
206 |
2,348 |
4,360 |
41.4 |
4.7 |
53.9 |
100.0 |
|
Kentucky |
4,308 |
382 |
14,084 |
18,774 |
22.9 |
2.0 |
75.0 |
100.0 |
|
Louisiana |
2,268 |
0 |
3,134 |
5,402 |
42.0 |
0.0 |
58.0 |
100.0 |
|
Maine |
9,178 |
6,529 |
1,660 |
17,367 |
52.8 |
37.6 |
9.6 |
100.0 |
|
Maryland |
10,651 |
281 |
6,420 |
17,352 |
61.4 |
1.6 |
37.0 |
100.0 |
|
Massachusetts |
34,435 |
3,029 |
12,806 |
50,270 |
68.5 |
6.0 |
25.5 |
100.0 |
|
Michigan |
4,646 |
0 |
7,692 |
12,338 |
37.7 |
0.0 |
62.3 |
100.0 |
|
Minnesota |
9,185 |
0 |
7,788 |
16,973 |
54.1 |
0.0 |
45.9 |
100.0 |
|
Mississippi |
1,481 |
0 |
2,559 |
4,040 |
36.7 |
0.0 |
63.3 |
100.0 |
|
Missouri |
6,301 |
0 |
4,460 |
10,761 |
58.6 |
0.0 |
41.4 |
100.0 |
|
Montana |
1,792 |
282 |
1,617 |
3,691 |
48.6 |
7.6 |
43.8 |
100.0 |
|
Nebraska |
1,984 |
0 |
2,848 |
4,832 |
41.1 |
0.0 |
58.9 |
100.0 |
|
Nevada |
4,161 |
680 |
4,182 |
9,023 |
46.1 |
7.5 |
46.3 |
100.0 |
|
New Hampshire |
3,304 |
37 |
1,916 |
5,257 |
62.8 |
0.7 |
36.4 |
100.0 |
|
New Jersey |
5,745 |
59 |
4,522 |
10,326 |
55.6 |
0.6 |
43.8 |
100.0 |
|
New Mexico |
5,057 |
675 |
4,900 |
10,632 |
47.6 |
6.3 |
46.1 |
100.0 |
|
New York |
77,545 |
2,508 |
42,310 |
122,363 |
63.4 |
2.0 |
34.6 |
100.0 |
|
North Carolina |
1,772 |
24 |
12,778 |
14,574 |
12.2 |
0.2 |
87.7 |
100.0 |
|
North Dakota |
381 |
0 |
603 |
984 |
38.7 |
0.0 |
61.3 |
100.0 |
|
Ohio |
5,322 |
345 |
36,882 |
42,549 |
12.5 |
0.8 |
86.7 |
100.0 |
|
Oklahoma |
1,738 |
0 |
4,438 |
6,176 |
28.1 |
0.0 |
71.9 |
100.0 |
|
Oregon |
27,855 |
6,521 |
6,556 |
40,932 |
68.1 |
15.9 |
16.0 |
100.0 |
|
Pennsylvania |
27,889 |
471 |
16,662 |
45,022 |
61.9 |
1.0 |
37.0 |
100.0 |
|
Puerto Rico |
4,490 |
251 |
251 |
4,992 |
89.9 |
5.0 |
5.0 |
100.0 |
|
Rhode Island |
2,959 |
164 |
1,074 |
4,197 |
70.5 |
3.9 |
25.6 |
100.0 |
|
South Carolina |
2,877 |
0 |
5,437 |
8,314 |
34.6 |
0.0 |
65.4 |
100.0 |
|
South Dakota |
455 |
0 |
2,497 |
2,952 |
15.4 |
0.0 |
84.6 |
100.0 |
|
Tennessee |
8,052 |
224 |
12,675 |
20,951 |
38.4 |
1.1 |
60.5 |
100.0 |
|
Texas |
7,194 |
0 |
18,915 |
26,109 |
27.6 |
0.0 |
72.4 |
100.0 |
|
Utah |
1,564 |
0 |
1,982 |
3,546 |
44.1 |
0.0 |
55.9 |
100.0 |
|
Vermont |
1,322 |
277 |
1,319 |
2,918 |
45.3 |
9.5 |
45.2 |
100.0 |
|
Virgin Islands |
131 |
0 |
29 |
160 |
81.9 |
0.0 |
18.1 |
100.0 |
|
Virginia |
11,114 |
0 |
9,399 |
20,513 |
54.2 |
0.0 |
45.8 |
100.0 |
|
Washington |
17,561 |
7,313 |
12,396 |
37,270 |
47.1 |
19.6 |
33.3 |
100.0 |
|
West Virginia |
1,572 |
0 |
5,000 |
6,572 |
23.9 |
0.0 |
76.1 |
100.0 |
|
Wisconsin |
4,956 |
192 |
10,592 |
15,740 |
31.5 |
1.2 |
67.3 |
100.0 |
|
Wyoming |
223 |
19 |
257 |
499 |
44.7 |
3.8 |
51.5 |
100.0 |
|
Totals |
609,083 |
59,932 |
506,320 |
1,175,335 |
51.8 |
5.1 |
43.1 |
100.0 |
Source: Congressional Research Service (CRS), based on data from the U.S. Department of Health and Human Services (HHS).
Notes: TANF cash assistance caseload includes families receiving assistance in state-funded programs counted toward the TANF maintenance of effort (MOE) requirement.
Author Contact Information
Acknowledgments
Jameson Carter and Mariam Ghavalyan updated information in this report. Karen Lynch contributed to the discussion of the TANF funding lapse and legislation to fund TANF in FY2019. Amber Wilhelm and Calvin DeSouza produced this report'’s data visualizations.
Disclaimer
This document was prepared by the Congressional Research Service (CRS). CRS serves as nonpartisan shared staff to congressional committees and Members of Congress. It operates solely at the behest of and under the direction of Congress. Information in a CRS Report should n ot be relied upon for purposes other than public understanding of information that has been provided by CRS to Members of Congress in
connection with CRS’s institutional role. CRS Reports, as a work of the United States Government, are not subject to copyright protection in the United States. Any CRS Report may be reproduced and distributed in its entirety without permission from CRS. However, as a CRS Report may include copyrighted images or material from a third party, you may need to obtain the permission of the copyright holder if you wish to copy or otherwise use copyrighted material.
Congressional Research Service
RL32760 · VERSION 194 · UPDATED
30 s data visualizations.
Footnotes
| 1. |
Division N, Section 302. |
| 2. |
The definition of TANF assistance is not in statute. However, because the statutory language has most TANF requirements triggered by a family receiving "assistance," the Department of Health and Human Services (HHS) regulations define assistance at 45 C.F.R. §260.31. |
| 3. |
States are not required to report to the federal government their cash assistance benefit amounts in either the TANF state plan (under Section 402 of the Social Security Act) or in annual program reports (under Section 411 of the Social Security Act). The benefit amounts shown are from the "Welfare Rules Database," maintained by the Urban Institute and funded by the Department of Health and Human Services (HHS). |
| 4. |
Some states vary their benefit amounts for other family types such as two-parent families or "child-only" cases. States also vary their benefits by other factors such as housing costs and substate geography. |
| 5. |
In 2017, the HHS poverty guidelines for the contiguous 48 states and the District of Columbia for a family of three was $1,702 per month. Higher poverty lines applied in Alaska ($2,126 per month for a family of three) and Hawaii ($1,933 per month for a family of three). |
| 6. |
Families without a work-eligible individual are excluded from the participation rate calculation. It excludes families where the parent is a nonrecipient (for example, disabled receiving Supplemental Security Income or an ineligible noncitizen) or the children in the family are being cared for by a nonparent relative (e.g., grandparent, aunt, uncle) who does not receive assistance on his or her behalf. |
| 7. |
See CRS In Focus IF10856, Temporary Assistance for Needy Families: Work Requirements. |