Members’ Representational Allowance: History and Usage
Changes from September 3, 2019 to August 13, 2020
This page shows textual changes in the document between the two versions indicated in the dates above. Textual matter removed in the later version is indicated with red strikethrough and textual matter added in the later version is indicated with blue.
Members'Members’ Representational Allowance:
August 13, 2020
History and Usage
Ida A. Brudnick
Members of the House of Representatives have one consolidated allowance, the Members’
Specialist on the Congress
Representational Allowance: History and Usage
Contents
- Introduction
- Establishment of the MRA
- Subsequent MRA Legislation
- Appropriations Acts: Administrative Provisions Related to Unexpended Balances and Deficit Reduction
- Other MRA Legislation Introduced
- Appropriations and Allocations: Timing Differences with the Overall Fiscal Year Appropriation and Individual Member Calendar Year Authorization
- Fiscal Year Appropriations: Funding History
- Individual MRAs for Members: Formula and Authorized Levels Since 1996
- 112th Congress: Resolution Reducing Individual Authorizations
- 113th Congress: Multiple Influences on Individual Authorized Levels
- 114th Congress
- 115th Congress
- 116th Congress
- Guidelines, Operations, and Sources of Regulations
- "Dear Colleague" Letters Related to the MRA
- Categories of Spending
- Statements of Disbursements: Online Publication and CSV Availability
- The MRA in Historical Practice: An Analysis of Spending in Selected Years
- Methodology
- Analysis
Figures
Tables
- Table 1. MRA Appropriations: FY1996-FY2019
- Table 2. Variation in Individual MRA Authorization Levels: 1996-2019
- Table 3. Distribution of Office-Level Spending on Select Categories: 2009-2017
- Table 4. Spending as a Percentage of Authorization: 2009-2017
- Table A-1. Examples of Legislation Introduced to Regulate, Prohibit, Authorize, Disclose, or Encourage the Use of the MRA for a Particular Purpose
- Table A-2. Examples of Legislation Introduced Regarding the Use of Unexpended Balances
- Table A-3. Examples of Legislation Introduced to Limit the MRA
Summary
Members of the House of Representatives have one consolidated allowance, the Members' Representational Allowance (MRA), with which to operate their offices. The MRA was first Representational Allowance (MRA), with which to operate their offices. The MRA was first
authorized in 1996 and was made subject to regulations and adjustments of the Committee on House Administration. Representatives have a high degree of flexibility to use the MRA to
operate their offices in a way that supports their congressional duties and responsibilities, and individual office spending may be as varied as the districts Members represent.
Over the last decade, the appropriation for the MRA
-
reached a high in FY2010 of $660.0
- decreased in FY2011, FY2012,
- increased in FY2014 (+1.9%) and remained flat in FY2015
- increased from FY2016
and - increased from FY2018
(+2.0%).
The FY2020 House-reported legislative branch appropriations bill (H.R. 2779) would provide $615.0 million, an increase of $41.4 million (+7.2%).
The reduction in the overall MRA appropriation from its FY2010 peak corresponded with a reduction to the individual MRA authorization for each Member, which is available for expenses incurred fromfro m January 3 of each year through January 2 of the following year. In the 112th112th Congress, the House agreed to H.Res. 22, which reduced the amount authorized for salaries and expenses of Member, committee, and leadership offices in 2011 and 2012. This resolution, agreed to on January 6, 2011, stated that the MRA allowances for these years may not exceed 95% of the amount established for 2010. Individual MRAs were further reduced 6.4% in 2012 and 8.2% in 2013, before increasing 1.0% in 2014 and remaining flat in 2015. The 2016 allowances increased by 1.0%. The individual 2017 allowances initially increased by 3.9% from 2016, and then by another $25,000 when the House agreed to H.Res. 411. In 2018, individual allowances were increased by $25,000. In 2019, individual allowances they were increased by 1.0%.
In 2020, the individual allowances were increased by $62,250. Information on individual office spending is published in the quarterly Statements of Disbursements of the House (SOD), which have been made available online since 2009. Beginning with disbursements covering January-March 2016, this website provides SOD information in a sortable CSV (comma-separated values) format.
In addition to recurring administrative provisions in the annual appropriations acts requiring unused amounts remaining in the MRA be used for deficit reduction or to reduce the federal debt, numerous bills and resolutions addressing the MRA have been introduced. This legislation has generally fallen into three major categories: (1) attempts to change the MRA procedure or regulate, authorize, or encourage the use of funds for a particular purpose; (2) stand-alone legislation that would govern the use of unexpended balances, including language to require these funds to go toward deficit reduction; and (3) bills that would limit limit or change the growth of overall MRA or adjustment among Members.
This report provides a history and overview of the MRA and examines spending patterns in recent years. The data exclude nonvoting Members, including Delegates and the Resident Commissioner, as well as Members who were not in Congress for the entirety of the session. Information is provided on total spending and spending for various categories, including personnel compensation; travel; rent, utilities, and communications; printing and reproduction; other services; supplies and materials; equipment; and franked mail. The data collected demonstrate that, despite variations, many Members allocate their spending in a similar manner, and spending allocation patterns have remained relatively consistent over time.
Introduction
Congressional Research Service
link to page 5 link to page 6 link to page 6 link to page 7 link to page 7 link to page 7 link to page 8 link to page 9 link to page 9 link to page 10 link to page 12 link to page 14 link to page 14 link to page 15 link to page 15 link to page 16 link to page 17 link to page 17 link to page 18 link to page 18 link to page 19 link to page 19 link to page 19 link to page 12 link to page 12 link to page 14 link to page 23 link to page 11 link to page 13 link to page 20 link to page 24 link to page 25 link to page 25 Members’ Representational Allowance: History and Usage
Contents
Introduction ................................................................................................................... 1
Most Recent Actions: Expenses Related to the Coronavirus Pandemic ............................... 2
Establishment of the MRA ............................................................................................... 2 Subsequent MRA Legislation............................................................................................ 3
Appropriations Acts: Administrative Provisions Related to Unexpended Balances and
Deficit Reduction .................................................................................................... 3
Other MRA Legislation Introduced .............................................................................. 4
Appropriations and Al ocations: Timing Differences with the Overal Fiscal Year
Appropriation and Individual Member Calendar Year Authorization ..................................... 5
Fiscal Year Appropriations: Funding History ....................................................................... 6 Individual MRAs for Members: Formula and Authorized Levels Since 1996 ............................ 8
112th Congress: Resolution Reducing Individual Authorizations ................................ 10 113th Congress: Multiple Influences on Individual Authorized Levels ......................... 10 114th Congress ................................................................................................... 11 115th Congress ................................................................................................... 11 116th Congress ................................................................................................... 12
Guidelines, Operations, and Sources of Regulations ........................................................... 13 “Dear Colleague” Letters Related to the MRA ................................................................... 13 Categories of Spending .................................................................................................. 14 Statements of Disbursements: Online Publication and CSV Availability ................................ 14 The MRA in Historical Practice: An Analysis of Spending in Selected Years .......................... 15
Methodology .......................................................................................................... 15 Analysis ................................................................................................................. 15
Figures Figure 1. MRA Funding: Current and Constant Dollars and Relationship to Overal
Funding for the House of Representatives ........................................................................ 8
Figure 2. MRA Allowances by Member: Maximum, Minimum, and Mean ............................. 10 Figure 3. Expenditures by Category, as a Percentage of Aggregate MRA Spending ................. 19
Tables Table 1. MRA Appropriations: FY1996-FY2020 .................................................................. 7 Table 2. Variation in Individual MRA Authorization Levels: 1996-2020 .................................. 9 Table 3. Distribution of Office-Level Spending on Select Categories: 2009-2019 .................... 16 Table 4. Spending as a Percentage of Authorization: 2009-2019 ........................................... 20
Table A-1. Examples of Legislation Introduced to Regulate, Prohibit, Authorize,
Disclose, or Encourage the Use of the MRA for a Particular Purpose.................................. 21
Congressional Research Service
link to page 27 link to page 27 link to page 27 link to page 25 link to page 28 Members’ Representational Allowance: History and Usage
Table A-2. Examples of Legislation Introduced Regarding the Use of Unexpended
Balances ................................................................................................................... 23
Table A-3. Examples of Legislation Introduced to Limit the MRA ........................................ 23
Appendixes Appendix. Examples of Legislation Introduced Affecting the MRA by Type .......................... 21
Contacts
Author Information ....................................................................................................... 24
Congressional Research Service
Members’ Representational Allowance: History and Usage
Introduction Congressional office spending has been a regular topic of interest to academics, interest groups, newspapers, and constituents for many years. It is a topic frequently mentioned in newspaper articles that address individual Member spending or generallygeneral y discuss financial accountability among elected officials, and it has been examined by watchdog organizations and interest groups covering congressional spending on internal operations generallygeneral y. A few scholars have also
examined how Members typicallytypical y spend their office allowancesal owances, analyzing spending within broader theories of representation.11 Individual office spending may be as varied as the districts Members represent. Factors affecting spending include the tenure or interests of the Member,
levels of casework, geography, unexpected events, and even the congressional calendar.
While Representatives have a high degree of flexibility to operate their offices in a way that supports their congressional duties and responsibilities, they must operate within a number of restrictions and regulations. The Members'’ Representational AllowanceAl owance (MRA), the allowance al owance provided to Members of the House of Representatives to operate their DC and district offices,2 2
may only support Members in their official and representational duties. It may not be used for personal or campaign purposes. Additional regulations or restrictions regarding reimbursable expenses may be promulgated by the Committee on House Administration, the Commission on Congressional Mailing Standards, also known as the Franking Commission, and the Committee on Standards of Official Conduct, and may be found in a wide variety of sources, including
statute, House rules, committee resolutions, the Members'’ Handbook,33 the Franking Manual,44 the
House Ethics Manual, "“Dear Colleague"” letters, and formal and informal guidance.5
5
This report provides a history of the MRA and overview of recent developments. It also
demonstrates actual MRA spending patterns in recent years for all al voting Members who served for a defined period.66 Spending and practices across offices and across time vary, and an examination of additional 1 Burdett Loomis and Wendy Schiller, The Contemporary Congress, 5th ed. (Belmont, CA: T hompson-Wadsworth, 2006), Ch. 7-8; Richard F. Fenno, Jr., Congressm en in Com m ittees (Boston: Little, Brown, 1973), p. 1; David Mayhew, Congress: The Electoral Connection (New Haven: Yale University Press, 1974), p. 49; Gary W. Cox and Jonathan N. Katz, “Why Did the Incumbency Advantage in the U.S. House Elections Grow?” American Journal of Political Science, vol. 40, no. 2 (May 1996), pp. 479-481; and, David C.W. Parker and Craig Goodman, “ Making a Good Impression: Resource Allocation, Home Styles, and Washington Work,” Legislative Studies Quarterly, vol. 34, no. 4 (November 2009), pp. 493-524. One study of MRA expenditures during the 106 th Congress, for example, examined the effect of a Member’s standing within the House, time in office, and plans for retirement or reelection on spending (Garry Young, “Choosing How to Represent: House Members and the Distribution of T heir Representational Allowances,” updated version of a paper presented at the Midwest Political Science Association, Chicago, April 7, 2005, pp. 15-18, available at http://home.gwu.edu/~youngg/research/Homestyle%20Choices%20v3.02.pdf). 2 For additional information on the resources available to Members of Congress, see CRS Report RL30064, Congressional Salaries and Allowances: In Brief, by Ida A. Brudnick.
3 Available at https://cha.house.gov/. 4 Available at https://cha.house.gov/. 5 Available at https://ethics.house.gov/sites/ethics.house.gov/files/documents/2008_House_Ethics_Manual.pdf. 6 Information on spending by certain Members was excluded from the observation data and summary findings because of characteristics related to the district or stat us or tenure of the Member. Nonvoting Members, including the Delegates and the Resident Commissioner, have been subject to the same expense formula as other Members since January 1, 1983 (P.L. 97-357, 96 Stat 1711, October 19, 1982), although the distance from D.C., size of population, or both, may vary greatly from other Members. Members who were not in Congress for all of a calendar year, whether the Member left Congress prior to the end of the year or entered any time after the beginning of the session, were excluded from the calculations from that year since spending for any portion may not be reflective of allocati ons for an uninterrupted year. T his limitation resulted in the following number of Members included in the data: for 2009, 429; 2010, 428; 2011, 430; 2012, 426; 2013, 428; 2014, 430; 2015, 431; 2016, 431; 2017, 426; 2018, 424; and 2019, 428.
Congressional Research Service
1
Members’ Representational Allowance: History and Usage
examination of additional Congresses would be required for a more complete picture of
Congresses would be required for a more complete picture of congressional office spending patterns.
Most Recent Actions: Expenses Related to the Coronavirus Pandemic The Coronavirus Aid, Relief, and Economic Security Act (CARES Act, P.L. 116-136, enacted March 27, 2020) provided additional funding to al ow legislative branch entities “to prevent,
prepare for, and respond to coronavirus, domestical y or international y.” Funding included $25.0 mil ion for the “House of Representatives, Salaries and Expenses.” This account funds al
activities of the House, but it does not fund salaries of Members of Congress.
Although individual MRA levels were not adjusted, Member offices were provided with additional flexibilities due to the coronavirus pandemic. On March 16, 2020, the Committee on House Administration (CHA) issued a “Dear Colleague” letter stating that, while ordinary commuting expenses are not reimbursable, staff experiencing “unique commuting expenses associated with the coronavirus” could seek reimbursement.7 CHA also “authorized Member and
Committee Offices to use their remaining LY19 funds towards unanticipated expenses for teleworking equipment, teletownhal s, and supplies. Acceptable purchases include desktop computers, laptops, tablets, docking stations, monitors, keyboards, mice, printers, multi-function printers (scanner/fax/copier/printer), toner, and cel phones for continuity of operations (COOP).”8 Offices could also use available legislative year 2020 funds. CHA also adopted new regulations governing House paid interns due to the circumstances of the pandemic, including
al owing funds to be used for interns in district offices, al owing paid interns to telework, and al owing House offices to issue paid interns House equipment such as laptops or phones.9 Face masks purchased for official business were also deemed reimbursable.10 Additional telework support, including technical assistance and training and continuity of operations (COOP) planning, was also provided by the House Chief Administrative Officer (CAO) and the House
Sergeant at Arms. In addition, the CAO “purchased several hundred plexiglass barriers of various types that wil be offered to D.C. offices at no cost,” and the purchase of additional barriers by
House offices is considered a reimbursable expense.11
Establishment of the MRA Establishment of the MRA
The MRA, which was first authorized in 1996, was preceded by multiple allowancesal owances for each
Member covering different categories of spending—including the former clerk hire allowance, al owance, official expenses allowanceal owance, and official mail allowanceal owance. The establishment of the MRA followed 7 Dear Colleague letter from the Committee on House Administration, “Update about the coronavirus: commuting expenses,” March 16, 2020. See also Dear Colleague letters of March 6 and March 11, 2020, and joint guidance from the Committee on House Administration and the Committee on Ethics issued on March 15, 2020.
8 “Use of LY19 Funds for Continuity of Operations Supplies,” March 24, 2020, available to House offices on HouseNet. 9 Dear Colleague letter from the Committee on House Administration, “Updated House Paid Internship Program Regulations and Intern T elework Policy,” May 6, 2020, and https://cha.house.gov/member-services/house-paid-internship-program.
10 Dear Colleague letter from the Chief Administrative Officer, “Availability of Hand Sanitizer and Face Coverings for Member and Committee Offices,” April 21, 2020. 11 Dear Colleague letter from the Chief Administrative Officer and the Attending Physician, “Guidelines for Modified Office Occupancy,” June 15, 2020.
Congressional Research Service
2
Members’ Representational Allowance: History and Usage
. The establishment of the MRA followed efforts by the House, dating back to the late 1970s, to move to a system of increased flexibility
and accountability for Member office operations.7
12
In September 1995, the Committee on House Administration authorized the consolidation of these allowances.8
these al owances.13 Subsequently, in November 1995, the FY1996 Legislative Branch Appropriations Act combined the separate appropriations for personal office staff, official office expenses, and mail costs into a single new appropriations heading, "Members' Representational Allowances."9“Members’ Representational Al owances.”14 According to the House Appropriations Committee report on the FY1996 billbil , the consolidation was adopted to simplify Members'’ accounting practices and allowedal owed Members to
more easily show savings achieved when they did not spend all al of their al owance.15 Subsequent legislation of their allowance.10 Subsequent legislation in 1996 further defined the MRA and made it subject to regulations and adjustments adopted by the Committee on House Administration.11 Additional 16 Additional provisions included in the FY2000 Legislative Branch Appropriations Act amended language regarding official mail and
repealed obsolete language and terms.12
17 Subsequent MRA Legislation
Appropriations Acts: Administrative Provisions Related to Unexpended Balances and Deficit Reduction
Since the MRA'’s establishment, appropriations acts funding the legislative branch have
contained—or continued, in the case of a continuing resolution—a provision requiring unused
amounts remaining in the MRA be used for deficit reduction or to reduce the federal debt.13
18
This provision was included in legislative branch appropriations billsbil s reported by the House
Appropriations Committee in FY1999 and since FY2002. In some years prior to consideration of
FY2002 funding, it was added by amendment, including
-
H.Amdt. 458 (403-21, Roll no. 415) to
H.R. 1854, 104th Congress (Legislative Branch Appropriations Act, 1996); H.Amdt. 1245H.R. 1854, 104th Congress (Legislative Branch Appropriations Act, 1996); 12 See, for example, House Administration Committee Orders 35, 38, 39, and 40 (effective May 1, 1983; August 1, 1985; March 15, 1990; and May 8, 1991, respectively). These were reprinted within the notes for 2 U.S.C. 57 in prior versions of the U.S. Code. 13 Committee Order No. 41, effective September 1, 1995. 14 P.L. 104-53, 109 Stat. 519 (November 19, 1995). 15 U.S. Congress, House Committee on Appropriations, Legislative Branch Appropriations Bill, 1996, report to accompany H.R. 1854, 104th Cong., 1st sess., H.Rept. 104-141 (Washington: GPO, 1995), p. 10. 16 P.L. 104-186, 110 Stat. 1719 (August 20, 1996); 2 U.S.C. 5341. 17 P.L. 106-57, 113 Stat. 415 (September 29, 1999). 18 T he first few laws with this provision referred to the federal deficit. A budget deficit (or surplus) is calculated based on total spending of the entire federal government less total revenue collected. Since P.L. 106-57 (September 29, 1999), these provisions have also referred to the debt, stating any amounts remaining after all payments are made “ shall be deposited in the T reasury and used for deficit reduction (or, if there is no Federal budget deficit after all such payments have been made, for reducing the Federal debt, in such manner as the Secretary of the T reasury considers appropriate).” Annual legislative branch appropriations bills with this language include P.L. 104-53, P.L. 104-197, P.L. 105-55, P.L. 105-275, P.L. 106-57, P.L. 106-554, P.L. 107-68, P.L. 108-7, P.L. 108-83, P.L. 108-447, P.L. 109-55, P.L. 110-161, P.L. 111-8, P.L. 111-68, P.L. 112-74, P.L. 113-6, P.L. 113-76, P.L. 113-235, P.L. 114-113, P.L. 115-31, P.L. 115-141, P.L. 115-244, and P.L. 116-94. T he two long-term continuing resolutions (also known as CRs) enacted during this period—P.L. 110-5 and P.L. 112-10—continued this language from prior years. T he FY2021 House-reported legislative branch appropriations bill (H.R. 7611) also continues this language. Congressional Research Service 3 link to page 25 Members’ Representational Allowance: History and Usage H.Amdt. 1245 (voice vote) to H.R. 3754, 104th, 104th Congress (Legislative Branch Appropriations Act, 1997);-
H.Amdt. 287 (voice vote) to H.R. 2209
, 105th, 105th Congress (Legislative Branch Appropriations Act, 1998); -
H.Amdt. 166 (voice vote) to H.R. 1905
, 106th, 106th Congress (Legislative Branch Appropriations Act, 2000); and, -
H.Amdt. 865 (voice vote) to H.R. 4516
, 106th, 106th Congress (Legislative Branch Appropriations Act, 2001).
Other MRA Legislation Introduced
In addition to the appropriations language, numerous billsbil s and resolutions addressing the MRA have been introduced (for examples, see tables in thethe Appendix). This legislation has generally fallengeneral y
fal en into three major categories:
- Attempts to change the MRA procedure or regulate, prohibit, authorize, disclose, or encourage the use of funds for a particular purpose.
-
Stand-alone legislation
Bills Bil s or resolutions that would limit or change the growth ofoveralloveral MRA or adjustment among Members.
MRA-related amendments have also been offered to the legislative branch appropriations bills. These include
- bil s.
These include
H.Amdt. 213, which was offered to H.R. 3219, the FY2018 legislative branch
appropriations billappropriations bil , increasing funding for the Government Accountability Office, offset by a reduction in the Members'’ RepresentationalAllowanceAl owance, which failed by voice vote. -
H.Amdt. 214, which was offered to H.R. 3219, the FY2018 legislative branch
appropriations bill, relating to the use of the Members
'’ RepresentationalAllowanceAl owance for Member security, was agreed to by voice vote. - H.Amdt. 642, which was offered to H.R. 4487, the FY2015 Legislative Branch Appropriations Act, on May 1, 2014. This amendment, which would have prohibited the use of the MRA for leased vehicles, excluding mobile district offices and short-term vehicle rentals, was not agreed to by a recorded vote (Roll no. 188).
-
H.Amdt. 1284, which was offered to H.R. 5882, the FY2013 Legislative Branch
Appropriations Act, on June 8, 2012. This amendment, which would have prohibited paid advertisements on any internet site other than an official site of the Member, leadership office, or committee involved, was not agreed to by a recorded vote (Roll no. 375).
- H.Amdt. 708, which was offered to H.R. 2551, the FY2012 Legislative Branch Appropriations Act, on July 21, 2011. The amendment, which prohibited the use of funds to make any payments from any MRA for the leasing of a vehicle in an amount that exceeds $1,000 in any month, was agreed to by voice vote. This language was included in P.L. 112-74 and subsequent legislative branch appropriations acts. H.Amdt. 709 and H.Amdt. 710, which also proposed restrictions on the MRA, failed by voice vote.
Congressional Research Service 4 Members’ Representational Allowance: History and Usage Appropriations and Allocations: Timing Differences with the Overall Fiscal Year Appropriation and Individual Member Calendar Year Authorization
Funding is provided on a fiscal year (beginning October 1) basis and a single total amount for all al Members is provided under the appropriations heading, "Members' Representational Allowances,"“Members’ Representational Al owances,” within the House account "“Salaries and Expenses"” contained in the annual legislative branch appropriations bills.
Allowance
legislative branch appropriations bil s.
Al owance or authorization levels for individual Members of the House are authorized in statute and are regulated and adjusted by the Committee on House Administration pursuant to 2 U.S.C.
4313 et seq. and House Rule X(1)(j). The individual MRAs for the 441 Members, Delegates, and the Resident Commissioner are authorized for periods that correspond closely to the sessions of
Congress—from January 3 of each year through January 2 of the following year.
In addition to the complexity involved in different time frames and split responsibilities—with the appropriation on a fiscal year determined by the Committee on Appropriations, and the authorization roughly following the calendar year as allocatedal ocated by the Committee on House Administration—the House has indicated that the total authorized level for all al MRAs may be
more than the total appropriation due to projections on spend-out rates.
Most recently, for example, the House Appropriations Committee report accompanying the FY2020 legislative branch appropriations bill bil stated that, of the amount recommended, "“Almost half of the increase is needed just to bring the appropriation more in line with currently authorized spending."14
spending.”19
A discussion of the use of prior spending patterns in the determination of MRA appropriations
levels was included in numerous House reports, particularly in the first few years of the MRA.15 20
For example, the FY1997 report accompanying the legislative branch appropriations bill bil stated,
Many Members do not expend their full allowance. That is why the Committee bill does not fully fund this account. The frugality of those Members is already projected in the bill bil presented by the Committee. Since these prospective savings are already taken in the bill, they reduce the need for appropriated funds and, therefore, contribute directly to the reduction in federal spending and consequently lower the projected deficit. If the reduction in federal spending and consequently lower the projected deficit. If the Committee bill were to fully fund the Members'’ Representational Allowance, the amount
19 U.S. Congress, House Committee on Appropriations, Legislative Branch Appropriations Bill, 2020, H.Rept. 116-64, report to accompany H.R. 2779 (Washington, GPO: 2019) p. 2. 20 U.S. Congress, House Committee on Appropriations, Legislative Branch Appropriations Bill, 1996, H.Rept. 104-141, report to accompany H.R. 1854 (Washington, GPO: 1995) p. 12; U.S. Congress, House Committee on Appropriations, Legislative Branch Appropriations Bill, 1998 , H.Rept. 105-196, report to accompany H.R. 2209 (Washington, GPO: 1997) p. 10; U.S. Congress, House Committee on Appropriations, Legislative Branch Appropriations Bill, 1999, H.Rept. 105-595, report to accompany H.R. 4112 (Washington, GPO: 1998) p. 10; U.S. Congress, House Committee on Appropriation s, Legislative Branch Appropriations Bill, 2000 , H.Rept. 106-156, report to accompany H.R. 1905 (Washington, GPO: 1999) p. 11; U.S. Congress, House Committee on Appropriations, Legislative Branch Appropriations Bill, 2001 , H.Rept. 106-635, report to accompany H.R. 4516 (Washington, GPO: 2000) p. 11; U.S. Congress, House Committee on Appropriations, Legislative Branch Appropriations Bill, 2010, H.Rept. 111-160, report to accompany H.R. 2918 (Washington, GPO: 2009) p. 8.
Congressional Research Service
5
Members’ Representational Allowance: History and Usage
Representational Allowance, the amount appropriated would have to be increased by $27 million. Thus, the account is underfunded by almost 7%.16
21
This difference was also discussed during a hearing on the FY2009 legislative branch
appropriations requests.17
22
Pursuant to law, late-arriving billsbil s may be paid for up to two years following the end of the MRA year.1823 The permissibility of payment for late-arriving billsbil s does not provide flexibility in the
timing of the obligation, a point emphasized in the Members'’ Congressional Handbook, which states: "all “al expenses incurred will wil be charged to the allowanceal owance available on the date the services
were provided or the expenses were incurred"” and the "“MRA is not transferable between years."19
”24 Fiscal Year Appropriations: Funding History
The MRA is funded in the House "“Salaries and Expenses"” account in the annual legislative
branch appropriations billsbil s. One single line-item provides funding for all Members'al Members’ MRAs.
The MRA funding level peaked at $660.0 millionmil ion in FY2010. It was subsequently reduced to $613.1 millionmil ion in FY2011 (-7.1%), and then to $573.9 millionmil ion in FY2012 (-6.4%). The FY2012 funding level was continued in the FY2013 continuing resolution (P.L. 113-6), not including
sequestration or an across-the-board rescission (-5.2%). The FY2014 level of $554.3 millionmil ion was
was continued in the FY2015 act (P.L. 113-235) and the FY2016 act (P.L. 114-113).
).
At an April 20, 2016, markup of the FY2017 billbil , the House Appropriations Committee Legislative Legislative Branch Subcommittee recommended a continuation of this level. At the May 17, 2016, full committee markup, an amendment offered by Representative Farr to increase this level by $8.3 millionmil ion, to $562.6 million mil ion (+1.5%), was agreed to. This level was included in the House-passed FY2017 bill (bil (H.R. 5325). H.R. 5325 was not enacted, however, this increase was provided
in the Consolidated Appropriations Act, 2017 (P.L. 115-31), which was enacted on May 5, 2017.
The FY2017 level was continued for FY2018. The FY2019 level of $573.6 million
21 U.S. Congress, House Committee on Appropriations, Legislative Branch Appropriations Bill, 1997, H.Rept. 104-657, report to accompany H.R. 3754 (Washington, GPO: 1996) p. 11. 22 At this hearing, Chief Administrative Officer Dan Beard indicated that the appropriation “is usually 92 or 93 percent of the authorization.” U.S. Congress, House Committee on Appropriations, Subcommittee on the Legislative Branch, Legislative Branch Appropriations for 2009, hearings, 110th Cong., 2nd sess., April 9, 2008 (Washington: GPO, 2008), pp. 518-519, 528-529.
23 T he two-year period for late receipts for Congress is shorter relative to annual appropriations for much of the rest of the federal government, which is subject to a five-year period (31 U.S.C. 1551 et al.). T his is discussed in the Principles of Federal Appropriations Law. T his publication states: “ For appropriations of the House and Senate, unobligated balances more than two years old cannot be used short of an act of Congress. Instead, obligations chargeable to appropriations that have been expired for more than 2 years ‘shall be liquidated from any appropriations for the same general purpose, which, at the time of payment, are available for disbursement.’ 2 U.S.C. §102a.” United States General Accounting Office, Principles of Federal Appropriations Law, T hird Edition, vol. I, January 2004, http://www.gao.gov/special.pubs/3rdEditionVol1.pdf, pp. 5-76 – 5-77. Chapter 5 (“ Availability of Appropriations: T ime”) also has a section on the “ Evolution of the Law” related to the treatment of unexpended balances. Another section in this chapter, on “Closed Appropriation Accounts” contains the following footnote on T reasury operations and the treatment of closed appropriations: “We commonly talk about “returning” appropriation balances to the T reasury. In point of fact, for the most part, they never leave the T reasury to be gin with. An appropriation does not represent cash actually set aside in the T reasury. Government obligations are liquidated as needed through revenues and borrowing. T hus, the reversion of funds to the T reasury is not a movement of actual cash, but a book keeping adjustment that in the various ways discussed in the text, affects the government’s legal authority to incur obligations and make expenditures.” 24 T he Members’ Handbook. Available at https://cha.house.gov/.
Congressional Research Service
6
link to page 11 link to page 12 link to page 12 Members’ Representational Allowance: History and Usage
The FY2017 level was continued for FY2018. The FY2019 level of $573.6 mil ion represents an increase of $10.998 millionmil ion (+2.0%). This funding is separate from an allowanceal owance for interns in
Member offices that was first funded in FY2019 ($8.8 millionmil ion for up to $20,000 per office).
The FY2020 law (P.L. 116-94) provides $615.0 mil ionThe FY2020 House-reported bill (H.R. 2779) would provide $615.0 million, an increase of $41.4 millionmil ion (+7.2%).
A
separate account contains $11.0 mil ion for interns in House Member offices.
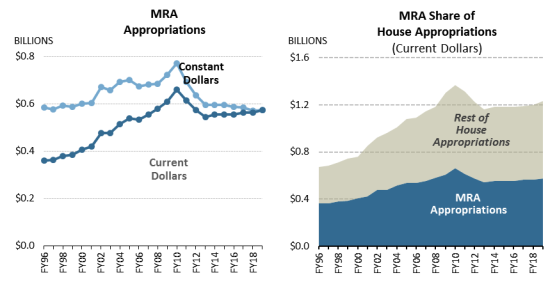
Table 1 provides the appropriation for the overall overal MRA account for all al Members from FY1996 through FY2019
through FY2020. Figure 1 shows the same information in current and constant (20192020) dollars.
The FY2019The FY2020 enacted funding level is
approximately 13% below a decrease of approximately 6.8% from the peak funding provided in FY2010, not adjusted for inflation (2621.2% below when adjusted for inflation); andapproximately 2% below approximately 3.8% above the funding level provided when the account was established in FY1996, when adjusted for inflation (an increase of approximately5970.6% in nominal dollars).20
25
Table 1. MRA Appropriations: FY1996-FY2019
FY2020
(in thousands of current dol ars)
Fiscal
Year
$
Fiscal Year
$
Fiscal Year
$
Fiscal Year
$
1996
360,503
2003
476,536
2010
660,000
2017
562,632
1997
363,313
2004
514,454
2011
613,052
2018
562,632
1998
379,789
2005
538,655
2012
573,939
2019
573,630
1999
385,279
2006
534,109
2013
543,919
2020
615,000
2000
406,279
2007
554,716
2014
554,318
2001
420,182
2008
579,548
2015
554,318
2002
475,422
2009
609,000
2016
554,318
Source: Annual and supplemental appropriations conference reports, acts, and committee prints.
The House-reported FY2021 legislative branch appropriations bil (H.R. 7611) recommends
$640.0 mil ion (+4.1%).
Figure 1 (in thousands of current dollars)
|
Fiscal Year |
$ |
Fiscal Year |
$ |
Fiscal Year |
$ |
Fiscal Year |
$ |
||||
|
1996 |
|
2002 |
|
2008 |
|
2014 |
| ||||
|
1997 |
|
2003 |
|
2009 |
|
2015 |
| ||||
|
1998 |
|
2004 |
|
2010 |
|
2016 |
| ||||
|
1999 |
|
2005 |
|
2011 |
|
2017 |
| ||||
|
2000 |
|
2006 |
|
2012 |
|
2018 |
| ||||
|
2001 |
|
2007 |
|
2013 |
|
2019 |
|
Source: Annual and supplemental appropriations conference reports, acts, and committee prints.
Figure 1 also shows that the MRA is the largest category of appropriations within the House of also shows that the MRA is the largest category of appropriations within the House of
Representatives, regularly comprising approximately 50% of House appropriations.
Individual MRAs for Members: Formula and Authorized Levels Since 1996
The MRA for each Member is set by the Committee on House Administration based on three components: personnel, official office expenses, and official (franked) mail. The personnel allowanceal owance component is the same for each Member. The office expenses and mail allowances al owances components vary from Member to Member. The office expense component includes a base amount; a mileage allowanceal owance, which is calculated based on the distance between a Member's ’s
district and Washington, DC; and an office space allowanceal owance, which is based on the cost of office space in a Member'’s district. The official mail component is calculated based on the number of nonbusiness addresses in a Member'’s district. The three components result in a single MRA
authorization for each Representative that can be used to pay for official expenses.21
26
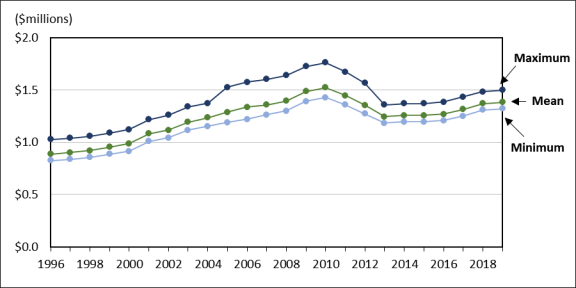
Table 2 demonstrates the variation in authorization levels that resulted from this formula since
1996. Figure 2 presents this information graphically. Additional graphical y.
The 2020 individual Member authorizations remain below the levels authorized in 2010, which was the peak year for MRA funding. Additional information on actions taken to adjust the annual
individual al owances follows.
26 For the 2019 formula, see U.S. Congress, House, Statement of Disbursements of the House, as compiled by the Chief Administrative Officer, from January 1, 2019, to March 31 , 2019, part 3 of 3, H.Doc. 116-26, 116th Cong., 1st sess. (Washington: GPO, 2019), p. 2981.
Congressional Research Service
8
link to page 13 Members’ Representational Allowance: History and Usage
Table 2. Variation in Individual MRA Authorization Levels: 1996-2020
(current dol ars)
Average
Lower Quartile
Median
Upper Quartile
Year
Minimum
(Mean)
Maximum
(25th Percentile)
(50th Percentile)
(75th Percentile)
1996
$824,671
$886,751
$1,026,976
$865,420
$881,682
$902,167
1997
$836,231
$901,165
$1,038,535
$879,620
$896,606
$918,490
1998
$854,904
$919,396
$1,056,176
$897,967
$914,672
$936,395
1999
$885,424
$952,102
$1,088,405
$930,137
$947,661
$967,940
2000
$914,895
$985,831
$1,122,018
$962,571
$981,204
$1,001,807
2001 $1,009,420 $1,081,069
$1,216,831
$1,057,403
$1,076,568
$1,097,123
2002 $1,043,283 $1,114,319
$1,258,737
$1,089,931
$1,109,598
$1,130,975
2003 $1,116,519 $1,191,527
$1,338,831
$1,166,075
$1,186,107
$1,212,784
2004 $1,152,825 $1,234,976
$1,370,805
$1,206,116
$1,228,892
$1,258,233
2005 $1,188,715 $1,286,784
$1,524,617
$1,253,938
$1,278,424
$1,310,388
2006 $1,218,685 $1,335,086
$1,574,753
$1,301,692
$1,326,374
$1,360,650
2007 $1,262,065 $1,356,251
$1,600,539
$1,322,060
$1,346,203
$1,383,810
2008 $1,299,292 $1,393,391
$1,637,766
$1,359,350
$1,383,430
$1,420,454
2009 $1,391,370 $1,484,174
$1,722,242
$1,451,041
$1,475,849
$1,510,755
2010 $1,428,395 $1,522,114
$1,759,575
$1,488,258
$1,513,947
$1,549,464
2011 $1,356,975 $1,446,009
$1,671,596
$1,413,845
$1,438,250
$1,471,991
2012 $1,270,129 $1,353,205
$1,564,613
$1,323,334
$1,345,972
$1,377,773
2013 $1,183,717 $1,243,560
$1,356,445
$1,226,726
$1,240,212
$1,257,959
2014 $1,195,554 $1,255,909
$1,370,009
$1,239,263
$1,252,531
$1,270,493
2015 $1,195,554 $1,255,960
$1,370,009
$1,239,165
$1,252,531
$1,270,516
2016 $1,207,510 $1,268,520
$1,383,709
$1,251,557
$1,265,056
$1,283,221
2017a $1,251,177 $1,315,523
$1,433,709
$1,298,423
$1,311,873
$1,329,280
2018 $1,307,510 $1,368,520
$1,483,709
$1,351,457
$1,365,056
$1,383,243
2019 $1,320,585 $1,382,329
$1,498,546
$1,365,073
$1,378,707
$1,397,053
2020 $1,382,835 $1,444,579
$1,560,796
$1,427,323
$1,440,957
$1,459,303
Source: CRS calculations based on the Statements of Disbursements for 1996-2020 (in current dol ars). The Member al owances are available from January 3 through January 2 of the fol owing year. Notes: The calculations exclude nonvoting Members, including Delegates and the Resident Commissioner. Members elected by special election and sworn in during the quarter are also excluded since the al owance level may be prorated. a. Levels represent information on actions taken to adjust the annual individual allowances follows.
|
Year |
Minimum |
|
Maximum |
|
|
|
|
1996 |
$824,671 |
$886,751 |
$1,026,976 |
$865,420 |
$881,682 |
$902,167 |
|
1997 |
$836,231 |
$901,165 |
$1,038,535 |
$879,620 |
$896,606 |
$918,490 |
|
1998 |
$854,904 |
$919,396 |
$1,056,176 |
$897,967 |
$914,672 |
$936,395 |
|
1999 |
$885,424 |
$952,102 |
$1,088,405 |
$930,137 |
$947,661 |
$967,940 |
|
2000 |
$914,895 |
$985,831 |
$1,122,018 |
$962,571 |
$981,204 |
$1,001,807 |
|
2001 |
$1,009,420 |
$1,081,069 |
$1,216,831 |
$1,057,403 |
$1,076,568 |
$1,097,123 |
|
2002 |
$1,043,283 |
$1,114,319 |
$1,258,737 |
$1,089,931 |
$1,109,598 |
$1,130,975 |
|
2003 |
$1,116,519 |
$1,191,527 |
$1,338,831 |
$1,166,075 |
$1,186,107 |
$1,212,784 |
|
2004 |
$1,152,825 |
$1,234,976 |
$1,370,805 |
$1,206,116 |
$1,228,892 |
$1,258,233 |
|
2005 |
$1,188,715 |
$1,286,784 |
$1,524,617 |
$1,253,938 |
$1,278,424 |
$1,310,388 |
|
2006 |
$1,218,685 |
$1,335,086 |
$1,574,753 |
$1,301,692 |
$1,326,374 |
$1,360,650 |
|
2007 |
$1,262,065 |
$1,356,251 |
$1,600,539 |
$1,322,060 |
$1,346,203 |
$1,383,810 |
|
2008 |
$1,299,292 |
$1,393,391 |
$1,637,766 |
$1,359,350 |
$1,383,430 |
$1,420,454 |
|
2009 |
$1,391,370 |
$1,484,174 |
$1,722,242 |
$1,451,041 |
$1,475,849 |
$1,510,755 |
|
2010 |
$1,428,395 |
$1,522,114 |
$1,759,575 |
$1,488,258 |
$1,513,947 |
$1,549,464 |
|
2011 |
$1,356,975 |
$1,446,009 |
$1,671,596 |
$1,413,845 |
$1,438,250 |
$1,471,991 |
|
2012 |
$1,270,129 |
$1,353,205 |
$1,564,613 |
$1,323,334 |
$1,345,972 |
$1,377,773 |
|
2013 |
$1,183,717 |
$1,243,560 |
$1,356,445 |
$1,226,726 |
$1,240,212 |
$1,257,959 |
|
2014 |
$1,195,554 |
$1,255,909 |
$1,370,009 |
$1,239,263 |
$1,252,531 |
$1,270,493 |
|
2015 |
$1,195,554 |
$1,255,960 |
$1,370,009 |
$1,239,165 |
$1,252,531 |
$1,270,516 |
|
2016 |
$1,207,510 |
$1,268,520 |
$1,383,709 |
$1,251,557 |
$1,265,056 |
$1,283,221 |
|
$1,251,177 |
$1,315,523 |
$1,433,709 |
$1,298,423 |
$1,311,873 |
$1,329,280 |
|
2018 |
$1,307,510 |
$1,368,520 |
$1,483,709 |
$1,351,457 |
$1,365,056 |
$1,383,243 |
|
2019 |
$1,320,585 |
$1,382,329 |
$1,498,546 |
$1,365,073 |
$1,378,707 |
$1,397,053 |
Source: CRS calculations based on the Statements of Disbursements for 1996-2019 (in current dollars). The Member allowances are available from January 3 through January 2 of the following year.
Notes: The calculations exclude nonvoting Members, including Delegates and the Resident Commissioner. Members elected by special election and sworn in during the quarter are also excluded since the allowance level may be prorated.
a. Levels represent the initial 2017 authorizations and do not include the increase of $25,000 for each the initial 2017 authorizations and do not include the increase of $25,000 for each
authorization provided by H.Res. 411 411, which was agreed to on June 27, 2017.
Congressional Research Service
9
Members’ Representational Allowance: History and Usage
Figure 2. MRA Allowances by Member: Maximum, Minimum, and Mean
(current dol ars, 1996-2020)
, which was agreed to on June 27, 2017.
112th Congress: Resolution Reducing Individual Authorizations
In the 112th Congress (2011-2012), the House agreed to H.Res. 22, which reduced the amount authorized for salaries and expenses of Member, committee, and leadership offices in 2011 and 2012. This resolution, agreed to on January 6, 2011, stated that the MRA allowancesal owances for these years may not exceed 95% of the amount established for 2010. Individual MRAs, which reflect authorized levels from January 3 of each year through January 2 of the following year,
subsequently were reduced, resulting in a total reduction of 11.08% from 2010 to 2012.22
113th27
113th Congress: Multiple Influences on Individual Authorized Levels
Individual authorization levels for 2013 (January 3, 2013-January 2, 2014), which were affected by both redistricting23redistricting28 and sequestration,2429 were reduced by a total of 8.2% according to the Statement of Disbursements.25 For legislative year 2014 (January 3, 2014-January 2, 2015), each Member' 27 T he Statement contains the following: “T he total amount of each Member’s 2012 Rep resentational Allowance is 88.92% of the amount authorized in 2010. T his is in accordance with a 5% reduction to the 2010 authorization mandated in House Resolution 22, agreed to on January 6, 2011, and a 6.4% reduction to the 2011 authorization as reflect ed in H.R. 2055, the Consolidated Appropriations Act, 2012 (P.L. 112-74).” U.S. Congress, House, Statem ent of Disbursem ents of the House, as compiled by the Chief Administrative Officer, from October 1, 2012, to December 31, 2012, part 3 of 3, H.Doc. 112-160, 112th Cong., 2nd sess. (Washington: GPO, 2012), p. 2409.
28 T he individual authorizations correspond to the legislative year (January 3-January 2), while appropriations correspond to the fiscal year (beginning October 1). T he 2013 authorization was the first to follow redistricting after the 2010 census and 2012 election cycle. Since the variables in the MRA formula—including distance from DC, the cost of office space, and the number of nonbusiness addresses—account for district characteristics, the individual MRA may vary following redistricting. 29 Pursuant to the Budget Control Act of 2011 (P.L. 112-25), as amended by the American T axpayer Relief Act of 2012
Congressional Research Service
10
link to page 9 link to page 9 Members’ Representational Allowance: History and Usage
Statement of Disbursements.30 For legislative year 2014 (January 3, 2014-January 2, 2015), each
Member’s MRA increased by 1.0%.31
114th Congress
s MRA increased by 1.0%.26
114th Congress
The FY2015 MRA appropriations level remained unchanged from FY2014, and Members' individual allowances’
individual al owances were continued from legislative year 2014 to 2015.27
32
The FY2016 MRA appropriations level remained unchanged from FY2014 and FY2015, although Members' individual allowances
Members’ individual al owances for legislative year 2016 were increased by 1.0%.28
115th Congress
33
115th Congress
The FY2017 MRA appropriations level increased by +1.5% from FY2016. According to the Statement of Disbursements, each Member'’s authorization for 2017 was increased "“by approximately 3.9% of the average MRA."29”34 This resulted in an average increase of
approximately $47,000.
A shooting on June 14, 2017, at a practice for the Congressional Baseball Basebal Game, which wounded one Member of Congress, two U.S. Capitol Police (USCP) officers, and two members of the
public in Alexandria, VA, had an impact on consideration of MRA funding for FY2018.
The report accompanying the legislative branch appropriations bill (bil (H.R. 3162), in addition to addressing funding for the Capitol Police and the House Sergeant at Arms, indicated that the Appropriations "“Committee has provided resources necessary to support the Committee on House Administration'
Administration’s plan to increase Member'’s Representational AllowanceAl owance (MRA) by $25,000 per
(P.L. 112-240), a sequestration order was issued on March 1, 2013 (White House, President Obama, Sequestration Order for Fiscal Year 2013 Pursuant to Section 251A of the Balanced Budget and Emergency Deficit Control Act, As Amended, March 1, 2013, available at https://www.govinfo.gov/content/pkg/DCPD-201300132/pdf/DCPD-201300132.pdf).
30 T he Statement contained the following: “Because the House is operating under a continuing resolution at FY 2012 levels, the total amount of funds available for MRAs remains unchanged.* However, to account for redistricting and other factors, individual MRAs have been recalculated using the sum of the following components adjusted proportionally to ensure the total is consistent with 2012 funding levels.... *This am ount was reduced on March 4, 2013, by 8.2% to com ply with sequestration orders issued pursuant to the Budget Control Act of 2011 .” U.S. Congress, House, Statem ent of Disbursem ents of the House, as compiled by the Chief Administrative Officer, from April 1, 2013, to June 30, 2013, part 3 of 3, H.Doc. 113 -41, 113th Cong., 1st sess. (Washington: GPO, 2013), p. 2597. 31 U.S. Congress, House, Statement of Disbursements of the House, as compiled by the Chief Administrative Officer, from April 1, 2014, to June 30, 2014, part 3 of 3, H.Doc. 113 -141, 113th Cong., 2nd sess. (Washington: GPO, 2014), p. 2559.
32 U.S. Congress, House, Statement of Disbursements of the House, as compiled by the Chief Administrative Officer, from January 1, 2015, to March 31, 2015, part 3 of 3, H.Doc. 114-29, 114th Cong., 1st sess. (Washington: GPO, 2015), p. 2854. 33 U.S. Congress, House, Statement of Disbursements of the House, as compiled by the Chief Administrative Officer, from January 1, 2016, to March 31, 2016, part 3 of 3, H.Doc. 114 -120, 114th Cong., 2nd sess. (Washington: GPO, 2016), p. 2861. For information on the relationship between the appropriations and allocations, see the section on “Appropriations and Allocations: T iming Differences with the Overall Fiscal Year Appropriation and Individual Member Calendar Year Authorization.”
34 U.S. Congress, House, Statement of Disbursements of the House, as compiled by the Chief Administrative Officer, from April 1, 2017, to June 30, 2017 , part 3 of 3, H.Doc. 115-52, 115th Cong., 1st sess. (Washington: GPO, 2017), p. 2664.
Congressional Research Service
11
Members’ Representational Allowance: History and Usage
(MRA) by $25,000 per account this year for the purpose of providing Member security when away from the Capitol complex."30
complex.”35
The House approved the MRA authorization increases when it agreed to H.Res. 411, by
unanimous consent, on June 27, 2017.
As stated above, during consideration in the House of the FY2018 legislative branch appropriations bill (bil (H.R. 3219)31)36 on July 26, 2017, two amendments related to the MRA were
offered: H.Amdt. 214 was agreed to by voice vote, and H.Amdt. 213 failed by voice vote.
Subsequently, on July 28, 2017, House Sergeant at Arms Paul D. Irving issued a "Dear Colleague"“Dear
Colleague” letter announcing that his office "will “wil assume the cost of and oversee future District Office security upgrades, maintenance, and monthly monitoring fees."32”37 These upgrades were
previously supported through the MRA.
On August 15, 2017, the Committee on House Administration issued a "“Dear Colleague"” letter announcing updates to the Members'’ Congressional Handbook incorporating these and other changes.3338 The MRA remains available for security measures necessitated by official duties as
discussed in the letter and the Handbook.
The FY2018 act continued the FY2017 level of $562.6 millionmil ion. According to the Statement of Disbursements, the "Members' Representational Allowance“Members’ Representational Al owance for 2018 utilizes each Member's ’s
2017 amount and increases that amount by $25,000."34
116th Congress
”39
116th Congress
The FY2019 act provided $573.6 million mil ion (+2.0%). According to the Statement of Disbursements, Members' individual allowances
Members’ individual al owances for legislative year 2019 were increased by 1.0%.35
The FY2020 House-reported legislative branch appropriations bill (H.R. 2779) would provide $615.0 million, an increase of $41.4 million (+7.2%).
40
The FY2020 law (P.L. 116-94) provides $615.0 mil ion, an increase of $41.4 mil ion (+7.2%). According to the Statement of Disbursements, Members’ individual al owances for legislative
year 2020 were increased by $62,250.41
35 U.S. Congress, House Committee on Appropriations, Subcommittee on Legislative Branch, Legislative Branch, 2018, report to accompany H.R. 3162, 115th Cong., 1st sess., July 6, 2017, H.Rept. 115-199 (Washington: GPO, 2017), p. 3. See also the Mem bers’ Congressional Handbook, https://cha.house.gov.
36 On July 18, the text of H.R. 3162 was included in a print issued by the House Rules Committee entitled, “Text of the Defense, Military Construction, Veterans Affairs, Legislative Branch, and Energy And Water Development National Security Appropriations Act, 2018” (Committee Print 115 -30, which also contains the text of H.R. 3219, H.R. 2998, and H.R. 3266). Subsequently, the House agreed on September 14 to H.Res. 500, which included the text of Rules Committee Print 115-31, as amended, in an amendment in the nature of a substitute for H.R. 3354. T he text of the legislative branch bill, as agreed to in H.R. 3219, was unchanged. H.R. 3354, which then included text for all 12 appropriations bills, was agreed to in the House on September 14, 2017. 37 Available to House offices at https://e-dearcolleague.house.gov/. 38 T he updated Handbook is available at https://cha.house.gov/. 39 U.S. Congress, House, Statement of Disbursements of the House, as compiled by the Chief Administrative Officer, from July 1, 2018, to September 30, 2018, part 3 of 3, H.Doc. 115 -161, 115th Cong., 2nd sess. (Washington: GPO, 2018), p. 2523. 40 U.S. Congress, House, Statement of Disbursements of the House, as compiled by the Chief Administrative Officer, from January 1, 2019, to March 31, 2019, part 3 of 3, H.Doc. 116-26, 116th Cong., 1st sess. (Washington: GPO, 2019), p. 2981.
41 U.S. Congress, House, Statement of Disbursements of the House, as compiled by the Chief Administrative Officer, from January 1, 2020, to March 31, 2020, part 3 of 3, H.Doc. 116 -116, 116th Cong., 2nd sess. (Washington: GPO, 2020), p. 3399.
Congressional Research Service
12
Members’ Representational Allowance: History and Usage
The House requested $672.0 mil ion for FY2021, an increase of $57.0 mil ion (+9.3%). The House-reported FY2021 legislative branch appropriations bil (H.R. 7611) recommends $640.0
mil ion (+4.1%).
Guidelines, Operations, and Sources of Regulations Guidelines, Operations, and Sources of Regulations
Expenses related to official and representational duties are reimbursable under the MRA in
accordance with the regulations contained in the Members'’ Congressional Handbook.
The Handbook, for example, states that a
Member is personally responsible for the payment of any official and representational expenses incurred that exceed the provided MRA or that are incurred but are not exceed the provided MRA or that are incurred but are not reimbursable under these regulations.36
42
Certain expenses, including personal expenses, greeting cards, alcoholic beverages, and most gifts and donations, are also not reimbursable. The MRA is not transferable between years, and
unspent funds from one year cannot be obligated in any subsequent year.
Other limitations on the use of official funds are also contained in House Rule XXIV.
"
“Dear Colleague"” Letters Related to the MRA
" “Dear Colleague" ” letters—which are distributed among Members, committees, and officers—frequently mention the MRA. These "“Dear Colleague"” letters have announced changes in the dissemination of information or the processing of vouchers, elaborated on procedures, reminded
Members and staff of guidelines on the use of funds, and asked for support for MRA legislation.
The Committee on House Administration, for example, has distributed regular annual "Dear Colleagues"“Dear Colleagues” announcing or explaining regulations, such as those pertaining to end-of-year expenses, district office space, and travel.3743 Other letters have been issued regarding allowable al owable franking and MRA expenses for the annual Congressional Art Competition or travel for a Member'
Member’s funeral service, as well wel as reminders of prohibited expenses.3844 The letters have explained the implication of new regulations, rulings, or decisions on MRA spending.3945 They also have summarized changes to the Statement of DisbursementsDisbursements and announced the publication of
new quarterly information.40
Categories of Spending
House spending is categorized by the standard budget object classes used for the federal government.41 These may include
- personnel compensation;
- travel;
- rent, communications, and utilities;
- 46
42 T he Members’ Handbook is available at https://cha.house.gov/. 43 For example, recent Dear Colleague letters issued by the Committee on House Administration have included “Deadline to Use Obligated Funds-April 1,” March 26, 2019; “End-of-Year Expenses: Policies and Best Practices,” December 6, 2018; and “ Updates to the Members’ and Committees’ Congressional Handbooks,” March 5, 2018.
44 For example: Dear Colleague letter from the Sergeant at Arms related to travel for the funeral of a deceased Member of Congress, March 19, 2018; and Dear Colleague letter from the Committee on House Administration, “ 2018 Conference and Caucus Retreats,” January 8, 2018. 45 For example, Dear Colleague letters issued by the Committee on House Administration have included, “Using Your MRA for District Office Security Assessments and Upgrades,” January 18, 2011; and, “ Automated Calls to Mobile Devices,” July 26, 2016.
46 For example, Dear Colleague Letter from the CAO [Chief Administrative Officer] of the House, “Increased T ransparency in Statement of Disbursements,” August 18, 2011; Dear Colleague Letter from the CAO of the House, “Statement of Disbursements to Publish Merchant Information for Purchase Card T ransactions,” CAO of the House, June 22, 2012; and Dear Colleague Letter from the CAO of the House, “ First Quarter 2019 Statement of Disbursements,” May 28, 2019.
Congressional Research Service
13
Members’ Representational Allowance: History and Usage
Categories of Spending House spending is categorized by the standard budget object classes used for the federal
government.47 These may include
personnel compensation; travel; rent, communications, and utilities; printing and reproduction; other services; supplies and materials;48
printing and reproduction; - other services;
- supplies and materials;42
- transportation of things; and
- equipment.
The disbursement volumes also contain a category for franked mail.
Certain costs are not included in the MRA and will wil not be reflected in these totals. The costs c osts include the salaries of Members43Members49 and certain benefits—including any government contributions toward health and life insurance and retirement—for both Members and staff. AdditionallyAdditional y, the
, the range of items that may be covered by an office has changed over time.4450 The MRA also does not
reflect spending by House officers and legislative branch agencies in support of Member offices.
Statements of Disbursements: Online Publication and CSV Availability
The Statements of Disbursements are published as House documents and were historically available historical y available in bound volumes. Beginning with the disbursements for the quarter ending September 30, 2009, the Statements have been posted on the House of Representatives website, House.gov.45 Beginning 51 Beginning with disbursements covering January-March 2016, this website provides SOD
information in a sortable CSV (comma-separated values) format.
47 T his classification system is based on U.S. Office of Management and Budget, OMB Circular A-11, 2019 edition, https://www.whitehouse.gov/omb/information-for-agencies/circulars/. 48 T his may include, for example: office supplies, bottled water, and publication/reference material. 49 Member pay is included in a permanent appropriation (P.L. 97-51; 95 Stat. 966; September 11, 1981). 50 For example, in a “ Dear Colleague” letter of April 20, 2009, the Committee on House Administration announced that effective June 1, 2009, the transit benefit program would be administered centrally and available to all qualifying House employees. Previously, Members could determine whether or not to provide the transit benefit to their employees from the MRA, and those who offered this benefit would record the expenditure under the personnel benefits category. For another example, certain security-related costs, including “ the cost of ... District Office security upgrades, maintenance, and monthly monitoring fees,” is now supported by the House Sergeant at Arms ( “Dear Colleague” letter of July 28, 2017, issued by House Sergeant at Arms Paul D. Irving). 51 T he Statements of Disbursements are available at https://www.house.gov/the-house-explained/open-government/statement -of-disbursements. Congressional Research Service 14 link to page 20 link to page 23 link to page 24 Members’ Representational Allowance: History and Usage The MRA in Historical Practice: An Analysis of Spending in Selected Years
This section examines the use of the MRA in practice in recent years.
Methodology
Methodology Disbursement information for each authorization year may appear in Statements for 12 quarters,
since, as discussed above, late-arriving billsbil s may be paid for up to two years following the end of the MRA year (although unspent funds from one year cannot be obligated in any subsequent year). For example, while Members could only obligate 2011 MRA expenditures from January 3, 2011, until January 2, 2012, late-arriving receipts could be paid through the quarter ending December 31, 2013. While some billsbil s, particularly from outside vendors, may be settled up to
eight quarters after the end of the MRA year, the vast majority of billing bil ing occurs during the session or in the quarter immediately following the close of the MRA year. Billing Bil ing for some categories— —like personnel compensation—is almost entirely within the disbursements for the calendar year of study.4652 By examining volumes from subsequent quarters, in addition to those from the
authorization year, it is possible to provide a more complete picture of spending patterns.47
53
Analysis
Numerous characteristics of individual congressional districts or Member preferences can
influence spending priorities, which is reflected in the flexibility provided to Members in establishing and running their offices.4854 Despite some variations, the data, however, show a relative consistency in the overall allocationoveral al ocation of MRA resources by category of spending both
across Members and over time.49
55
Table 3 provides a distributional analysis of office-level data for certain categories of spending, while
while Figure 3 demonstrates aggregate House spending in these years.
The office-level and aggregate data indicate that personnel compensation is by far the largest category of expense for Member offices, and it increased as a percentage of spending over this time period. Spending on travel and "“Rent, Communications, and Utilities" ” remained relatively stable, while spending on franked mail decreased for the average and median Members and for
the House overall.
overal . Table 4 shows spending as a proportion of the total individual authorization.
Table 3. Distribution of Office-Level Spending on Select Categories: 2009-2017
52 Since the MRA is available through January 2, but the Statements for the fourth quarter cover obligations through December 31, personnel compensation for January 1 and January 2 in an MRA year will usually appear in the volume for the subsequent calendar year (January 1-March 31), under a heading indicating that it is billed to the previous MRA year. 53 For 2018 and 2019, preliminary data are provided. 54 T hese may include, for example: the cost -of-living in the districts from which Members are elected; actual transportation costs to and from the district or around the district; geographical size of the district; number of people living in the district; or other characteristics of a district that may influence spending patterns, including varying expectations among constituent s for different levels or types of contact. 55 See also information on average expenditures for FY2013 provided for the record during the House Appropriations Committee FY2015 hearings (U.S. Congress, House Committee on Appropriations, Subcommittee on the Legislative Branch, Legislative Branch Appropriations for 20 15, hearings, 113th Cong., 2nd sess., March 6, 2014 [Washington: GPO, 2014], pp. 292-293).
Congressional Research Service
15
Members’ Representational Allowance: History and Usage
Table 3. Distribution of Office-Level Spending on Select Categories: 2009-2019
(percentage of total expenditure in the individual MRA)
Lower
Upper
Category of
Ave. %
Quartile
Median
Quartile
Expense
Year
Min %
(Mean)
Max %
(25th%)
(50th%)
(75th%)
2009
0
4
15
1
4
7
2010
0
4
16
2
4
6
2011
0
3
13
1
3
5
2012
0
3
14
1
2
5
Franked Mail
2013
0
2
14
0
1
3
2014
0
2
12
0
1
4
2015
0
2
16
0
1
4
2016
0
2
19
0
1
4
2017
0
2
12
0
1
3
2018
0
3
13
0
2
4
2019
0
2
12
0
1
3
2009
48
69
86
65
70
75
2010
53
71
88
65
71
76
2011
45
71
89
66
71
76
2012
54
75
91
71
75
80
Personnel
2013
56
75
88
70
76
79
Compensation
2014
56
76
88
72
77
80
2015
46
75
88
71
75
79
2016
47
77
90
73
77
81
2017
53
74
89
71
75
79
2018
53
77
90
72
77
82
2019
54
74
88
70
74
79
2009
0
4
11
3
4
6
2010
0
4
15
3
4
5
2011
0
4
11
3
4
6
2012
0
4
12
2
4
5
Travel
2013
0
4
13
3
4
5
2014
0
4
15
3
4
6
2015
0
4
15
3
4
6
2016
0
4
13
3
4
5
2017
0
4
14
3
4
5
2018
0
4
16
3
4
5
2019
0
4
15
3
4
5
2009
3
8
17
7
8
9
Congressional Research Service
16
Members’ Representational Allowance: History and Usage
Lower
Upper
Category of
Ave. %
Quartile
Median
Quartile
Expense
Year
Min %
(Mean)
Max %
(25th%)
(50th%)
(75th%)
Rent,
2010
3
8
17
6
7
9
Communications,
and Utilities
2011
3
8
17
7
8
10
2012
3
8
15
6
8
9
2013
3
8
18
7
8
10
2014
3
8
18
7
8
9
2015
2
8
19
7
8
10
2016
3
8
19
6
8
9
2017
3
8
20
7
8
10
2018
2
8
20
6
7
9
2019
2
9
21
7
8
10
Equipment
2009
0
2
11
1
1
2
2010
0
2
9
1
1
2
2011
0
2
7
1
1
2
2012
0
1
7
0
1
2
2013
0
1
10
0
1
1
2014
0
1
6
1
1
2
2015
0
1
7
0
1
2
2016
0
1
6
0
1
2
2017
0
1
9
1
1
2
2018
0
1
7
0
1
2
2019
0
1
7
1
1
2
Printing and
2009
0
5
23
1
4
7
Reproduction
2010
0
4
14
1
3
6
2011
0
4
15
1
3
6
2012
0
3
18
0
3
5
2013
0
3
16
0
2
4
2014
0
3
14
0
2
4
2015
0
3
23
0
2
4
2016
0
2
24
0
2
4
2017
0
3
17
0
2
4
2018
0
3
23
0
2
5
2019
0
3
22
0
2
5
Supplies and
2009
1
3
9
3
3
4
Materials
2010
0
3
11
2
3
4
2011
1
3
10
2
3
4
2012
0
3
10
1
2
3
Congressional Research Service
17
Members’ Representational Allowance: History and Usage
Lower
Upper
Category of
Ave. %
Quartile
Median
Quartile
Expense
Year
Min %
(Mean)
Max %
(25th%)
(50th%)
(75th%)
2013
0
2
8
1
2
3
2014
0
2
8
1
2
3
2015
0
2
7
1
2
3
2016
0
3
9
2
2
3
2017
0
2
9
1
2
3
2018
0
2
9
1
2
3
2019
0
2
6
1
2
3
Other Services
2009
1
4
11
3
4
5
2010
0
4
10
3
4
5
2011
2
5
13
4
5
6
2012
1
3
9
2
3
3
2013
2
4
9
3
4
6
2014
2
3
8
2
3
4
2015
1
4
8
3
4
5
2016
1
3
8
2
3
4
2017
1
4
9
3
4
6
2018
1
3
12
2
2
3
2019
2
5
11
3
4
6
Source: CRS calculations based on the Statement of Disbursements covering expenditures for 2009-2019. For 2018, nine quarters are available as of the date of this update. For 2019, five quarters are available as of the date of this update. Preliminary data are provided. Notes: Data exclude nonvoting Members, including the Delegates and Resident Commissioner. Members who were not in Congress (percentage of total expenditure in the individual MRA)
|
Category of Expense |
Year |
Min % |
Ave. % (Mean) |
Max % |
Lower Quartile (25th%) |
Median (50th%) |
Upper Quartile (75th%) |
|
Franked Mail |
2009 |
0 |
4 |
15 |
1 |
4 |
7 |
|
2010 |
0 |
4 |
16 |
2 |
4 |
6 |
|
|
2011 |
0 |
3 |
13 |
1 |
3 |
5 |
|
|
2012 |
0 |
3 |
14 |
1 |
2 |
5 |
|
|
2013 |
0 |
2 |
14 |
0 |
1 |
3 |
|
|
2014 |
0 |
2 |
12 |
0 |
1 |
4 |
|
|
2015 |
0 |
2 |
16 |
0 |
1 |
4 |
|
|
2016 |
0 |
2 |
19 |
0 |
1 |
4 |
|
|
2017 |
0 |
2 |
12 |
0 |
1 |
3 |
|
|
Personnel Compensation |
2009 |
48 |
69 |
86 |
65 |
70 |
75 |
|
2010 |
53 |
71 |
88 |
65 |
71 |
76 |
|
|
2011 |
45 |
71 |
89 |
66 |
71 |
76 |
|
|
2012 |
54 |
75 |
91 |
71 |
75 |
80 |
|
|
2013 |
56 |
75 |
88 |
70 |
76 |
79 |
|
|
2014 |
56 |
76 |
88 |
72 |
77 |
80 |
|
|
2015 |
46 |
75 |
88 |
71 |
75 |
79 |
|
|
2016 |
47 |
77 |
90 |
73 |
77 |
81 |
|
|
2017 |
53 |
74 |
89 |
71 |
75 |
79 |
|
|
Travel |
2009 |
0 |
4 |
11 |
3 |
4 |
6 |
|
2010 |
0 |
4 |
15 |
3 |
4 |
5 |
|
|
2011 |
0 |
4 |
11 |
3 |
4 |
6 |
|
|
2012 |
0 |
4 |
12 |
2 |
4 |
5 |
|
|
2013 |
0 |
4 |
13 |
3 |
4 |
5 |
|
|
2014 |
0 |
4 |
15 |
3 |
4 |
6 |
|
|
2015 |
0 |
4 |
15 |
3 |
4 |
6 |
|
|
2016 |
0 |
4 |
13 |
3 |
4 |
5 |
|
|
2017 |
0 |
4 |
14 |
3 |
4 |
5 |
|
|
Rent, Communications, and Utilities |
2009 |
3 |
8 |
17 |
7 |
8 |
9 |
|
2010 |
3 |
8 |
17 |
6 |
7 |
9 |
|
|
2011 |
3 |
8 |
17 |
7 |
8 |
10 |
|
|
2012 |
3 |
8 |
15 |
6 |
8 |
9 |
|
|
2013 |
3 |
8 |
18 |
7 |
8 |
10 |
|
|
2014 |
3 |
8 |
18 |
7 |
8 |
9 |
|
|
2015 |
2 |
8 |
19 |
7 |
8 |
10 |
|
|
2016 |
3 |
8 |
19 |
6 |
8 |
9 |
|
|
2017 |
3 |
8 |
20 |
7 |
8 |
10 |
Source: CRS calculations based on the Statement of Disbursements covering expenditures for 2009-2018. For 2017, nine quarters are available as of the date of this update. Preliminary data are provided.
Notes: Data exclude nonvoting Members, including the Delegates and Resident Commissioner. Members who were not in Congress for the entirety of the MRA year were also excluded, since spending for any portion may not be reflective of expenditures in an uninterrupted year. This limitation resulted in the followingfol owing number of Members Members included in the data: for 2009, 429; 2010, 428; 2011, 430; 2012, 426; 2013, 428; 2014, 430; 2015, 431; 2016, 431; and 2017, 426.
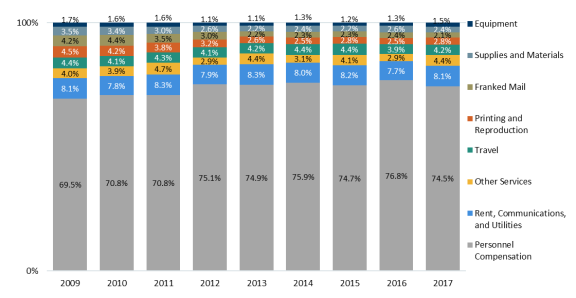
Congressional Research Service
19
Members’ Representational Allowance: History and Usage
Table 4. Spending as a Percentage of Authorization: 2009-2017
2019 (based on Members who served the entire year)
Percent |
Percent Spent |
|||||||||
|
Year |
<70% |
70-75 |
75-80 |
80-85 |
85-90 |
90-95 |
95-99 |
>99% |
Mean |
Median |
|
2009 |
0.5% |
0.5% |
1.4% |
5.6% |
13.8% |
28.7% |
35.4% |
14.2% |
93.7% |
94.9% |
|
2010 |
0.2% |
0.7% |
2.6% |
4.9% |
13.1% |
20.1% |
37.1% |
21.3% |
94.2% |
96.0% |
|
2011 |
0.7% |
0.2% |
1.9% |
5.8% |
12.8% |
24.0% |
34.7% |
20.0% |
94.0% |
95.6% |
|
2012 |
0.2% |
0.7% |
1.6% |
3.1% |
11.3% |
21.6% |
38.0% |
23.5% |
94.8% |
96.8% |
|
2013 |
0.2% |
0.0% |
0.7% |
1.4% |
4.4% |
17.8% |
40.9% |
34.6% |
96.5% |
98.1% |
|
2014 |
0.5% |
0.2% |
0.0% |
3.5% |
7.0% |
21.4% |
41.4% |
26.0% |
95.6% |
97.2% |
|
2015 |
0.5% |
0.0% |
0.2% |
0.5% |
5.6% |
17.2% |
45.7% |
30.4% |
96.5% |
98.0% |
|
2016 |
0.2% |
0.0% |
0.5% |
3.2% |
9.5% |
18.1% |
42.5% |
26.0% |
95.5% |
97.2% |
|
2017 |
0.5% |
0.0% |
1.2% |
4.0% |
9.4% |
26.1% |
44.6% |
14.3% |
94.7% |
96.1% |
Source: CRS calculations based on the Statement of Disbursements covering expenditures for 2009-2017. For 2017, nine quarters are available as of the date of this update. Preliminary data are provided.
Notes: Data exclude nonvoting Members, including the Delegates and Resident Commissioner. Members who were not in Congress for the entirety of the MRA year were also excluded, since spending for any portion may not be reflective of expenditures in an uninterrupted year. This limitation resulted in the followingfol owing number of Members Members included in the data: for 2009, 429; 2010, 428; 2011, 430; 2012, 426; 2013, 428; 2014, 430; 2015, 431; 2016, 431; and 2017, 426.
2017, 426; 2018, 424; and 2019, 428. Congressional Research Service 20 Members’ Representational Allowance: History and Usage Appendix. Examples of Legislation Introduced Affecting the MRA by Type
Table A-1. Examples of Legislation Introduced to Regulate, Prohibit, Authorize, Disclose, or Encourage the Use of the MRA for a Particular Purpose
|
Legislation by Congress |
116th Congress
115th Congress |
|
|
114th Congress |
|
|
113th Congress |
|
|
112th Congress |
|
|
111th Congress |
|
|
110th Congress |
|
|
109th Congress |
|
|
108th Congress |
|
|
105th Congress |
|
Source: CRS examination of LIS.
Table A-2. Examples of Legislation Introduced
Regarding the Use of Unexpended Balances
(not including regular appropriations provisions)
|
Congress |
Bills |
|
116th Congress |
Congress
Bills
116th Congress
H.R. 1790 |
|
114th Congress |
|
|
113th Congress |
114th Congress
H.R. 3077
113th Congress
H.R. 106 |
|
112th Congress |
H.R. 121 |
|
111th Congress |
H.R. 2656 |
|
110th Congress |
|
|
109th Congress |
H.R. 267 |
|
108th Congress |
H.R. 297 |
|
107th Congress |
H.R. 47 |
|
106th Congress |
H.R. 431 |
|
105th Congress |
H.R. 80 |
|
104th Congress |
H.R. 26 |
Source: CRS examination of LIS.
Notes: Unless otherwise noted, bills bil s were introduced and referred to committee, but no further action was taken.
a. H.R. 4825 was agreedagreed to in the House on March 17, 2010. The bill bil was referred to the Senate Committee
on Rules and Administration and no further action was taken during the 111th Congress.
|
Legislation by Congress |
|
112th Congress |
|
|
111th Congress |
|
Source: CRS examination of LIS.
Notes: Unless otherwise noted, legislation was introduced and referred to committee, but no further action was taken.
Congressional Research Service
23
Members’ Representational Allowance: History and Usage
a. H.Res. 22 (112thwas taken.
a. H.Res. 22 (112th Congress) was agreed to in the House on January 6, 2011.
Author Contact Information
Acknowledgments
Acknowledgments
William T. Egar, Sarah J. Eckman, Lara E. Chausow, and Aaron Weinerman assisted in data collection for various versions of this report. Amber Hope Wilhelm and Jamie Hutchinson assisted in the preparation of the graphics.
Disclaimer
This document was prepared by the Congressional Research Service (CRS). CRS serves as nonpartisan shared staff to congressional committees and Members of Congress. It operates solely at the behest of and under the direction of Congress. Information in a CRS Report should n ot be relied upon for purposes other than public understanding of information that has been provided by CRS to Members of Congress in
connection with CRS’s institutional role. CRS Reports, as a work of the United States Government, are not subject to copyright protection in the United States. Any CRS Report may be reproduced and distributed in its entirety without permission from CRS. However, as a CRS Report may include copyrighted images or material from a third party, you may need to obtain the permission of the copyright holder if you wish to copy or otherwise use copyrighted material.
Congressional Research Service
R40962 · VERSION 25 · UPDATED
24 the graphics.
Footnotes
| 1. |
Burdett Loomis and Wendy Schiller, The Contemporary Congress, 5th ed. (Belmont, CA: Thompson-Wadsworth, 2006), Ch. 7-8; Richard F. Fenno, Jr., Congressmen in Committees (Boston: Little, Brown, 1973), p. 1; David Mayhew, Congress: The Electoral Connection (New Haven: Yale University Press, 1974), p. 49; Gary W. Cox and Jonathan N. Katz, "Why Did the Incumbency Advantage in the U.S. House Elections Grow?" American Journal of Political Science, vol. 40, no. 2 (May 1996), pp. 479-481; and, David C.W. Parker and Craig Goodman, "Making a Good Impression: Resource Allocation, Home Styles, and Washington Work," Legislative Studies Quarterly, vol. 34, no. 4 (November 2009), pp. 493-524. One study of MRA expenditures during the 106th Congress, for example, examined the effect of a Member's standing within the House, time in office, and plans for retirement or reelection on spending (Garry Young, "Choosing How to Represent: House Members and the Distribution of Their Representational Allowances," updated version of a paper presented at the Midwest Political Science Association, Chicago, April 7, 2005, pp. 15-18, available at http://home.gwu.edu/~youngg/research/Homestyle%20Choices%20v3.02.pdf). |
| 2. |
For additional information on the resources available to Members of Congress, see CRS Report RL30064, Congressional Salaries and Allowances: In Brief, by Ida A. Brudnick. |
| 3. |
|
| 4. |
Available at https://cha.house.gov/. |
| 5. |
Available at http://ethics.house.gov/sites/ethics.house.gov/files/documents/2008_House_Ethics_Manual.pdf. |
| 6. |
Information on spending by certain Members was excluded from the observation data and summary findings because of characteristics related to the district or status or tenure of the Member. Nonvoting Members, including the Delegates and the Resident Commissioner, have been subject to the same expense formula as other Members since January 1, 1983 (P.L. 97-357, 96 Stat 1711, October 19, 1982), although the distance from D.C., size of population, or both, may vary greatly from other Members. Members who were not in Congress for all of a calendar year, whether the Member left Congress prior to the end of the year or entered any time after the beginning of the session, were excluded from the calculations from that year since spending for any portion may not be reflective of allocations for an uninterrupted year. This limitation resulted in the following number of Members included in the data: for 2009, 429; 2010, 428; 2011, 430; 2012, 426; 2013, 428; 2014, 430; 2015, 431; 2016, 431; and 2017, 426. |
| 7. |
See, for example, House Administration Committee Orders 35, 38, 39, and 40 (effective May 1, 1983; August 1, 1985; March 15, 1990; and May 8, 1991, respectively). These were reprinted within the notes for 2 U.S.C. 57 in prior versions of the U.S. Code. |
| 8. |
Committee Order No. 41, effective September 1, 1995. |
| 9. |
P.L. 104-53, 109 Stat. 519 (November 19, 1995). |
| 10. |
U.S. Congress, House Committee on Appropriations, Legislative Branch Appropriations Bill, 1996, report to accompany H.R. 1854, 104th Cong., 1st sess., H.Rept. 104-141 (Washington: GPO, 1995), p. 10. |
| 11. |
P.L. 104-186, 110 Stat. 1719 (August 20, 1996); 2 U.S.C. 5341. |
| 12. |
P.L. 106-57, 113 Stat. 415 (September 29, 1999). |
| 13. |
The first few laws with this provision referred to the federal deficit. A budget deficit (or surplus) is calculated based on total spending of the entire federal government less total revenue collected. Since P.L. 106-57 (September 29, 1999), these provisions have also referred to the debt, stating any amounts remaining after all payments are made "shall be deposited in the Treasury and used for deficit reduction (or, if there is no Federal budget deficit after all such payments have been made, for reducing the Federal debt, in such manner as the Secretary of the Treasury considers appropriate)." Annual legislative branch appropriations bills with this language include P.L. 104-53, P.L. 104-197, P.L. 105-55, P.L. 105-275, P.L. 106-57, P.L. 106-554, P.L. 107-68, P.L. 108-7, P.L. 108-83, P.L. 108-447, P.L. 109-55, P.L. 110-161, P.L. 111-8, P.L. 111-68, P.L. 112-74, P.L. 113-6, P.L. 113-76, P.L. 113-235, P.L. 114-113, P.L. 115-31, P.L. 115-141, and P.L. 115-244. The two long-term continuing resolutions (also known as CRs) enacted during this period—P.L. 110-5 and P.L. 112-10—continued this language from prior years. |
| 14. |
U.S. Congress, House Committee on Appropriations, Legislative Branch Appropriations Bill, 2020, H.Rept. 116-64, report to accompany H.R. 2779 (Washington, GPO: 2019) p. 2. |
| 15. |
U.S. Congress, House Committee on Appropriations, Legislative Branch Appropriations Bill, 1996, H.Rept. 104-141, report to accompany H.R. 1854 (Washington, GPO: 1995) p. 12; U.S. Congress, House Committee on Appropriations, Legislative Branch Appropriations Bill, 1998, H.Rept. 105-196, report to accompany H.R. 2209 (Washington, GPO: 1997) p. 10; U.S. Congress, House Committee on Appropriations, Legislative Branch Appropriations Bill, 1999, H.Rept. 105-595, report to accompany H.R. 4112 (Washington, GPO: 1998) p. 10; U.S. Congress, House Committee on Appropriations, Legislative Branch Appropriations Bill, 2000, H.Rept. 106-156, report to accompany H.R. 1905 (Washington, GPO: 1999) p. 11; U.S. Congress, House Committee on Appropriations, Legislative Branch Appropriations Bill, 2001, H.Rept. 106-635, report to accompany H.R. 4516 (Washington, GPO: 2000) p. 11; U.S. Congress, House Committee on Appropriations, Legislative Branch Appropriations Bill, 2010, H.Rept. 111-160, report to accompany H.R. 2918 (Washington, GPO: 2009) p. 8. |
| 16. |
U.S. Congress, House Committee on Appropriations, Legislative Branch Appropriations Bill, 1997, H.Rept. 104-657, report to accompany H.R. 3754 (Washington, GPO: 1996) p. 11. |
| 17. |
At this hearing, Chief Administrative Officer Dan Beard indicated that the appropriation "is usually 92 or 93 percent of the authorization." U.S. Congress, House Committee on Appropriations, Subcommittee on the Legislative Branch, Legislative Branch Appropriations for 2009, hearings, 110th Cong., 2nd sess., April 9, 2008 (Washington: GPO, 2008), pp. 518-519, 528-529. |
| 18. |
The two-year period for late receipts for Congress is shorter relative to annual appropriations for much of the rest of the federal government, which is subject to a five-year period (31 U.S.C. 1551 et al.). This is discussed in the Principles of Federal Appropriations Law. This publication states: "For appropriations of the House and Senate, unobligated balances more than two years old cannot be used short of an act of Congress. Instead, obligations chargeable to appropriations that have been expired for more than 2 years 'shall be liquidated from any appropriations for the same general purpose, which, at the time of payment, are available for disbursement.' 2 U.S.C. §102a." United States General Accounting Office, Principles of Federal Appropriations Law, Third Edition, vol. I, January 2004, http://www.gao.gov/special.pubs/3rdEditionVol1.pdf, pp. 5-76 – 5-77. Chapter 5 ("Availability of Appropriations: Time") also has a section on the "Evolution of the Law" related to the treatment of unexpended balances. Another section in this chapter, on "Closed Appropriation Accounts" contains the following footnote on Treasury operations and the treatment of closed appropriations: "We commonly talk about "returning" appropriation balances to the Treasury. In point of fact, for the most part, they never leave the Treasury to begin with. An appropriation does not represent cash actually set aside in the Treasury. Government obligations are liquidated as needed through revenues and borrowing. Thus, the reversion of funds to the Treasury is not a movement of actual cash, but a bookkeeping adjustment that in the various ways discussed in the text, affects the government's legal authority to incur obligations and make expenditures." |
| 19. |
|
| 20. |
Constant (2019) dollar calculations are based on the Consumer Price Index for All Urban Consumers (CPI-U, Bureau of Labor Statistics, U.S. Department of Labor). |
| 21. |
For the 2019 formula, see U.S. Congress, House, Statement of Disbursements of the House, as compiled by the Chief Administrative Officer, from January 1, 2019, to March 31, 2019, part 3 of 3, H.Doc. 116-26, 116th Cong., 1st sess. (Washington: GPO, 2019), p. 2981. |
| 22. |
The Statement contains the following: "The total amount of each Member's 2012 Representational Allowance is 88.92% of the amount authorized in 2010. This is in accordance with a 5% reduction to the 2010 authorization mandated in House Resolution 22, agreed to on January 6, 2011, and a 6.4% reduction to the 2011 authorization as reflected in H.R. 2055, the Consolidated Appropriations Act, 2012 (P.L. 112-74)." U.S. Congress, House, Statement of Disbursements of the House, as compiled by the Chief Administrative Officer, from October 1, 2012, to December 31, 2012, part 3 of 3, H.Doc. 112-160, 112th Cong., 2nd sess. (Washington: GPO, 2012), p. 2409. |
| 23. |
The individual authorizations correspond to the legislative year (January 3-January 2), while appropriations correspond to the fiscal year (beginning October 1). The 2013 authorization was the first to follow redistricting after the 2010 census and 2012 election cycle. Since the variables in the MRA formula—including distance from DC, the cost of office space, and the number of nonbusiness addresses—account for district characteristics, the individual MRA may vary following redistricting. |
| 24. |
Pursuant to the Budget Control Act of 2011 (P.L. 112-25), as amended by the American Taxpayer Relief Act of 2012 (P.L. 112-240), a sequestration order was issued on March 1, 2013 (White House, President Obama, Sequestration Order for Fiscal Year 2013 Pursuant to Section 251A of the Balanced Budget and Emergency Deficit Control Act, As Amended, March 1, 2013, available at https://www.govinfo.gov/content/pkg/DCPD-201300132/pdf/DCPD-201300132.pdf). |
| 25. |
The Statement contained the following: "Because the House is operating under a continuing resolution at FY 2012 levels, the total amount of funds available for MRAs remains unchanged.* However, to account for redistricting and other factors, individual MRAs have been recalculated using the sum of the following components adjusted proportionally to ensure the total is consistent with 2012 funding levels.... *This amount was reduced on March 4, 2013, by 8.2% to comply with sequestration orders issued pursuant to the Budget Control Act of 2011." U.S. Congress, House, Statement of Disbursements of the House, as compiled by the Chief Administrative Officer, from April 1, 2013, to June 30, 2013, part 3 of 3, H.Doc. 113-41, 113th Cong., 1st sess. (Washington: GPO, 2013), p. 2597. |
| 26. |
U.S. Congress, House, Statement of Disbursements of the House, as compiled by the Chief Administrative Officer, from April 1, 2014, to June 30, 2014, part 3 of 3, H.Doc. 113-141, 113th Cong., 2nd sess. (Washington: GPO, 2014), p. 2559. |
| 27. |
U.S. Congress, House, Statement of Disbursements of the House, as compiled by the Chief Administrative Officer, from January 1, 2015, to March 31, 2015, part 3 of 3, H.Doc. 114-29, 114th Cong., 1st sess. (Washington: GPO, 2015), p. 2854. |
| 28. |
U.S. Congress, House, Statement of Disbursements of the House, as compiled by the Chief Administrative Officer, from January 1, 2016, to March 31, 2016, part 3 of 3, H.Doc. 114-120, 114th Cong., 2nd sess. (Washington: GPO, 2016), p. 2861. For information on the relationship between the appropriations and allocations, see the section on "Appropriations and Allocations: Timing Differences with the Overall Fiscal Year Appropriation and Individual Member Calendar Year Authorization." |
| 29. |
U.S. Congress, House, Statement of Disbursements of the House, as compiled by the Chief Administrative Officer, from April 1, 2017, to June 30, 2017, part 3 of 3, H.Doc. 115-52, 115th Cong., 1st sess. (Washington: GPO, 2017), p. 2664. |
| 30. |
U.S. Congress, House Committee on Appropriations, Subcommittee on Legislative Branch, Legislative Branch, 2018, report to accompany H.R. 3162, 115th Cong., 1st sess., July 6, 2017, H.Rept. 115-199 (Washington: GPO, 2017), p. 3. See also the Members' Congressional Handbook, https://cha.house.gov. |
| 31. |
On July 18, the text of H.R. 3162 was included in a print issued by the House Rules Committee entitled, "Text of the Defense, Military Construction, Veterans Affairs, Legislative Branch, and Energy And Water Development National Security Appropriations Act, 2018" (Committee Print 115-30, which also contains the text of H.R. 3219, H.R. 2998, and H.R. 3266). Subsequently, the House agreed on September 14 to H.Res. 500, which included the text of Rules Committee Print 115-31, as amended, in an amendment in the nature of a substitute for H.R. 3354. The text of the legislative branch bill, as agreed to in H.R. 3219, was unchanged. H.R. 3354, which then included text for all 12 appropriations bills, was agreed to in the House on September 14, 2017. |
| 32. |
|
| 33. |
The updated Handbook is available at https://cha.house.gov/. |
| 34. |
U.S. Congress, House, Statement of Disbursements of the House, as compiled by the Chief Administrative Officer, from July 1, 2018, to September 30, 2018, part 3 of 3, H.Doc. 115-161, 115th Cong., 2nd sess. (Washington: GPO, 2018), p. 2523. |
| 35. |
U.S. Congress, House, Statement of Disbursements of the House, as compiled by the Chief Administrative Officer, from January 1, 2019, to March 31, 2019, part 3 of 3, H.Doc. 116-26, 116th Cong., 1st sess. (Washington: GPO, 2019), p. 2981. |
| 36. |
The Members' Handbook is available at https://cha.house.gov/. |
| 37. |
For example, recent Dear Colleague letters issued by the Committee on House Administration have included "Deadline to Use Obligated Funds-April 1," March 26, 2019; "End-of-Year Expenses: Policies and Best Practices," December 6, 2018; and "Updates to the Members' and Committees' Congressional Handbooks," March 5, 2018. |
| 38. |
For example: Dear Colleague letter from the Sergeant at Arms related to travel for the funeral of a deceased Member of Congress, March 19, 2018; and Dear Colleague letter from the Committee on House Administration, "2018 Conference and Caucus Retreats," January 8, 2018. |
| 39. |
For example, Dear Colleague letters issued by the Committee on House Administration have included, "Using Your MRA for District Office Security Assessments and Upgrades," January 18, 2011; and, "Automated Calls to Mobile Devices," July 26, 2016. |
| 40. |
For example, Dear Colleague Letter from the CAO [Chief Administrative Officer] of the House, "Increased Transparency in Statement of Disbursements," August 18, 2011; Dear Colleague Letter from the CAO of the House, "Statement of Disbursements to Publish Merchant Information for Purchase Card Transactions," CAO of the House, June 22, 2012; and Dear Colleague Letter from the CAO of the House, "First Quarter 2019 Statement of Disbursements," May 28, 2019. |
| 41. |
This classification system is based on U.S. Office of Management and Budget, OMB Circular A-11, 2019 edition, https://www.whitehouse.gov/omb/information-for-agencies/circulars/. |
| 42. |
This may include, for example: office supplies, bottled water, and publication/reference material. |
| 43. |
Member pay is included in a permanent appropriation (P.L. 97-51; 95 Stat. 966; September 11, 1981). |
| 44. |
For example, in a "Dear Colleague" letter of April 20, 2009, the Committee on House Administration announced that effective June 1, 2009, the transit benefit program would be administered centrally and available to all qualifying House employees. Previously, Members could determine whether or not to provide the transit benefit to their employees from the MRA, and those who offered this benefit would record the expenditure under the personnel benefits category. For another example, certain security-related costs, including "the cost of ... District Office security upgrades, maintenance, and monthly monitoring fees," is now supported by the House Sergeant at Arms ("Dear Colleague" letter of July 28, 2017, issued by House Sergeant at Arms Paul D. Irving). |
| 45. |
The Statements of Disbursements are available at https://www.house.gov/the-house-explained/open-government/statement-of-disbursements. |
| 46. |
Since the MRA is available through January 2, but the Statements for the fourth quarter cover obligations through December 31, personnel compensation for January 1 and January 2 in an MRA year will usually appear in the volume for the subsequent calendar year (January 1-March 31), under a heading indicating that it is billed to the previous MRA year. |
| 47. |
For 2009-2016, calculations are based on 12 quarters. For 2017, 9 quarters are available as of the date of this update. Preliminary data are provided. |
| 48. |
These may include, for example: the cost-of-living in the districts from which Members are elected; actual transportation costs to and from the district or around the district; geographical size of the district; number of people living in the district; or other characteristics of a district that may influence spending patterns, including varying expectations among constituents for different levels or types of contact. |
| 49. |
See also information on average expenditures for FY2013 provided for the record during the House Appropriations Committee FY2015 hearings (U.S. Congress, House Committee on Appropriations, Subcommittee on the Legislative Branch, Legislative Branch Appropriations for 2015, hearings, 113th Cong., 2nd sess., March 6, 2014 [Washington: GPO, 2014], pp. 292-293). |