Staff Pay, Selected Positions in Senators’ Offices, FY2001-FY2023
Changes from June 11, 2019 to April 20, 2021
This page shows textual changes in the document between the two versions indicated in the dates above. Textual matter removed in the later version is indicated with red strikethrough and textual matter added in the later version is indicated with blue.
Staff Pay Levels for Selected Positions in Senators' Offices, FY2001-FY2018
Contents
Tables
- Table 1. Annual Maximum Pay for Selected Staff in Senators' Offices, 2001-2019
- Table 2. Change in Median Pay for Selected Staff In Senators' Offices, Selected Periods
- Table 3. Administrative Director
- Table 4. Casework Supervisor
- Table 5. Caseworker
- Table 6. Chief of Staff
- Table 7. Communications Director
- Table 8. Constituent Service Representative
- Table 9. Counsel
- Table 10. Executive Assistant
- Table 11. Field Representative
- Table 12. Legislative Assistant
- Table 13. Legislative Correspondent
- Table 14. Legislative Director
- Table 15. Press Secretary
- Table 16. Scheduler
- Table 17. Staff Assistant
- Table 18. State Director
Summary
Staff Pay Levels for Selected Positions in April 20, 2021 Senators’ Offices, FY2001-FY2020 R. Eric Petersen Levels of pay for congressional staff are a source of recurring questions among Members of Specialist in American Congress, congressional staff, and the public. There may be interest in congressional pay data National Government from multiple perspectives, including assessment of the costs of congressional operations, guidance in setting pay levels for staff in Member offices, or comparison of congressional staff pay levels with those of other federal government pay systems.
This report provides pay data for 1624 staff position titles that are typically found in Senators' offices. The positions include the following: Administrative Director, Casework Supervisor, Caseworker, Chief of Staff, Communications Director, Constituent Services Representative, Counsel, Executive Assistant, Field Representative, Legislative Assistant, Legislative Correspondent, Legislative Director, Press Secretary, Scheduler, Staff Assistant, and State Director. The following table provides’ offices. The following table provides the positions, and the change in median pay levels between FY2019 and FY2020 for thosefor these positions, in constant 2019 dollars between FY2017 and FY2018.
Percentage Change in Median Pay for Selected Staff In Senators' Offices, FY2017-FY2018
|
Position |
FY17-FY18 |
Position |
FY17-FY18 |
|
Administrative Director |
-2.36% |
Field Representative |
-3.86% |
|
Casework Supervisor |
-3.21% |
Legislative Assistant |
8.04% |
|
Caseworker |
-18.02% |
Legislative Correspondent |
-2.13% |
|
Chief of Staff |
-2.38% |
Legislative Director |
4.81% |
|
Communications Director |
-0.38% |
Press Secretary |
-10.67% |
|
Constituent Services Representative |
-0.18% |
Scheduler |
-11.24% |
|
Counsel |
4.94% |
Staff Assistant |
4.68% |
|
Executive Assistant |
7.85% |
State Director |
-0.60% |
Source: Report of the Secretary of the Senate, as collated by LegiStorm, positions, in constant 2021 dollars.
Selected Staf Positions and Percentage Change in Median Pay, FY2019-FY2020
Change
Change
Change
Position
FY19-FY20
Position
FY19-FY20
Position
FY19-FY20
Administrative Director
3.45%
Deputy Press Secretary
3.68%
Press Secretary
-5.27%
Caseworker
-15.42%
Executive Assistant
11.86%
Regional Director
-0.97%
Chief of Staff
0.40%
Field Representative
-10.27%
Regional Representative
-13.83%
Communications Director
2.44%
Legislative Aide
0.98%
Scheduler
-9.37%
Constituent Services Representative
-2.43%
Legislative Assistant
1.17%
Scheduling Director
8.09%
Correspondence Manager
2.60%
Legislative Correspondent
2.13%
Speechwriter
-20.33%
Counsel
-3.83%
Legislative Director
2.69%
Staff Assistant
0.75%
Deputy Chief of Staff
6.34%
Press Assistant
3.42%
State Director
-7.07%
Source: Report of the Secretary of the Senate, as col ated by LegiStorm, various years, and CRS calculations. Change is based on constant 2021 dol ars.
constant 2019 dollars.
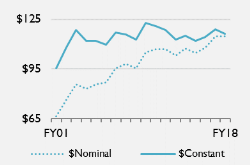
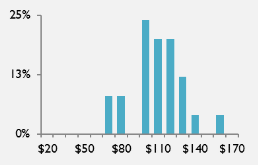
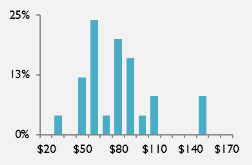
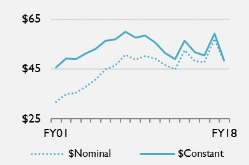
Report tables provide aggregate statistics on pay for eachmost staff position for FY2001, FY2004, FY2009, and FY2014-FY2018, positions for FY2001, FY2006, FY2011, and FY2016-FY2020, including quartiles, the median, and average pay. Complete data, FY2001-FY2018, since 2001 or later are available to congressional requestersclients upon request. Graphic displays are also included, providing representations of pay from two perspectives, including the following:
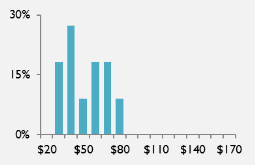
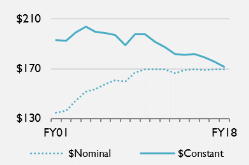
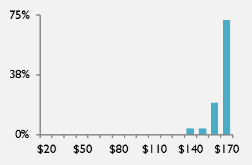
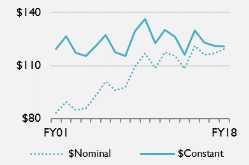
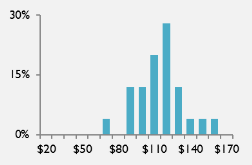
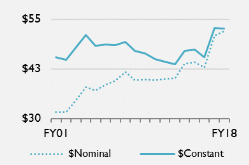
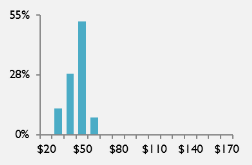
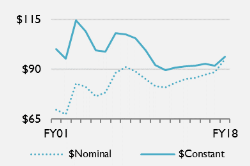
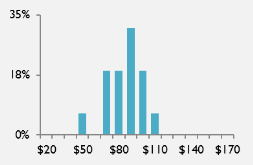
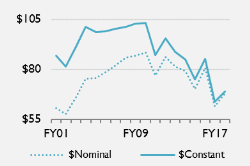
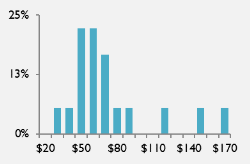
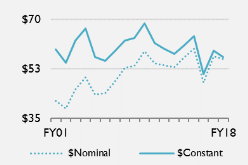
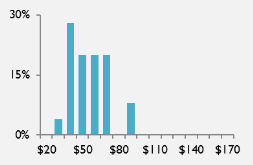
a line graphthe following two perspectives: a line graph for most positions showing change in median pay, FY2001-FY2018,FY2020, in nominal (current) and constant20192021 dollars; anddistributions of FY2018 distributions for all positions of FY2020 pay in constant20192021 dollars, in $10,000
The Congressional Research Service provides a number of products on staffing issues. These can be found in CRS Report R44688, Congressional Staff: CRS Products on Size, Pay, and Job Tenure.
Introduction
Job Tenure, and Duties.
Congressional Research Service
link to page 4 link to page 5 link to page 6 link to page 9 link to page 7 link to page 8 link to page 10 link to page 11 link to page 12 link to page 13 link to page 14 link to page 15 link to page 16 link to page 17 link to page 18 link to page 19 link to page 20 link to page 21 link to page 22 link to page 23 link to page 24 link to page 25 link to page 26 link to page 27 link to page 28 link to page 29 link to page 30 link to page 31 link to page 32 link to page 33 link to page 34 Staff Pay Levels for Selected Positions in Senators’ Offices, FY2001-FY2020
Contents
Introduction ................................................................................................................... 1 Data Concerns ................................................................................................................ 2 Data Tables and Visualizations .......................................................................................... 3 Senate Member Office Staff Pay Tables .............................................................................. 6
Tables Table 1. Annual Maximum Pay for Selected Staff in Senators’ Offices, 2001-2021 .................... 4 Table 2. Change in Median Pay for Selected Staff In Senators’ Offices, Selected Periods ........... 5 Table 3. Administrative Director........................................................................................ 7 Table 4. Caseworker ........................................................................................................ 8 Table 5. Chief of Staff...................................................................................................... 9 Table 6. Communications Director................................................................................... 10 Table 7. Constituent Service Representative ...................................................................... 11 Table 8. Correspondence Manager ................................................................................... 12 Table 9. Counsel ........................................................................................................... 13 Table 10. Deputy Chief of Staff ....................................................................................... 14 Table 11. Deputy Press Secretary ..................................................................................... 15 Table 12. Executive Assistant .......................................................................................... 16 Table 13. Field Representative ........................................................................................ 17 Table 14. Legislative Aide .............................................................................................. 18 Table 15. Legislative Assistant ........................................................................................ 19 Table 16. Legislative Correspondent ................................................................................ 20 Table 17. Legislative Director ......................................................................................... 21 Table 18. Press Assistant ................................................................................................ 22 Table 19. Press Secretary................................................................................................ 23 Table 20. Regional Director ............................................................................................ 24 Table 21. Regional Representative ................................................................................... 25 Table 22. Scheduler ....................................................................................................... 26 Table 23. Scheduling Director ......................................................................................... 27 Table 24. Speechwriter................................................................................................... 28 Table 25. Staff Assistant ................................................................................................. 29 Table 26. State Director.................................................................................................. 30
Contacts Author Information ....................................................................................................... 31
Congressional Research Service
link to page 7 Staff Pay Levels for Selected Positions in Senators’ Offices, FY2001-FY2020
Introduction Levels of pay for congressional staff are a source of recurring questions among Members of Congress, congressional staff, and the public. Senators set the terms and conditions of employment for staff in their offices. These include job titles and descriptions;1 rates of pay, subject to minimum and maximum levels;12 and resources available to them to carry out their official duties.23 There may be interest in congressional pay data from multiple perspectives,
including assessment of the costs of congressional operations, guidance in setting pay levels for staff in Senators'’ offices, or comparison of congressional staff pay levels with those of other
federal government pay systems.
Publicly available information sources do not provide aggregated congressional staff pay data in a readily retrievable form. The most recent publicly available Senate staff compensation report was issued in 2006,34 and relied on anonymous, self-reported survey data. Data in this report are based on official, retrievable Senate reports, which afford the opportunity to use data from a consistent, authoritative source. Pay4 information in this report is based on the Senate'’s Report of the
Secretary of the Senate,5 published semiannuallysemiannual y, in periods from April 1 to September 30, and October 1 to March 31,56 as collated by LegiStorm, a private entity that provides some congressional data by subscription.67 Annual data allowal ow for observations about the nature of Senators'
Senators’ personal staff compensation over time.
This report provides pay data for 1624 staff position titles that are typicallytypical y found in Senators' offices.7’
offices.8 The positions include the following:
Administrative Director
Deputy Press Secretary
Press Secretary
Caseworker
Executive Assistant
Regional Director
Chief of Staff
Field Representative
Regional Representative
Communications Director
Legislative Aide
Scheduler
Constituent Services Representative Legislative Assistant
Scheduling Director
Correspondence Manager
Legislative Correspondent
Speechwriter
Counsel
Legislative Director
Staff Assistant
Deputy Chief of Staff
Press Assistant
State Director
1 For examples of staff roles duties and qualifications, see CRS Report R46262, Congressional Staff: Duties, Qualifications, and Skills Identified by Mem bers of Congress for Selected Positions, by R. Eric Petersen.
2 Since 2019, the minimum level of gross annual pay has been $3,164 for Senate staff. T he maximum annual pay for staff in a Senator’s personal office has since 2019 been $173,900; see 2 U.S.C. 4575. Maximum payable rates for staff in a Senator’s office since 2001 are available in Table 1. 3 For discussion of resources available to Members to carry out their official duties, see CRS Report RL30064, Congressional Salaries and Allowances: In Brief, by Ida A. Brudnick. 4 U.S. Senate, Secretary of the Senate, 2006 U.S. Senate Employment, Compensation, Hiring and Benefits Study (Washington: 2006).
5 In this report, pay refers to monies paid by the Senate to staff, and excludes other components of total compensation, which might include paid leave or employer contributions to various insurance and retirement benefits. 6 T he Report of the Secretary of the Senate since April 2011 is available at https://www.senate.gov/legislative/common/generic/report_secsen.htm.
7 See http://www.legistorm.com/. 8 Pay data for Correspondence Manager, Deputy Chief of Staff, Deputy Press Secretary, Legislative Aide, Press Assistant, Regional Director, Regional Representative, Scheduling Director, and Speechwriter are available FY2019 -FY2020.
Congressional Research Service
1
Staff Pay Levels for Selected Positions in Senators’ Offices, FY2001-FY2020
The collection of Senators’ staff pay data for FY2001-FY2020 The positions include the following:
- Administrative Director
- Casework Supervisor8
- Caseworker9
- Chief of Staff
- Communications Director
- Constituent Services Representative
- Counsel
- Executive Assistant
- Field Representative10
- Legislative Assistant
- Legislative Correspondent
- Legislative Director
- Press Secretary
- Scheduler
- Staff Assistant
- State Director
The collection of Senators' staff pay data for FY2001-FY2018 proceeded as follows. For each fiscal year, a random sample11 of 25 Senators'’ offices was taken for each position.9 Senate staff had to hold a position with the same job title in the Senator'’s office for the entire fiscal year examined, and not receive pay from any other congressional employing authority to be included. Generally
General y, each position has no more than one observation per Senator'’s office each fiscal year.
Every recorded payment ascribed in the LegiStorm data to those staff for the fiscal year is included in the calculation of a staffer'’s annual pay. Data collected for this report may differ from an employee'’s stated annual salary due to the inclusion of overtime, bonuses, or other payments12
in addition to base salary paid in the course of a year.
For some positions, it was not possible to identify 25 offices that employed staff in some positions for an entire year. In circumstances when data for 10 or fewer staff were identified for a position, this report provides no data.
The Congressional Research Service provides a number of products on staffing issues. These can be found in CRS Report R44688, Congressional Staff: CRS Products on Size, Pay, and Job Tenure.
, and Duties. Data Concerns
There may be some advantages to relying on official salary expenditure data instead of survey findings, but data presented here are subject to some challengeschal enges that could affect findings or their
interpretation. Some of the concerns include the following:
-
Since periods of time covered by the Report of the Secretary of the Senate
overlap the end of one Congress and convening of the next, data are not available for first-term Senators in the first session of a Congress. Data presented in this
report do not include staff serving in the offices of first-term Senators during the first nine months of their service.
13 - The Report of the Secretary of the Senate reports monies paid directly by the Senate to staff, but does not provide the individual value of other components of compensation, which might include paid leave or employer contributions to various insurance and retirement benefits.
-
Pay data provide no insight into the education, work experience, position tenure,
full- or part-time status of staff, or other potential explanations for levels of
compensation. - compensation for individuals.
Staff could be based in Washington, DC, state offices, or both.
- Potential differences might exist in the job duties of positions with the same title.
Aggregation of pay by job title rests on the assumption that staff with the same title carry out the same or similar tasks. Given the wide discretion congressional employing authorities have in setting the terms and conditions of employment,
9 Obtaining the salaries of every congressional staff member from every Senator’s office listed in the Report of the Secretary of the Senate is beyond the capacity of available resources. Each year, a different, random sample of Senators’ offices was taken for each position. T he large random samples of positions in Senators’ offices mean that a full accounting would be unlikely to yield significantly different results. At the same time, a study that examines pay data based on different job titles, or which combines pay data from positions of similar titles or duties (e.g., Legislative Assistant and Senior Legislative Assistant, or Executive Assistants, Schedulers, and Executive Assistant/Schedulers), could result in findings that are different from those provided here.
Congressional Research Service
2
link to page 7 link to page 8 link to page 10 link to page 10 link to page 33 link to page 9 Staff Pay Levels for Selected Positions in Senators’ Offices, FY2001-FY2020
employing authorities have in setting the terms and conditions of employment,there may be differences in the duties of similarly"“Throughout the Senate, individuals with the same job title perform vastly different duties."14
”10
Pay data provide no insight into the potential comparability of compensation for
similar position titles (e.g., Legislative Aide and Legislative Assistant); potential similarities in the duties of some positions (e.g., Press Secretary and Communications Director); or apparent similarities of duties between long-standing and more recently emerging position titles (e.g. Scheduler and Scheduling Director).11
Data Tables and Visualizations Data Tables and Visualizations
Tables in this section provide background information on Senate pay practices, comparative data for each position, and detailed data and visualizations for each positionposition. Table 1 provides the maximum payable rates for staff in Senators'’ offices since 2001 in both nominal (current) and
constant 20192021 dollars. Constant dollar calculations throughout the report are based on the Consumer Price Index for All Al Urban Consumers (CPI-U) for various years, expressed in constant 2019 dollars.15
2021 dollars.12
Table 2 provides available percentage changes in median pay in constant 20192021 dollars for each of the 1624 positions, Members of Congress,1613 and salaries paid under the General Schedule in Washington, DC, and surrounding areas, and in the Rest of the United States (RUS) area.1714 Table 3 through Table 18 through Table 26 provide tabular pay data for each staff position. The tables provide data for FY2001, FY2004, FY2009, and FY2014-FY2018,FY2006, FY2011, and FY2016-FY2020 for most positions,15 including data distributed
by quartile, including the median, as well asmedian pay, and average pay.16 The numbers of staff for which data were counted are identified as "Number"“Number” in the data tables. Staff pay tables also provide a comparison, at various intervals to FY2018FY2020, based on data availability, of the cumulative percentage change in median
pay for that position, in constant 20192021 dollars.
10 U.S. Senate, Committee on Rules and Administration, Senate Handbook (Washington: 1996), p. I-13. 11 See CRS Report R46262, Congressional Staff: Duties, Qualifications, and Skills Identified by Members of Congress for Selected Positions, by R. Eric Petersen. 12 U.S. Department of Labor, Bureau of Labor Statistics, Consumer Price Index, at http://www.bls.gov/cpi/tables.htm. 13 Member pay data are taken from CRS Report 97-1011, Salaries of Members of Congress: Recent Actions and Historical Tables, by Ida A. Brudnick. 14 General Schedule pay change is based on changes in pay levels, and not the pay of individuals. General Schedule pay tables are available at https://www.opm.gov/policy-data-oversight/pay-leave/salaries-wages/2021/general-schedule/. For a complete description of areas covered under the Washington-Baltimore-Northern Virginia, DC-MD-VA-WV-PA locality pay table, see https://www.opm.gov/policy-data-oversight/pay-leave/salaries-wages/2021/locality-pay-area-definitions/#DC. For areas covered by the RUS, see https://www.opm.gov/policy-data-oversight/pay-leave/salaries-wages/2021/locality-pay-area-definitions/#US.
15 Positions for which data are available FY2001-FY2020 include Administrative Director, Caseworker, Chief of Staff, Communications Director, Constituent Services Representative, Counsel, Executive Assistant, Field Representative, Legislative Assistant, Legislative Correspondent, Legislative Director, Press Assistant, Press Secretary, Scheduler, Staff Assistant, and State Director. 16 For a detailed explanation of statistics provided in this report, see Interpreting Pay Tables: Statistics Describing Pay Data, in “ Senate Member Office Staff Pay T ables.”
Congressional Research Service
3
link to page 6 link to page 6 Staff Pay Levels for Selected Positions in Senators’ Offices, FY2001-FY2020
Graphic displays are also included for each position, providing representations of pay from the
following two perspectives:
a line graph for most positions dollars.
Graphic displays are also included for each position, providing representations of pay from two perspectives, including the following:
a line graphshowing change in median pay, FY2001-FY2018,FY2020, in nominal20192021 dollars; anddistributions of FY2018 pay in 2019 distributions for al positions of FY2020 pay in constant 2021 dollars, in $10,000 increments.dollars, in $10,000 increments.
Table 1. Annual Maximum Pay for Selected Staff in Senators'’ Offices, 2001-2021
Constant
Year
Nominal $
2021 $
2001
$140,559
$208,746
2002
$145,459
$212,661
2003
$150,159
$214,641
2004
$153,459
$213,668
2005
$157,559
$212,188
2006
$160,659
$209,601
2007
$160,659
$203,796
2008
$164,759
$201,269
2009
$169,459
$207,750
2010
$169,459
$204,397
2011
$169,459
$198,143
2012
$169,459
$194,126
2013
$169,459
$191,323
2014
$169,459
$188,269
2015
$169,459
$188,046
2016
$169,459
$185,703
2017
$169,459
$181,827
2018
$169,459
$177,494
2019
$173,900
$178,904
2020
$173,900
$176,724
2021
$173,900
$173,900
Source: 2 U.S.C. 4575, CRS calculations. Detailed information about data sources is available above in “ Data Offices, 2001-2019
|
Year |
Nominal $ |
| ||
|
2001 |
|
| ||
|
2002 |
|
| ||
|
2003 |
|
| ||
|
2004 |
|
| ||
|
2005 |
|
| ||
|
2006 |
|
| ||
|
2007 |
|
| ||
|
2008 |
|
| ||
|
2009 |
|
| ||
|
2010 |
|
| ||
|
2011 |
|
| ||
|
2012 |
|
| ||
|
2013 |
|
| ||
|
2014 |
|
| ||
|
2015 |
|
| ||
|
2016 |
|
| ||
|
2017 |
|
| ||
|
2018 |
|
| ||
|
2019 |
|
|
Source: 2 U.S.C. 4575, note, CRS calculations. Detailed information about data sources is available above in "Data Tables and Visualizations."
Tables and Visualizations.”
Congressional Research Service
4
link to page 10 link to page 33 link to page 6 Staff Pay Levels for Selected Positions in Senators’ Offices, FY2001-FY2020
Table 2. Change in Median Pay for Selected Staff In Senators'’ Offices, Selected
Periods
Change Based on Constant 2021 Dol ars
FY19-FY20 FY16-FY20 FY11-FY20 FY06-FY20 FY01-FY20
Administrative Director
3.45%
5.82%
-0.13%
10.31%
26.44%
Caseworker
-15.42%
7.13%
-2.87%
-4.31%
18.42%
Chief of Staff
0.40%
-5.49%
-11.66%
-14.81%
-12.46%
Communications Director
2.44%
4.50%
4.88%
0.92%
7.76%
Constituent Services Representative
-2.43%
3.45%
4.65%
-3.58%
3.48%
Correspondence Manager
2.60%
—
—
—
—
Counsel
-3.83%
0.69%
1.11%
-5.67%
-6.96%
Deputy Chief of Staff
6.34%
—
—
—
—
Deputy Press Secretary
3.68%
—
—
—
—
Executive Assistant
11.86%
-8.68%
-10.46%
-21.20%
-10.25%
Field Representative
-10.27%
10.51%
-9.11%
1.20%
-5.64%
Legislative Aide
0.98%
—
—
—
—
Legislative Assistant
1.17%
-0.95%
-3.74%
0.18%
-1.26%
Legislative Correspondent
2.13%
9.42%
9.72%
7.10%
9.28%
Legislative Director
2.69%
-6.05%
-5.90%
-6.32%
-0.70%
Press Assistant
3.42%
—
—
—
—
Press Secretary
-5.27%
-0.24%
4.80%
-9.04%
-23.35%
Regional Director
-0.97%
—
—
—
—
Regional Representative
-13.83%
—
—
—
—
Scheduler
-9.37
-8.80
-18.63
-18.44
-8.78
Scheduling Director
8.09%
—
—
—
—
Speechwriter
-20.33%
—
—
—
—
Staff Assistant
0.75%
13.69%
10.86%
-3.05%
5.64%
State Director
-7.07%
-7.67%
-7.16%
1.46%
13.58%
Congressional Staff Positions Pay Change Summary
Increase
14
8
6
6
7
Decrease
10
7
9
9
8
Members of Congress, General Schedule Pay Change
Members of Congress
-1.60%
-10.21%
-15.84%
-20.56%
-20.54%
General Schedule, DC
1.87%
0.04%
-2.96%
0.10%
7.61%
General Schedule, Rest of U.S.
1.20%
-2.99%
-6.17%
-7.11%
-2.11%
Source: CRS calculations, based on pay data provided in Table 3-Table 26 for congressional positions in constant, 2021 dol ars; CRS Report 97-1011, Salaries of Members Offices, Selected Periods
|
Change Based on Constant, 2019 Dollars |
|||||
|
FY17-FY18 |
FY14-FY18 |
FY09-FY18 |
FY04-FY18 |
FY01-FY18 |
|
|
Administrative Director |
-2.36% |
0.88% |
3.05% |
3.93% |
21.65% |
|
Casework Supervisor |
-3.21% |
3.83% |
-9.81% |
0.30% |
13.49% |
|
Caseworker |
-18.02% |
-13.96% |
-15.64% |
-5.04% |
6.52% |
|
Chief of Staff |
-2.38% |
-5.49% |
-13.27% |
-15.90% |
-11.23% |
|
Communications Director |
-0.38% |
3.84% |
-6.77% |
4.65% |
1.12% |
|
Constituent Services Representative |
-0.18% |
11.96% |
11.96% |
3.28% |
15.97% |
|
Counsel |
4.94% |
5.44% |
-8.64% |
-11.75% |
-3.94% |
|
Executive Assistant |
7.85% |
-19.03% |
-33.13% |
-32.08% |
-20.77% |
|
Field Representative |
-3.86% |
-6.49% |
-10.57% |
-15.00% |
-4.45% |
|
Legislative Assistant |
8.04% |
6.94% |
-1.80% |
-2.27% |
-0.80% |
|
Legislative Correspondent |
-2.13% |
-1.86% |
-1.55% |
-0.33% |
2.21% |
|
Legislative Director |
4.81% |
5.12% |
-6.56% |
4.76% |
7.03% |
|
Press Secretary |
-10.67% |
3.85% |
-12.22% |
-16.61% |
-26.63% |
|
Scheduler |
-11.24% |
1.18% |
-11.48% |
-3.44% |
12.30% |
|
Staff Assistant |
4.68% |
5.63% |
-0.64% |
-14.68% |
-0.35% |
|
State Director |
-0.60% |
2.99% |
4.38% |
5.81% |
23.50% |
|
Members of Congress |
-2.38% |
-5.72% |
-14.56% |
-17.21% |
-15.43% |
|
General Schedule, DC |
-0.14% |
1.66% |
-4.77% |
1.16% |
8.19% |
|
General Schedule, Rest of U.S. |
-0.75% |
-0.46% |
-7.29% |
-5.91% |
-0.34% |
| |||||
|
Increase |
5 |
11 |
3 |
6 |
9 |
|
Decrease |
11 |
5 |
13 |
10 |
7 |
Source: CRS calculations, based on pay data provided in Table 3-Table 18 for congressional positions in constant, 2019 dollars; CRS Report 97-1011, Salaries of Members of Congress: Recent Actions and Historical Tables, by Ida A. Brudnick, for Members of Congress; and the Office of Personnel Management for federal civilian workers workers in the District of Columbia and surrounding areas and rest of the U.S., various years. Detailed “—“ indicates data are unavailable. Detailed information about data sources is available above in "“Data Tables and Visualizations."
.”
Congressional Research Service
5
link to page 10 link to page 33 link to page 33 Staff Pay Levels for Selected Positions in Senators’ Offices, FY2001-FY2020
Senate Member Office Staff Pay Tables
Senate Member Office Staff Pay Tables
Interpreting Pay Tables: Statistics Describing Pay Data
For each year that data are available, statistical values for staff positions are included in Table
Statistical Measures Used in Pay Tables
|
|
Nominal, Current $ |
Constant, 2019, $ |
|||||||||||||||||
|
Year |
Number |
Minimum |
25 %ile |
50 %ile Median |
75 %ile |
Maximum |
Average |
Minimum |
25 %ile |
50 %ile Median |
75 %ile |
Maximum |
Average |
|||||
|
FY01 |
10 |
$46,340 |
$61,630 |
$66,542 |
$73,599 |
$76,500 |
$66,200 |
$66,515 |
$88,462 |
$95,512 |
$105,641 |
$109,805 |
$95,020 |
|||||
|
FY04 |
18 |
$33,750 |
$71,408 |
$83,080 |
$100,410 |
$142,968 |
$83,942 |
$45,417 |
$96,093 |
$111,800 |
$135,121 |
$192,392 |
$112,961 |
|||||
|
FY09 |
25 |
$46,459 |
$85,297 |
$95,164 |
$111,170 |
$140,250 |
$96,479 |
$55,048 |
$101,067 |
$112,758 |
$131,723 |
$166,180 |
$114,316 |
|||||
|
Most Recent Five Years |
||||||||||||||||||
|
FY14 |
25 |
$50,937 |
$87,667 |
$107,265 |
$122,484 |
$139,080 |
$103,458 |
$54,696 |
$94,134 |
$115,179 |
$131,521 |
$149,341 |
$111,091 |
|||||
|
FY15 |
25 |
$56,375 |
$97,357 |
$104,433 |
$117,500 |
$150,522 |
$106,212 |
$60,462 |
$104,415 |
$112,005 |
$126,019 |
$161,436 |
$113,913 |
|||||
|
FY16 |
25 |
$40,625 |
$82,276 |
$107,752 |
$123,750 |
$154,035 |
$101,903 |
$43,028 |
$87,142 |
$114,125 |
$131,069 |
$163,145 |
$107,930 |
|||||
|
FY17 |
25 |
$63,667 |
$100,937 |
$114,750 |
$128,875 |
$160,192 |
$114,516 |
$66,025 |
$104,676 |
$119,000 |
$133,648 |
$166,125 |
$118,758 |
|||||
|
FY18 |
25 |
$72,510 |
$102,840 |
$114,778 |
$126,262 |
$161,458 |
$113,389 |
$73,404 |
$104,107 |
$116,192 |
$127,818 |
$163,448 |
$114,786 |
|||||
|
Median Pay |
FY18 Pay Distribution |
Change |
||||||||||||||||
|
| FY17-FY18 FY14-FY18 FY09-FY18 FY04-FY18 FY01-FY18 | -2.36% 0.88% 3.05% 3.93% 21.65% | |||||||||||||||
|
Dollars in figures are in thousands. |
||||||||||||||||||
Source: Report of the Secretary of the Senate, as collated by LegiStorm, various years, and CRS calculations. Percentage change in pay is based on the change in median pay (expressed in constant, March 2019 dollarsFebruary 2021 dol ars) for the periods noted. In the visualizations, position pay information based on constant 2019 dollars2021 dol ars in thousands of dollars, dol ars, or change in those levels, are presented in solid blue. Detailed information about data sources is available above in "“Data Tables and Visualizations.".” Data provided here are partial; complete data, FY2001-FY2018FY2020, are available to congressional requesters upon request.
CRS-7
link to page 6
Table 4. Caseworker
Nominal, Current $
Constant, 2021 $
50 %ile
50 %ile
Year Number Minimum
25 %ile
Median
75 %ile
Maximum Average Minimum
25 %ile
Median
75 %ile
Maximum Average
FY01
25
$23,227
$27,873
$31,781
$39,900
$61,039
$34,342
$34,495
$41,394
$47,199
$59,256
$90,650
$51,001
FY06
25
$27,318
$37,125
$44,771
$49,923
$75,438
$46,457
$35,640
$48,434
$58,409
$65,131
$98,418
$60,609
FY11
16
$33,828
$41,061
$49,213
$62,820
$85,000
$52,746
$39,554
$48,011
$57,543
$73,453
$99,388
$61,674
Most Recent Five Years
FY16
25
$23,355
$39,583
$47,607
$62,955
$86,458
$50,554
$25,594
$43,378
$52,171
$68,990
$94,746
$55,400
FY17
21
$35,000
$41,958
$57,156
$68,523
$87,500
$56,058
$37,554
$45,021
$61,328
$73,525
$93,886
$60,150
FY18
22
$31,000
$43,437
$48,000
$64,850
$70,000
$51,829
$32,470
$45,497
$50,276
$67,925
$73,319
$54,286
FY19
18
$41,250
$50,991
$64,235
$71,875
$90,000
$63,324
$42,437
$52,458
$66,083
$73,943
$92,590
$65,146
FY20
23
$34,862
$47,502
$55,000
$68,285
$92,500
$58,711
$35,428
$48,273
$55,893
$69,394
$94,002
$59,664
Median Pay
FY20 Pay Distribution
Change
FY19-FY20
-15.42%
FY16-FY20
7.13%
FY11-FY20
-2.87%
FY06-FY20
-4.31%
FY01-FY20
18.42%
Dol ars in figures are in thousands.
Source: Report of the Secretary of the Senate, as col ated by LegiStorm, various years, and CRS calculations. requesters upon request.
|
Nominal, Current $ |
Constant, 2019, $ |
||||||||||||||||
|
Year |
Number |
Minimum |
25 %ile |
50 %ile Median |
75 %ile |
Maximum |
Average |
Minimum |
25 %ile |
50 %ile Median |
75 %ile |
Maximum |
Average |
||||
|
FY01 |
25 |
$23,928 |
$45,479 |
$51,828 |
$56,550 |
$83,000 |
$50,594 |
$34,345 |
$65,279 |
$74,391 |
$81,169 |
$119,135 |
$72,621 |
||||
|
FY04 |
25 |
$27,500 |
$54,125 |
$62,549 |
$70,954 |
$88,679 |
$60,683 |
$37,007 |
$72,836 |
$84,172 |
$95,483 |
$119,335 |
$81,661 |
||||
|
FY09 |
25 |
$55,750 |
$69,349 |
$79,000 |
$87,875 |
$109,356 |
$79,269 |
$66,057 |
$82,171 |
$93,606 |
$104,122 |
$129,575 |
$93,924 |
||||
|
Most Recent Five Years |
|||||||||||||||||
|
FY14 |
25 |
$35,500 |
$66,427 |
$75,719 |
$86,800 |
$113,875 |
$74,974 |
$38,119 |
$71,328 |
$81,306 |
$93,204 |
$122,276 |
$80,505 |
||||
|
FY15 |
25 |
$37,829 |
$64,000 |
$79,500 |
$86,788 |
$118,500 |
$79,051 |
$40,572 |
$68,640 |
$85,264 |
$93,081 |
$127,092 |
$84,782 |
||||
|
FY16 |
25 |
$52,698 |
$67,264 |
$77,821 |
$90,251 |
$127,500 |
$81,928 |
$55,815 |
$71,242 |
$82,424 |
$95,588 |
$135,041 |
$86,773 |
||||
|
FY17 |
25 |
$46,219 |
$70,103 |
$84,106 |
$90,815 |
$115,167 |
$81,630 |
$47,931 |
$72,699 |
$87,221 |
$94,178 |
$119,432 |
$84,653 |
||||
|
FY18 |
25 |
$36,500 |
$62,017 |
$83,395 |
$96,754 |
$155,750 |
$84,682 |
$36,950 |
$62,782 |
$84,423 |
$97,947 |
$157,670 |
$85,726 |
||||
|
Median Pay |
FY18 Pay Distribution |
Change |
|||||||||||||||
|
| FY17-FY18 FY14-FY18 FY09-FY18 FY04-FY18 FY01-FY18 | -3.21% 3.83% -9.81% 0.30% 13.49% | ||||||||||||||
|
Dollars in figures are in thousands. |
|||||||||||||||||

Source: Report of the Secretary of the Senate, as collated by LegiStorm, various years, and CRS calculations. Percentage change in pay is based on the change in median pay (expressed in constant, March 2019 dollarsFebruary 2021 dol ars) for the periods noted. In the visualizations, position pay information based on constant 2019 dollars2021 dol ars in thousands of dollars, dol ars, or change in those levels, are presented in solid blue. Detailed information about data sources is available above in "“Data Tables and Visualizations.".” Data provided here are partial; complete data, FY2001-FY2018FY2020, are available to congressional requesters upon request.
CRS-8
link to page 6
Table 5. Chief of Staff
Nominal, Current $
Constant, 2021 $
50 %ile
50 %ile
Year Number Minimum
25 %ile
Median
75 %ile
Maximum Average Minimum
25 %ile
Median
75 %ile
Maximum Average
FY01
25
$103,657
$124,270
$134,630
$138,000
$139,609
$130,841
$153,942
$184,555 $199,941
$204,946
$207,335
$194,314
FY06
25
$130,600
$147,657
$157,486
$159,884
$160,659
$152,445
$170,385
$192,639 $205,461
$208,590
$209,601
$198,885
FY11
25
$138,500
$165,557
$169,459
$169,459
$169,459
$166,692
$161,943
$193,581 $198,143
$198,143
$198,143
$194,908
Most Recent Five Years
FY16
25
$154,500
$166,000
$169,000
$169,459
$169,459
$166,857
$169,310
$181,913 $185,200
$185,703
$185,703
$182,851
FY17
25
$126,775
$165,743
$169,459
$169,459
$169,459
$165,680
$136,028
$177,840 $181,827
$181,827
$181,827
$177,772
FY18
25
$143,815
$166,957
$169,459
$169,459
$169,459
$166,646
$150,634
$174,874 $177,494
$177,494
$177,494
$174,548
FY19
25
$155,877
$169,027
$169,459
$169,459
$169,459
$167,912
$160,363
$173,891 $174,335
$174,335
$174,335
$172,744
FY20
25
$161,196
$169,459
$172,235
$172,790
$172,790
$170,278
$163,814
$172,211 $175,032
$175,596
$175,596
$173,043
Median Pay
FY20 Pay Distribution
Change
FY19-FY20
0.40%
FY16-FY20
-5.49%
FY11-FY20
-11.66%
FY06-FY20
-14.81%
FY01-FY20
-12.46%
Dol ars in figures are in thousands.
Source: Report of the Secretary of the Senate, as col ated by LegiStorm, various years, and CRS calculations. requesters upon request.
|
Nominal, Current $ |
Constant, 2019, $ |
||||||||||||||||
|
Year |
Number |
Minimum |
25 %ile |
50 %ile Median |
75 %ile |
Maximum |
Average |
Minimum |
25 %ile |
50 %ile Median |
75 %ile |
Maximum |
Average |
||||
|
FY01 |
25 |
$23,227 |
$27,873 |
$31,781 |
$39,900 |
$61,039 |
$34,342 |
$33,339 |
$40,007 |
$45,617 |
$57,271 |
$87,613 |
$49,293 |
||||
|
FY04 |
25 |
$25,775 |
$31,250 |
$38,024 |
$41,982 |
$57,700 |
$38,761 |
$34,686 |
$42,053 |
$51,168 |
$56,495 |
$77,647 |
$52,160 |
||||
|
FY09 |
20 |
$37,837 |
$41,875 |
$48,611 |
$55,411 |
$92,988 |
$52,042 |
$44,833 |
$49,617 |
$57,599 |
$65,656 |
$110,180 |
$61,664 |
||||
|
Most Recent Five Years |
|||||||||||||||||
|
FY14 |
24 |
$21,167 |
$41,340 |
$52,598 |
$62,125 |
$81,250 |
$53,187 |
$22,728 |
$44,390 |
$56,478 |
$66,708 |
$87,244 |
$57,111 |
||||
|
FY15 |
21 |
$21,167 |
$42,083 |
$48,250 |
$66,485 |
$80,000 |
$52,439 |
$22,701 |
$45,135 |
$51,748 |
$71,306 |
$85,800 |
$56,241 |
||||
|
FY16 |
25 |
$23,355 |
$39,583 |
$47,607 |
$62,955 |
$86,458 |
$50,554 |
$24,736 |
$41,924 |
$50,423 |
$66,678 |
$91,572 |
$53,543 |
||||
|
FY17 |
21 |
$35,000 |
$41,958 |
$57,156 |
$68,523 |
$87,500 |
$56,058 |
$36,296 |
$43,512 |
$59,273 |
$71,061 |
$90,741 |
$58,135 |
||||
|
FY18 |
22 |
$31,000 |
$43,437 |
$48,000 |
$64,850 |
$70,000 |
$51,829 |
$31,382 |
$43,973 |
$48,592 |
$65,649 |
$70,863 |
$52,468 |
||||
|
Median Pay |
FY18 Pay Distribution |
Change |
|||||||||||||||
|
| FY17-FY18 FY14-FY18 FY09-FY18 FY04-FY18 FY01-FY18 | -18.02% -13.96% -15.64% -5.04% 6.52% | ||||||||||||||
|
Dollars in figures are in thousands. |
|||||||||||||||||
Source: Report of the Secretary of the Senate, as collated by LegiStorm, various years, and CRS calculations. Percentage change in pay is based on the change in median pay (expressed in constant, March 2019 dollarsFebruary 2021 dol ars) for the periods noted. In the visualizations, position pay information based on constant 2019 dollars2021 dol ars in thousands of dollars, dol ars, or change in those levels, are presented in solid blue. Detailed information information about data sources is available above in "“Data Tables and Visualizations.".” Data provided here are partial; complete data, FY2001-FY2018FY2020, are available to congressional requesters upon request.
CRS-9
link to page 6
Table 6. Communications Director
Nominal, Current $
Constant, 2021 $
50 %ile
50 %ile
Year Number Minimum
25 %ile
Median
75 %ile
Maximum Average Minimum
25 %ile
Median
75 %ile
Maximum Average
FY01
25
$42,189
$72,441
$83,186
$94,455
$128,974
$83,784
$62,655
$107,584 $123,541
$140,277
$191,542
$124,428
FY06
25
$74,431
$90,043
$101,108
$112,080
$152,000
$103,309
$97,105
$117,473 $131,908
$146,223
$198,304
$134,780
FY11
25
$90,000
$100,000
$108,562
$124,750
$168,547
$113,114
$105,234
$116,927 $126,938
$145,866
$197,077
$132,260
Most Recent Five Years
FY16
25
$75,344
$105,871
$116,250
$127,500
$148,750
$116,696
$82,566
$116,020 $127,394
$139,722
$163,009
$127,883
FY17
25
$92,000
$106,875
$116,875
$128,000
$155,000
$118,145
$98,715
$114,676 $125,405
$137,342
$166,313
$126,768
FY18
25
$76,717
$107,000
$119,270
$126,960
$163,275
$117,207
$80,355
$112,074 $124,925
$132,981
$171,017
$122,765
FY19
25
$94,583
$116,723
$126,320
$130,812
$169,459
$125,887
$97,305
$120,082 $129,955
$134,577
$174,335
$129,510
FY20
25
$57,000
$110,667
$131,000
$139,564
$172,790
$126,869
$57,926
$112,464 $133,127
$141,830
$175,596
$128,929
Median Pay
FY20 Pay Distribution
Change
FY19-FY20
2.44%
FY16-FY20
4.50%
FY11-FY20
4.88%
FY06-FY20
0.92%
FY01-FY20
7.76%
Dol ars in figures are in thousands.
Source: Report of the Secretary of the Senate, as col ated by LegiStorm, various years, and CRS calculations. requesters upon request.
|
Nominal, Current $ |
Constant, 2019, $ |
||||||||||||||||
|
Year |
Number |
Minimum |
25 %ile |
50 %ile Median |
75 %ile |
Maximum |
Average |
Minimum |
25 %ile |
50 %ile Median |
75 %ile |
Maximum |
Average |
||||
|
FY01 |
25 |
$103,657 |
$124,270 |
$134,630 |
$138,000 |
$139,609 |
$130,841 |
$148,784 |
$178,372 |
$193,242 |
$198,079 |
$200,389 |
$187,803 |
||||
|
FY04 |
25 |
$100,000 |
$142,000 |
$151,576 |
$152,526 |
$152,709 |
$145,165 |
$134,570 |
$191,089 |
$203,975 |
$205,253 |
$205,500 |
$195,347 |
||||
|
FY09 |
25 |
$147,960 |
$165,305 |
$166,926 |
$167,305 |
$167,305 |
$164,532 |
$175,316 |
$195,867 |
$197,789 |
$198,237 |
$198,237 |
$194,952 |
||||
|
Most Recent Five Years |
|||||||||||||||||
|
FY14 |
25 |
$141,050 |
$161,214 |
$169,042 |
$169,459 |
$169,459 |
$164,932 |
$151,456 |
$173,108 |
$181,514 |
$181,961 |
$181,961 |
$177,100 |
||||
|
FY15 |
25 |
$102,800 |
$167,000 |
$169,459 |
$169,459 |
$169,459 |
$162,671 |
$110,253 |
$179,108 |
$181,746 |
$181,746 |
$181,746 |
$174,466 |
||||
|
FY16 |
25 |
$154,500 |
$166,000 |
$169,000 |
$169,459 |
$169,459 |
$166,857 |
$163,638 |
$175,818 |
$178,995 |
$179,481 |
$179,481 |
$176,725 |
||||
|
FY17 |
25 |
$126,775 |
$165,743 |
$169,459 |
$169,459 |
$169,459 |
$165,680 |
$131,470 |
$171,882 |
$175,735 |
$175,735 |
$175,735 |
$171,816 |
||||
|
FY18 |
25 |
$143,815 |
$166,957 |
$169,459 |
$169,459 |
$169,459 |
$166,646 |
$145,587 |
$169,015 |
$171,548 |
$171,548 |
$171,548 |
$168,700 |
||||
|
Median Pay |
FY18 Pay Distribution |
Change |
|||||||||||||||
|
| FY17-FY18 FY14-FY18 FY09-FY18 FY04-FY18 FY01-FY18 | -2.38% -5.49% -13.27% -15.90% -11.23% | ||||||||||||||
|
Dollars in figures are in thousands. |
|||||||||||||||||
Source: Report of the Secretary of the Senate, as collated by LegiStorm, various years, and CRS calculations. Percentage change in pay is based on the change in median pay (expressed in constant, March 2019 dollarsFebruary 2021 dol ars) for the periods noted. In the visualizations, position pay information based on constant 2019 dollars2021 dol ars in thousands of dollars, dol ars, or change in those levels, are presented in solid blue. Detailed information about data sources is available above in "“Data Tables and Visualizations.".” Data provided here are partial; complete data, FY2001-FY2018FY2020, are available to congressional requesters upon request.
CRS-10
link to page 6
Table 7. Constituent Service Representative
Nominal, Current $
Constant, 2021 $
50 %ile
50 %ile
Year Number Minimum
25 %ile
Median
75 %ile
Maximum Average Minimum
25 %ile
Median
75 %ile
Maximum Average
FY01
19
$23,802
$26,801
$31,611
$37,367
$45,180
$31,778
$35,349
$39,802
$46,945
$55,495
$67,098
$47,194
FY06
25
$27,459
$34,498
$38,616
$46,125
$58,789
$40,340
$35,824
$45,007
$50,380
$60,176
$76,698
$52,628
FY11
25
$25,126
$34,567
$39,699
$45,000
$87,450
$42,471
$29,380
$40,418
$46,418
$52,617
$102,252
$49,660
Most Recent Five Years
FY16
25
$26,659
$38,806
$42,852
$46,500
$69,229
$43,881
$29,214
$42,526
$46,960
$50,957
$75,866
$48,087
FY17
25
$30,900
$44,456
$50,833
$54,187
$83,325
$49,863
$33,155
$47,701
$54,543
$58,142
$89,407
$53,503
FY18
25
$36,154
$41,310
$51,980
$56,500
$64,167
$49,749
$37,869
$43,269
$54,445
$59,179
$67,209
$52,108
FY19
25
$27,000
$40,000
$48,393
$55,000
$75,728
$48,905
$27,777
$41,151
$49,786
$56,583
$77,907
$50,312
FY20
25
$32,687
$41,800
$47,802
$52,000
$77,883
$48,928
$33,218
$42,479
$48,578
$52,844
$79,148
$49,722
Median Pay
FY20 Pay Distribution
Change
FY19-FY20
-2.43%
FY16-FY20
3.45%
FY11-FY20
4.65%
FY06-FY20
-3.58%
FY01-FY20
3.48%
Dol ars in figures are in thousands.
Source: Report of the Secretary of the Senate, as col ated by LegiStorm, various years, and CRS calculations. requesters upon request.
|
Nominal, Current $ |
Constant, 2019, $ |
||||||||||||||||
|
Year |
Number |
Minimum |
25 %ile |
50 %ile Median |
75 %ile |
Maximum |
Average |
Minimum |
25 %ile |
50 %ile Median |
75 %ile |
Maximum |
Average |
||||
|
FY01 |
25 |
$42,189 |
$72,441 |
$83,186 |
$94,455 |
$128,974 |
$83,784 |
$60,556 |
$103,979 |
$119,402 |
$135,577 |
$185,124 |
$120,259 |
||||
|
FY04 |
25 |
$56,908 |
$76,001 |
$85,733 |
$110,160 |
$142,726 |
$92,741 |
$76,581 |
$102,275 |
$115,371 |
$148,242 |
$192,065 |
$124,801 |
||||
|
FY09 |
25 |
$75,400 |
$92,333 |
$109,296 |
$121,277 |
$156,687 |
$111,197 |
$89,340 |
$109,404 |
$129,503 |
$143,699 |
$185,656 |
$131,756 |
||||
|
Most Recent Five Years |
|||||||||||||||||
|
FY14 |
25 |
$80,000 |
$99,500 |
$108,288 |
$122,836 |
$157,137 |
$112,337 |
$85,902 |
$106,841 |
$116,277 |
$131,899 |
$168,730 |
$120,625 |
||||
|
FY15 |
25 |
$95,675 |
$102,000 |
$121,065 |
$132,797 |
$169,459 |
$122,710 |
$102,612 |
$109,395 |
$129,843 |
$142,426 |
$181,746 |
$131,607 |
||||
|
FY16 |
25 |
$75,344 |
$105,871 |
$116,250 |
$127,500 |
$148,750 |
$116,696 |
$79,800 |
$112,133 |
$123,126 |
$135,041 |
$157,548 |
$123,598 |
||||
|
FY17 |
25 |
$92,000 |
$106,875 |
$116,875 |
$128,000 |
$155,000 |
$118,145 |
$95,408 |
$110,833 |
$121,204 |
$132,741 |
$160,741 |
$122,520 |
||||
|
FY18 |
25 |
$76,717 |
$107,000 |
$119,270 |
$126,960 |
$163,275 |
$117,207 |
$77,663 |
$108,319 |
$120,740 |
$128,525 |
$165,288 |
$118,652 |
||||
|
Median Pay |
FY18 Pay Distribution |
Change |
|||||||||||||||
|
| FY17-FY18 FY14-FY18 FY09-FY18 FY04-FY18 FY01-FY18 | -0.38% 3.84% -6.77% 4.65% 1.12% | ||||||||||||||
|
Dollars in figures are in thousands. |
|||||||||||||||||
Source: Report of the Secretary of the Senate, as collated by LegiStorm, various years, and CRS calculations. Percentage change in pay is based on the change in median pay (expressed in constant, March 2019 dollarsFebruary 2021 dol ars) for the periods noted. In the visualizations, position pay information based on constant 2019 dollars2021 dol ars in thousands of dollars, dol ars, or change in those levels, are presented in solid blue. Detailed information about data sources is available above in "“Data Tables and Visualizations.".” Data provided here are partial; complete data, FY2001-FY2018FY2020, are available to congressional requesters upon request.
CRS-11
link to page 6
Table 8. Correspondence Manager
Nominal, Current $
Constant, 2021 $
50 %ile
50 %ile
Year Number Minimum
25 %ile
Median
75 %ile
Maximum Average Minimum
25 %ile
Median
75 %ile
Maximum Average
FY19
14
$40,375
$48,381
$54,635
$81,651
$130,500
$63,273
$41,537
$49,774
$56,207
$84,000
$134,255
$65,094
FY20
13
$40,265
$53,000
$56,745
$68,375
$80,825
$60,863
$40,918
$53,861
$57,666
$69,485
$82,138
$61,851
FY20 Pay Distribution
Change
FY19-FY20
2.60%
Dol ars in figures are in thousands.
Source: Report of the Secretary of the Senate, as col ated by LegiStorm, various years, and CRS calculations. Percentage change in pay is based on the change in median pay (expressed in constant, February 2021 dol ars) for the periods noted. Detailed information about data sources is available above in “Data Tables and Visualizations.”
CRS-12
link to page 6
Table 9. Counsel
Nominal, Current $
Constant, 2021 $
50 %ile
50 %ile
Year Number Minimum
25 %ile
Median
75 %ile
Maximum Average Minimum
25 %ile
Median
75 %ile
Maximum Average
FY01
15
$25,000
$61,723
$69,875
$74,691
$93,833
$67,125
$37,128
$91,666
$103,772
$110,925
$139,353
$99,689
FY06
25
$42,458
$67,626
$78,454
$101,529
$144,792
$86,828
$55,393
$88,227
$102,354
$132,458
$188,901
$113,278
FY11
21
$45,000
$72,000
$81,663
$87,936
$138,000
$81,035
$52,617
$84,187
$95,486
$102,821
$161,359
$94,751
Most Recent Five Years
FY16
25
$52,500
$73,646
$87,500
$97,083
$134,932
$88,773
$57,533
$80,705
$95,888
$106,390
$147,867
$97,283
FY17
25
$66,500
$84,728
$88,535
$96,169
$142,271
$93,268
$71,354
$90,912
$94,997
$103,188
$152,655
$100,075
FY18
16
$55,000
$80,221
$95,172
$99,808
$114,392
$90,265
$57,608
$84,025
$99,685
$104,541
$119,816
$94,545
FY19
13
$73,750
$87,500
$97,583
$112,805
$145,500
$100,285
$75,872
$90,018
$100,391
$116,051
$149,687
$103,170
FY20
16
$67,125
$84,625
$95,003
$104,940
$135,800
$95,611
$68,215
$85,999
$96,546
$106,644
$138,005
$97,164
Median Pay
FY20 Pay Distribution
Change
FY19-FY20
-3.83%
FY16-FY20
0.69%
FY11-FY20
1.11%
FY06-FY20
-5.67%
FY01-FY20
-6.96%
Dol ars in figures are in thousands.
Source: Report of the Secretary of the Senate, as col ated by LegiStorm, various years, and CRS calculations. requesters upon request.
|
Nominal, Current $ |
Constant, 2019, $ |
||||||||||||||||
|
Year |
Number |
Minimum |
25 %ile |
50 %ile Median |
75 %ile |
Maximum |
Average |
Minimum |
25 %ile |
50 %ile Median |
75 %ile |
Maximum |
Average |
||||
|
FY01 |
19 |
$23,802 |
$26,801 |
$31,611 |
$37,367 |
$45,180 |
$31,778 |
$34,165 |
$38,468 |
$45,373 |
$53,635 |
$64,850 |
$45,613 |
||||
|
FY04 |
25 |
$23,410 |
$32,031 |
$37,863 |
$42,000 |
$58,719 |
$37,753 |
$31,503 |
$43,104 |
$50,951 |
$56,519 |
$79,018 |
$50,804 |
||||
|
FY09 |
25 |
$19,583 |
$31,125 |
$39,667 |
$44,000 |
$71,208 |
$40,223 |
$23,204 |
$36,880 |
$47,000 |
$52,135 |
$84,374 |
$47,659 |
||||
|
Most Recent Five Years |
|||||||||||||||||
|
FY14 |
25 |
$30,463 |
$37,175 |
$43,771 |
$48,000 |
$89,179 |
$45,446 |
$32,710 |
$39,918 |
$47,001 |
$51,541 |
$95,758 |
$48,799 |
||||
|
FY15 |
25 |
$31,500 |
$38,652 |
$44,125 |
$47,960 |
$83,084 |
$44,926 |
$33,784 |
$41,454 |
$47,324 |
$51,438 |
$89,108 |
$48,184 |
||||
|
FY16 |
25 |
$26,659 |
$38,806 |
$42,852 |
$46,500 |
$69,229 |
$43,881 |
$28,236 |
$41,101 |
$45,387 |
$49,250 |
$73,324 |
$46,476 |
||||
|
FY17 |
25 |
$30,900 |
$44,456 |
$50,833 |
$54,187 |
$83,325 |
$49,863 |
$32,044 |
$46,103 |
$52,716 |
$56,194 |
$86,411 |
$51,710 |
||||
|
FY18 |
25 |
$36,154 |
$41,310 |
$51,980 |
$56,500 |
$64,167 |
$49,749 |
$36,600 |
$41,819 |
$52,620 |
$57,196 |
$64,958 |
$50,362 |
||||
|
Median Pay |
FY18 Pay Distribution |
Change |
|||||||||||||||
|
| FY17-FY18 FY14-FY18 FY09-FY18 FY04-FY18 FY01-FY18 | -0.18% 11.96% 11.96% 3.28% 15.97% | ||||||||||||||
|
Dollars in figures are in thousands. |
|||||||||||||||||
Source: Report of the Secretary of the Senate, as collated by LegiStorm, various years, and CRS calculations. Percentage change in pay is based on the change in median pay (expressed in constant, March 2019 dollarsFebruary 2021 dol ars) for the periods noted. In the visualizations, position pay information based on constant 2019 dollars2021 dol ars in thousands of dollars, dol ars, or change in those levels, are presented in solid blue. Detailed information about data sources is available above in "“Data Tables and Visualizations.".” Data provided here are partial; complete data, FY2001-FY2018FY2020, are available to congressional requesters upon request.
|
Nominal, Current $ |
Constant, 2019, $ |
||||||||||||||||
|
Year |
Number |
Minimum |
25 %ile |
50 %ile Median |
75 %ile |
Maximum |
Average |
Minimum |
25 %ile |
50 %ile Median |
75 %ile |
Maximum |
Average |
||||
|
FY01 |
15 |
$25,000 |
$61,723 |
$69,875 |
$74,691 |
$93,833 |
$67,125 |
$35,884 |
$88,595 |
$100,296 |
$107,209 |
$134,684 |
$96,349 |
||||
|
FY04 |
25 |
$45,000 |
$66,952 |
$81,127 |
$91,992 |
$152,526 |
$84,890 |
$60,556 |
$90,097 |
$109,173 |
$123,793 |
$205,253 |
$114,236 |
||||
|
FY09 |
23 |
$45,000 |
$77,313 |
$89,000 |
$98,542 |
$129,788 |
$88,826 |
$53,320 |
$91,607 |
$105,455 |
$116,761 |
$153,784 |
$105,248 |
||||
|
Most Recent Five Years |
|||||||||||||||||
|
FY14 |
25 |
$53,250 |
$77,000 |
$85,100 |
$101,734 |
$153,120 |
$90,638 |
$57,179 |
$82,681 |
$91,378 |
$109,240 |
$164,417 |
$97,325 |
||||
|
FY15 |
25 |
$58,000 |
$79,417 |
$85,669 |
$113,333 |
$154,659 |
$93,777 |
$62,205 |
$85,175 |
$91,881 |
$121,551 |
$165,873 |
$100,576 |
||||
|
FY16 |
25 |
$52,500 |
$73,646 |
$87,500 |
$97,083 |
$134,932 |
$88,773 |
$55,605 |
$78,002 |
$92,675 |
$102,825 |
$142,913 |
$94,024 |
||||
|
FY17 |
25 |
$66,500 |
$84,728 |
$88,535 |
$96,169 |
$142,271 |
$93,268 |
$68,963 |
$87,866 |
$91,814 |
$99,731 |
$147,540 |
$96,722 |
||||
|
FY18 |
16 |
$55,000 |
$80,221 |
$95,172 |
$99,808 |
$114,392 |
$90,265 |
$55,678 |
$81,210 |
$96,345 |
$101,038 |
$115,802 |
$91,377 |
||||
|
Median Pay |
|
Change |
|||||||||||||||
|
| FY17-FY18 FY14-FY18 FY09-FY18 FY04-FY18 FY01-FY18 | 4.94% 5.44% -8.64% -11.75% -3.94% | ||||||||||||||
|
Dollars in figures are in thousands. |
|||||||||||||||||
Source: Report of the Secretary of the Senate, as collated by LegiStorm, various years, and CRS calculations. Percentage change in pay is based on the change in median pay (expressed in constant, March 2019 dollars) for the periods noted. In the visualizations, position pay information based on constant 2019 dollars in thousands of dollars, or change in those levels, are presented in solid blue. Detailed February 2021 dol ars) for the periods noted. Detailed information about data sources is available above in "“Data Tables and Visualizations.”
CRS-15
link to page 6
Table 12Data Tables and Visualizations." Data provided here are partial; complete data, FY2001-FY2018, are available to congressional requesters upon request.
|
Nominal, Current $ |
Constant, 2019, $ |
||||||||||||||||
|
Year |
Number |
Minimum |
25 %ile |
50 %ile Median |
75 %ile |
Maximum |
Average |
Minimum |
25 %ile |
50 %ile Median |
75 %ile |
Maximum |
Average |
||||
|
FY01 |
25 |
$36,000 |
$51,486 |
$60,480 |
$79,529 |
$124,583 |
$65,378 |
$51,673 |
$73,901 |
$86,810 |
$114,153 |
$178,822 |
$93,841 |
||||
|
FY04 |
25 |
$32,262 |
$60,167 |
$75,250 |
$89,299 |
$152,709 |
$76,616 |
$43,415 |
$80,967 |
$101,263 |
$120,170 |
$205,500 |
$103,102 |
||||
|
FY09 |
25 |
$42,272 |
$67,151 |
$86,817 |
$105,750 |
$167,305 |
$91,183 |
$50,087 |
$79,566 |
$102,868 |
$125,302 |
$198,237 |
$108,042 |
||||
| |||||||||||||||||
|
FY14 |
23 |
$32,750 |
$59,062 |
$79,110 |
$111,741 |
$169,459 |
$85,535 |
$35,166 |
$63,420 |
$84,947 |
$119,985 |
$181,961 |
$91,845 |
||||
|
FY15 |
21 |
$42,983 |
$55,375 |
$70,000 |
$107,544 |
$169,459 |
$84,837 |
$46,100 |
$59,390 |
$75,075 |
$115,342 |
$181,746 |
$90,988 |
||||
|
FY16 |
21 |
$33,752 |
$60,657 |
$80,559 |
$126,000 |
$169,459 |
$92,915 |
$35,749 |
$64,245 |
$85,323 |
$133,452 |
$179,481 |
$98,411 |
||||
|
FY17 |
19 |
$36,750 |
$48,099 |
$61,500 |
$100,426 |
$169,459 |
$79,059 |
$38,111 |
$49,881 |
$63,778 |
$104,146 |
$175,735 |
$81,987 |
||||
|
FY18 |
18 |
$38,250 |
$57,811 |
$67,946 |
$79,018 |
$169,459 |
$78,477 |
$38,721 |
$58,524 |
$68,783 |
$79,992 |
$171,548 |
$79,445 |
||||
|
Median Pay |
FY18 Pay Distribution |
Change |
|||||||||||||||
|
| FY17-FY18 FY14-FY18 FY09-FY18 FY04-FY18 FY01-FY18 | 7.85% -19.03% -33.13% -32.08% -20.77% | ||||||||||||||
|
Dollars in figures are in thousands. |
|||||||||||||||||
Source: Report of the Secretary of the Senate, as collated by LegiStorm, various years, and CRS calculations. Percentage change in pay is based on the change in median pay (expressed in constant, March 2019 dollarsFebruary 2021 dol ars) for the periods noted. In the visualizations, position pay information based on constant 2019 dollars2021 dol ars in thousands of dollars, dol ars, or change in those levels, are presented in solid blue. Detailed information about data sources is available above in "“Data Tables and Visualizations.".” Data provided here are partial; complete data, FY2001-FY2018FY2020, are available to congressional requesters upon request.
Table 11
CRS-16
link to page 6
Table 13. Field Representative
Nominal, Current $
Constant, 2021 $
50 %ile
50 %ile
Year Number Minimum
25 %ile
Median
75 %ile
Maximum Average Minimum
25 %ile
Median
75 %ile
Maximum Average
FY01
25
$20,519
$35,839
$41,337
$48,744
$70,466
$42,290
$30,473
$53,224
$61,390
$72,391
$104,650
$62,805
FY06
25
$29,199
$36,312
$43,875
$56,167
$73,075
$47,152
$38,095
$47,374
$57,241
$73,277
$95,336
$61,516
FY11
25
$32,250
$47,636
$54,504
$61,750
$74,927
$54,968
$37,709
$55,699
$63,730
$72,202
$87,610
$64,273
Most Recent Five Years
FY16
24
$33,476
$41,076
$47,833
$69,750
$98,125
$55,119
$36,685
$45,013
$52,419
$76,436
$107,531
$60,402
FY17
25
$37,691
$48,375
$56,863
$68,437
$87,500
$58,369
$40,442
$51,906
$61,013
$73,433
$93,886
$62,630
FY18
25
$38,083
$47,000
$56,000
$70,625
$93,042
$60,296
$39,889
$49,228
$58,655
$73,974
$97,453
$63,155
FY19
25
$23,967
$52,558
$62,750
$72,311
$100,417
$62,478
$24,657
$54,071
$64,556
$74,392
$103,306
$64,276
FY20
25
$20,939
$52,059
$57,000
$68,375
$101,358
$58,466
$21,279
$52,904
$57,926
$69,485
$103,004
$59,415
Median Pay
FY20 Pay Distribution
Change
FY19-FY20
-10.27%
FY16-FY20
10.51%
FY11-FY20
-9.11%
FY06-FY20
1.20%
FY01-FY20
-5.64%
Dol ars in figures are in thousands.
Source: Report of the Secretary of the Senate, as col ated by LegiStorm, various years, and CRS calculations. . Field Representative
|
Nominal, Current $ |
Constant, 2019, $ |
||||||||||||||||
|
Year |
Number |
Minimum |
25 %ile |
50 %ile Median |
75 %ile |
Maximum |
Average |
Minimum |
25 %ile |
50 %ile Median |
75 %ile |
Maximum |
Average |
||||
|
FY01 |
25 |
$20,519 |
$35,839 |
$41,337 |
$48,744 |
$70,466 |
$42,290 |
$29,452 |
$51,441 |
$59,333 |
$69,965 |
$101,144 |
$60,701 |
||||
|
FY04 |
25 |
$21,518 |
$33,793 |
$49,562 |
$54,449 |
$87,500 |
$46,831 |
$28,956 |
$45,474 |
$66,696 |
$73,272 |
$117,748 |
$63,021 |
||||
|
FY09 |
25 |
$29,495 |
$45,378 |
$53,500 |
$65,434 |
$91,750 |
$55,405 |
$34,949 |
$53,768 |
$63,391 |
$77,532 |
$108,713 |
$65,649 |
||||
|
Most Recent Five Years |
|||||||||||||||||
|
FY14 |
25 |
$34,833 |
$50,247 |
$56,458 |
$73,500 |
$93,948 |
$60,554 |
$37,403 |
$53,955 |
$60,624 |
$78,923 |
$100,880 |
$65,022 |
||||
|
FY15 |
25 |
$35,615 |
$44,500 |
$59,678 |
$73,000 |
$89,458 |
$58,997 |
$38,198 |
$47,726 |
$64,004 |
$78,293 |
$95,944 |
$63,275 |
||||
|
FY16 |
24 |
$33,476 |
$41,076 |
$47,833 |
$69,750 |
$98,125 |
$55,119 |
$35,456 |
$43,505 |
$50,662 |
$73,875 |
$103,929 |
$58,379 |
||||
|
FY17 |
25 |
$37,691 |
$48,375 |
$56,863 |
$68,437 |
$87,500 |
$58,369 |
$39,087 |
$50,167 |
$58,969 |
$70,972 |
$90,741 |
$60,531 |
||||
|
FY18 |
25 |
$38,083 |
$47,000 |
$56,000 |
$70,625 |
$93,042 |
$60,296 |
$38,553 |
$47,579 |
$56,690 |
$71,495 |
$94,188 |
$61,039 |
||||
|
Median Pay |
FY18 Pay Distribution |
Change |
|||||||||||||||
|
| FY17-FY18 FY14-FY18 FY09-FY18 FY04-FY18 FY01-FY18 | -3.86% -6.49% -10.57% -15.00% -4.45% | ||||||||||||||
|
Dollars in figures are in thousands. |
|||||||||||||||||
Source: Report of the Secretary of the Senate, as collated by LegiStorm, various years, and CRS calculations. Percentage change in pay is based on the change in median pay (expressed in constant, March 2019 dollarsFebruary 2021 dol ars) for the periods noted. In the visualizations, position pay information based on constant 2019 dollars2021 dol ars in thousands of dollars, dol ars, or change in those levels, are presented in solid blue. Detailed information about data sources is available above in "“Data Tables and Visualizations.".” Data provided here are partial; complete data, FY2001-FY2018FY2020, are available to congressional requesters upon request.
|
Nominal, Current $ |
Constant, 2019, $ |
||||||||||||||||
|
Year |
Number |
Minimum |
25 %ile |
50 %ile Median |
75 %ile |
Maximum |
Average |
Minimum |
25 %ile |
50 %ile Median |
75 %ile |
Maximum |
Average |
||||
|
FY01 |
25 |
$31,916 |
$46,440 |
$54,032 |
$65,250 |
$83,533 |
$55,641 |
$45,811 |
$66,658 |
$77,555 |
$93,657 |
$119,899 |
$79,865 |
||||
|
FY04 |
25 |
$30,203 |
$49,871 |
$58,500 |
$76,436 |
$135,000 |
$66,495 |
$40,644 |
$67,111 |
$78,723 |
$102,859 |
$181,669 |
$89,481 |
||||
|
FY09 |
25 |
$50,042 |
$57,228 |
$66,125 |
$77,500 |
$106,916 |
$69,293 |
$59,294 |
$67,809 |
$78,351 |
$91,829 |
$126,683 |
$82,104 |
||||
|
Most Recent Five Years |
|||||||||||||||||
|
FY14 |
25 |
$30,333 |
$61,667 |
$67,000 |
$73,331 |
$87,500 |
$66,806 |
$32,571 |
$66,216 |
$71,943 |
$78,741 |
$93,955 |
$71,735 |
||||
|
FY15 |
25 |
$58,755 |
$65,000 |
$67,667 |
$76,083 |
$103,375 |
$71,209 |
$63,015 |
$69,713 |
$72,573 |
$81,600 |
$110,870 |
$76,372 |
||||
|
FY16 |
25 |
$50,667 |
$60,000 |
$73,000 |
$79,619 |
$106,383 |
$71,792 |
$53,663 |
$63,548 |
$77,317 |
$84,328 |
$112,675 |
$76,038 |
||||
|
FY17 |
25 |
$44,420 |
$55,000 |
$68,667 |
$87,875 |
$120,901 |
$71,667 |
$46,066 |
$57,037 |
$71,210 |
$91,130 |
$125,379 |
$74,321 |
||||
|
FY18 |
25 |
$53,333 |
$65,500 |
$76,000 |
$84,254 |
$122,901 |
$76,770 |
$53,991 |
$66,307 |
$76,937 |
$85,292 |
$124,415 |
$77,716 |
||||
|
Median Pay |
FY18 Pay Distribution |
Change |
|||||||||||||||
|
| FY17-FY18 FY14-FY18 FY09-FY18 FY04-FY18 FY01-FY18 | 8.04% 6.94% -1.80% -2.27% -0.80% | ||||||||||||||
|
Dollars in figures are in thousands. |
|||||||||||||||||
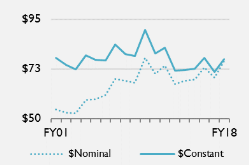
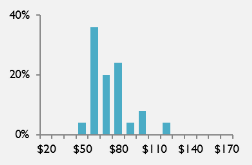
Source: Report of the Secretary of the Senate, as collated by LegiStorm, various years, and CRS calculations.
CRS-17
link to page 6
Table 14. Legislative Aide
Nominal, Current $
Constant, 2021 $
50 %ile
50 %ile
Year Number Minimum
25 %ile
Median
75 %ile
Maximum Average Minimum
25 %ile
Median
75 %ile
Maximum Average
FY19
25
$37,292
$47,089
$52,049
$59,936
$72,409
$53,781
$38,365
$48,444
$53,547
$61,661
$74,492
$55,329
FY20
25
$43,811
$50,961
$53,208
$55,601
$76,113
$54,659
$44,522
$51,788
$54,072
$56,504
$77,350
$55,546
FY20 Pay Distribution
Change
FY19-FY20
0.98%
Dol ars in figures are in thousands.
Source: Report of the Secretary of the Senate, as col ated by LegiStorm, various years, and CRS calculations. Percentage change in pay is based on the change in median pay (expressed in constant, February 2021 dol ars) for the periods noted. Detailed information about data sources is available above in “Data Tables and Visualizations.”
CRS-18
link to page 6
Table 15. Legislative Assistant
Nominal, Current $
Constant, 2021 $
50 %ile
50 %ile
Year Number Minimum
25 %ile
Median
75 %ile
Maximum Average Minimum
25 %ile
Median
75 %ile
Maximum Average
FY01
25
$31,916
$46,440
$54,032
$65,250
$83,533
$55,641
$47,399
$68,969
$80,243
$96,904
$124,056
$82,634
FY06
25
$35,376
$53,750
$60,625
$68,000
$129,356
$64,299
$46,152
$70,124
$79,093
$88,715
$168,763
$83,886
FY11
25
$46,042
$61,333
$70,396
$76,292
$112,078
$70,272
$53,835
$71,715
$82,312
$89,205
$131,049
$82,166
Most Recent Five Years
FY16
25
$50,667
$60,000
$73,000
$79,619
$106,383
$71,792
$55,523
$65,751
$79,998
$87,252
$116,581
$78,674
FY17
25
$44,420
$55,000
$68,667
$87,875
$120,901
$71,667
$47,663
$59,014
$73,678
$94,289
$129,725
$76,897
FY18
25
$53,333
$65,500
$76,000
$84,254
$122,901
$76,770
$55,862
$68,606
$79,604
$88,249
$128,728
$80,410
FY19
25
$56,752
$65,893
$76,125
$88,048
$112,655
$77,656
$58,385
$67,789
$78,316
$90,582
$115,897
$79,891
FY20
25
$56,250
$74,000
$77,970
$87,735
$104,001
$80,594
$57,163
$75,202
$79,236
$89,159
$105,690
$81,903
Median Pay
FY20 Pay Distribution
Change
FY19-FY20
1.17%
FY16-FY20
-0.95%
FY11-FY20
-3.74%
FY06-FY20
0.18%
FY01-FY20
-1.26%
Dol ars in figures are in thousands.
Source: Report of the Secretary of the Senate, as col ated by LegiStorm, various years, and CRS calculations. Percentage change in pay is based on the change in median pay (expressed in constant, March 2019 dollarsFebruary 2021 dol ars) for the periods noted. In the visualizations, position pay information based on constant 2019 dollars2021 dol ars in thousands of dollars, dol ars, or change in those levels, are presented in solid blue. Detailed information about data sources is available above in "“Data Tables and Visualizations.".” Data provided here are partial; complete data, FY2001-FY2018FY2020, are available to congressional requesters upon request.
Table 13
CRS-19
link to page 6
Table 16. Legislative Correspondent
Nominal, Current $
Constant, 2021 $
50 %ile
50 %ile
Year Number Minimum
25 %ile
Median
75 %ile
Maximum Average Minimum
25 %ile
Median
75 %ile
Maximum Average
FY01
25
$22,344
$27,496
$29,250
$32,500
$41,250
$30,560
$33,183
$40,835
$43,440
$48,266
$61,261
$45,385
FY06
25
$26,823
$30,500
$33,973
$38,360
$47,070
$34,706
$34,995
$39,791
$44,322
$50,046
$61,409
$45,279
FY11
25
$31,500
$34,251
$37,000
$39,063
$51,250
$37,460
$36,832
$40,049
$43,263
$45,675
$59,925
$43,801
Most Recent Five Years
FY16
25
$34,265
$37,348
$39,589
$43,650
$45,500
$39,947
$37,550
$40,928
$43,384
$47,834
$49,861
$43,776
FY17
25
$30,000
$39,000
$42,281
$45,156
$62,250
$42,879
$32,190
$41,846
$45,366
$48,452
$66,793
$46,009
FY18
25
$33,855
$38,400
$42,389
$45,687
$52,458
$42,409
$35,461
$40,221
$44,399
$47,853
$54,945
$44,420
FY19
25
$40,000
$43,605
$45,178
$48,679
$62,374
$46,650
$41,151
$44,859
$46,478
$50,080
$64,169
$47,992
FY20
25
$37,327
$44,333
$46,711
$51,374
$78,001
$49,221
$37,933
$45,053
$47,470
$52,208
$79,267
$50,020
Median Pay
FY20 Pay Distribution
Change
FY19-FY20
2.13%
FY16-FY20
9.42%
FY11-FY20
9.72%
FY06-FY20
7.10%
FY01-FY20
9.28%
Dol ars in figures are in thousands.
Source: Report of the Secretary of the Senate, as col ated by LegiStorm, various years, and CRS calculations. . Legislative Correspondent
|
Nominal, Current $ |
Constant, 2019, $ |
||||||||||||||||
|
Year |
Number |
Minimum |
25 %ile |
50 %ile Median |
75 %ile |
Maximum |
Average |
Minimum |
25 %ile |
50 %ile Median |
75 %ile |
Maximum |
Average |
||||
|
FY01 |
25 |
$22,344 |
$27,496 |
$29,250 |
$32,500 |
$41,250 |
$30,560 |
$32,071 |
$39,467 |
$41,984 |
$46,649 |
$59,208 |
$43,865 |
||||
|
FY04 |
25 |
$25,327 |
$29,779 |
$31,994 |
$35,320 |
$56,467 |
$34,350 |
$34,083 |
$40,074 |
$43,055 |
$47,530 |
$75,987 |
$46,224 |
||||
|
FY09 |
25 |
$30,156 |
$35,381 |
$36,786 |
$40,530 |
$49,750 |
$38,093 |
$35,731 |
$41,922 |
$43,587 |
$48,024 |
$58,948 |
$45,136 |
||||
|
Most Recent Five Years |
|||||||||||||||||
|
FY14 |
25 |
$32,388 |
$35,806 |
$40,722 |
$41,904 |
$58,333 |
$40,412 |
$34,778 |
$38,448 |
$43,726 |
$44,996 |
$62,637 |
$43,393 |
||||
|
FY15 |
25 |
$33,875 |
$36,875 |
$38,668 |
$42,000 |
$52,000 |
$39,794 |
$36,331 |
$39,549 |
$41,471 |
$45,045 |
$55,770 |
$42,679 |
||||
|
FY16 |
25 |
$34,265 |
$37,348 |
$39,589 |
$43,650 |
$45,500 |
$39,947 |
$36,292 |
$39,556 |
$41,930 |
$46,231 |
$48,191 |
$42,309 |
||||
|
FY17 |
25 |
$30,000 |
$39,000 |
$42,281 |
$45,156 |
$62,250 |
$42,879 |
$31,111 |
$40,444 |
$43,847 |
$46,829 |
$64,556 |
$44,468 |
||||
|
FY18 |
25 |
$33,855 |
$38,400 |
$42,389 |
$45,687 |
$52,458 |
$42,409 |
$34,273 |
$38,873 |
$42,911 |
$46,250 |
$53,104 |
$42,931 |
||||
|
Median Pay |
FY18 Pay Distribution |
Change |
|||||||||||||||
|
| FY17-FY18 FY14-FY18 FY09-FY18 FY04-FY18 FY01-FY18 | -2.13% -1.86% -1.55% -0.33% 2.21% | ||||||||||||||
|
Dollars in figures are in thousands. |
|||||||||||||||||
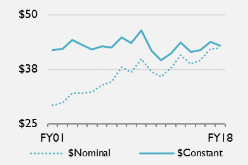
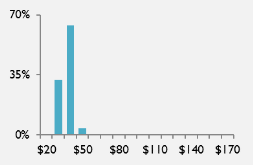
Source: Report of the Secretary of the Senate, as collated by LegiStorm, various years, and CRS calculations. Percentage change in pay is based on the change in median pay (expressed in constant, March 2019 dollarsFebruary 2021 dol ars) for the periods noted. In the visualizations, position pay information based on constant 2019 dollars2021 dol ars in thousands of dollars, dol ars, or change in those levels, are presented in solid blue. Detailed information about data sources is available above in "“Data Tables and Visualizations.".” Data provided here are partial; complete data, FY2001-FY2018FY2020, are available to congressional requesters upon request.
Table 14
CRS-20
link to page 6
Table 17. Legislative Director
Nominal, Current $
Constant, 2021 $
50 %ile
50 %ile
Year Number Minimum
25 %ile
Median
75 %ile
Maximum Average Minimum
25 %ile
Median
75 %ile
Maximum Average
FY01
25
$70,417
$90,429
$96,988
$106,671
$138,459
$97,697
$104,577
$134,298 $144,038
$158,418
$205,627
$145,092
FY06
25
$87,083
$102,358
$117,038
$132,000
$152,430
$118,402
$113,612
$133,539 $152,692
$172,211
$198,865
$154,472
FY11
25
$96,458
$119,167
$130,000
$136,088
$169,459
$129,435
$112,786
$139,338 $152,005
$159,123
$198,143
$151,344
Most Recent Five Years
FY16
25
$101,375
$125,380
$138,923
$151,167
$165,647
$138,102
$111,093
$137,399 $152,241
$165,657
$181,526
$151,341
FY17
25
$104,667
$125,000
$137,083
$146,007
$168,679
$136,547
$112,306
$134,123 $147,089
$156,664
$180,990
$146,513
FY18
25
$97,122
$130,001
$147,188
$150,588
$169,459
$141,493
$101,727
$136,165 $154,168
$157,729
$177,494
$148,202
FY19
25
$99,555
$119,583
$135,394
$147,500
$169,459
$135,919
$102,420
$123,024 $139,290
$151,744
$174,335
$139,831
FY20
25
$102,265
$128,458
$140,750
$158,725
$166,945
$141,886
$103,925
$130,544 $143,036
$161,303
$169,656
$144,190
Median Pay
FY20 Pay Distribution
Change
FY19-FY20
2.69%
FY16-FY20
-6.05%
FY11-FY20
-5.90%
FY06-FY20
-6.32%
FY01-FY20
-0.70%
Dol ars in figures are in thousands.
Source: Report of the Secretary of the Senate, as col ated by LegiStorm, various years, and CRS calculations. . Legislative Director
|
Nominal, Current $ |
Constant, 2019, $ |
||||||||||||||||
|
Year |
Number |
Minimum |
25 %ile |
50 %ile Median |
75 %ile |
Maximum |
Average |
Minimum |
25 %ile |
50 %ile Median |
75 %ile |
Maximum |
Average |
||||
|
FY01 |
25 |
$70,417 |
$90,429 |
$96,988 |
$106,671 |
$138,459 |
$97,697 |
$101,073 |
$129,798 |
$139,213 |
$153,111 |
$198,738 |
$140,231 |
||||
|
FY04 |
25 |
$67,401 |
$92,751 |
$105,695 |
$124,167 |
$140,245 |
$107,803 |
$90,702 |
$124,815 |
$142,233 |
$167,090 |
$188,727 |
$145,071 |
||||
|
FY09 |
25 |
$98,743 |
$122,544 |
$134,583 |
$150,654 |
$167,305 |
$135,702 |
$116,999 |
$145,201 |
$159,466 |
$178,508 |
$198,237 |
$160,791 |
||||
|
Most Recent Five Years |
|||||||||||||||||
|
FY14 |
25 |
$100,000 |
$118,750 |
$132,000 |
$139,569 |
$155,750 |
$128,618 |
$107,378 |
$127,511 |
$141,739 |
$149,866 |
$167,241 |
$138,107 |
||||
|
FY15 |
25 |
$106,583 |
$119,135 |
$137,000 |
$141,479 |
$162,625 |
$132,473 |
$114,311 |
$127,773 |
$146,933 |
$151,737 |
$174,416 |
$142,078 |
||||
|
FY16 |
25 |
$101,375 |
$125,380 |
$138,923 |
$151,167 |
$165,647 |
$138,102 |
$107,371 |
$132,795 |
$147,140 |
$160,107 |
$175,444 |
$146,270 |
||||
|
FY17 |
25 |
$104,667 |
$125,000 |
$137,083 |
$146,007 |
$168,679 |
$136,547 |
$108,543 |
$129,630 |
$142,161 |
$151,415 |
$174,926 |
$141,605 |
||||
|
FY18 |
25 |
$97,122 |
$130,001 |
$147,188 |
$150,588 |
$169,459 |
$141,493 |
$98,319 |
$131,603 |
$149,002 |
$152,444 |
$171,548 |
$143,237 |
||||
|
Median Pay |
FY18 Pay Distribution |
Change |
|||||||||||||||
|
| FY17-FY18 FY14-FY18 FY09-FY18 FY04-FY18 FY01-FY18 | 4.81% 5.12% -6.56% 4.76% 7.03% | ||||||||||||||
|
Dollars in figures are in thousands. |
|||||||||||||||||
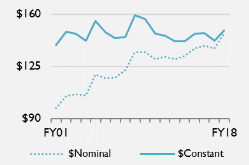
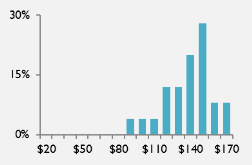
Source: Report of the Secretary of the Senate, as collated by LegiStorm, various years, and CRS calculations. Percentage change in pay is based on the change in median pay (expressed in constant, March 2019 dollarsFebruary 2021 dol ars) for the periods noted. In the visualizations, position pay information based on constant 2019 dollars2021 dol ars in thousands of dollars, dol ars, or change in those levels, are presented in solid blue. Detailed information about data sources is available above in "“Data Tables and Visualizations.".” Data provided here are partial; complete data, FY2001-FY2018FY2020, are available to congressional requesters upon request.
|
Nominal, Current $ |
Constant, 2019, $ |
||||||||||||||||
|
Year |
Number |
Minimum |
25 %ile |
50 %ile Median |
75 %ile |
Maximum |
Average |
Minimum |
25 %ile |
50 %ile Median |
75 %ile |
Maximum |
Average |
||||
|
FY01 |
25 |
$21,120 |
$48,125 |
$66,625 |
$77,143 |
$92,242 |
$64,528 |
$30,315 |
$69,077 |
$95,631 |
$110,728 |
$132,401 |
$92,621 |
||||
|
FY04 |
25 |
$41,098 |
$51,150 |
$62,523 |
$80,917 |
$109,734 |
$67,127 |
$55,305 |
$68,832 |
$84,137 |
$108,890 |
$147,668 |
$90,333 |
||||
|
FY09 |
25 |
$38,452 |
$59,500 |
$67,453 |
$82,852 |
$131,000 |
$71,592 |
$45,561 |
$70,501 |
$79,924 |
$98,171 |
$155,220 |
$84,829 |
||||
|
Most Recent Five Years |
|||||||||||||||||
|
FY14 |
25 |
$50,333 |
$56,916 |
$62,914 |
$78,182 |
$130,000 |
$71,385 |
$54,047 |
$61,115 |
$67,556 |
$83,951 |
$139,591 |
$76,652 |
||||
|
FY15 |
25 |
$53,610 |
$62,833 |
$71,650 |
$78,802 |
$127,813 |
$73,754 |
$57,497 |
$67,389 |
$76,845 |
$84,516 |
$137,080 |
$79,102 |
||||
|
FY16 |
25 |
$53,771 |
$65,937 |
$69,375 |
$76,856 |
$132,125 |
$75,205 |
$56,951 |
$69,837 |
$73,478 |
$81,401 |
$139,939 |
$79,653 |
||||
|
FY17 |
25 |
$52,389 |
$66,000 |
$75,737 |
$88,000 |
$132,192 |
$79,425 |
$54,329 |
$68,444 |
$78,543 |
$91,259 |
$137,088 |
$82,367 |
||||
|
FY18 |
25 |
$48,093 |
$61,197 |
$69,306 |
$87,000 |
$142,404 |
$74,966 |
$48,686 |
$61,951 |
$70,160 |
$88,072 |
$144,160 |
$75,890 |
||||
|
Median Pay |
FY18 Pay Distribution |
Change |
|||||||||||||||
|
| FY17-FY18 FY14-FY18 FY09-FY18 FY04-FY18 FY01-FY18 | -10.67% 3.85% -12.22% -16.61% -26.63% | ||||||||||||||
|
Dollars in figures are in thousands. |
|||||||||||||||||
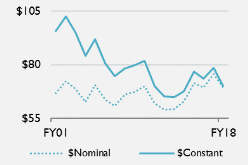
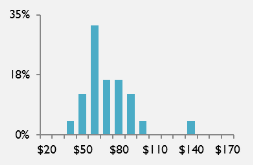
Source: Report of the Secretary of the Senate, as collated by LegiStorm, various years, and CRS calculations.
CRS-21
link to page 6
Table 18. Press Assistant
Nominal, Current $
Constant, 2021 $
50 %ile
50 %ile
Year Number Minimum
25 %ile
Median
75 %ile
Maximum Average Minimum
25 %ile
Median
75 %ile
Maximum Average
FY19
14
$34,000
$38,830
$43,010
$46,060
$49,408
$42,863
$34,978
$39,948
$44,248
$47,385
$50,830
$44,096
FY20
20
$39,167
$42,709
$45,028
$49,889
$54,224
$45,828
$39,803
$43,403
$45,759
$50,699
$55,104
$46,572
FY20 Pay Distribution
Change
FY19-FY20
3.42%
Dol ars in figures are in thousands.
Source: Report of the Secretary of the Senate, as col ated by LegiStorm, various years, and CRS calculations. Percentage change in pay is based on the change in median pay (expressed in constant, February 2021 dol ars) for the periods noted. Detailed information about data sources is available above in “Data Tables and Visualizations.”
CRS-22
link to page 6
Table 19. Press Secretary
Nominal, Current $
Constant, 2021 $
50 %ile
50 %ile
Year Number Minimum
25 %ile
Median
75 %ile
Maximum Average Minimum
25 %ile
Median
75 %ile
Maximum Average
FY01
25
$21,120
$48,125
$66,625
$77,143
$92,242
$64,528
$31,366
$71,471
$98,946
$114,567
$136,991
$95,832
FY06
25
$38,667
$55,040
$63,917
$69,385
$112,446
$65,042
$50,446
$71,807
$83,388
$90,521
$146,701
$84,857
FY11
24
$46,808
$54,250
$61,896
$76,507
$110,591
$65,442
$54,731
$63,433
$72,373
$89,457
$129,311
$76,519
Most Recent Five Years
FY16
25
$53,771
$65,937
$69,375
$76,856
$132,125
$75,205
$58,925
$72,258
$76,025
$84,223
$144,790
$82,414
FY17
25
$52,389
$66,000
$75,737
$88,000
$132,192
$79,425
$56,212
$70,817
$81,265
$94,423
$141,840
$85,222
FY18
25
$48,093
$61,197
$69,306
$87,000
$142,404
$74,966
$50,373
$64,099
$72,592
$91,125
$149,157
$78,521
FY19
25
$52,716
$73,539
$77,822
$90,211
$149,052
$82,275
$54,233
$75,655
$80,062
$92,807
$153,341
$84,643
FY20
25
$44,657
$67,740
$74,634
$84,000
$120,000
$75,842
$45,382
$68,840
$75,846
$85,364
$121,949
$77,073
Median Pay
FY20 Pay Distribution
Change
FY19-FY20
-5.27%
FY16-FY20
-0.24%
FY11-FY20
4.80%
FY06-FY20
-9.04%
FY01-FY20
-23.35%
Dol ars in figures are in thousands.
Source: Report of the Secretary of the Senate, as col ated by LegiStorm, various years, and CRS calculations. Percentage change in pay is based on the change in median pay (expressed in constant, March 2019 dollarsFebruary 2021 dol ars) for the periods noted. In the visualizations, position pay information based on constant 2019 dollars2021 dol ars in thousands of dollars, dol ars, or change in those levels, are presented in solid blue. Detailed information about data sources is available above in "“Data Tables and Visualizations.".” Data provided here are partial; complete data, FY2001-FY2018FY2020, are available to congressional requesters upon request.
|
Nominal, Current $ |
Constant, 2019, $ |
||||||||||||||||
|
Year |
Number |
Minimum |
25 %ile |
50 %ile Median |
75 %ile |
Maximum |
Average |
Minimum |
25 %ile |
50 %ile Median |
75 %ile |
Maximum |
Average |
||||
|
FY01 |
25 |
$29,690 |
$42,167 |
$50,917 |
$54,670 |
$75,308 |
$50,705 |
$42,616 |
$60,524 |
$73,084 |
$78,471 |
$108,094 |
$72,780 |
||||
|
FY04 |
25 |
$39,583 |
$48,250 |
$63,167 |
$77,292 |
$120,280 |
$64,745 |
$53,267 |
$64,930 |
$85,003 |
$104,011 |
$161,860 |
$87,128 |
||||
|
FY09 |
25 |
$28,468 |
$55,653 |
$78,250 |
$87,372 |
$162,986 |
$76,762 |
$33,731 |
$65,942 |
$92,717 |
$103,526 |
$193,119 |
$90,955 |
||||
|
Most Recent Five Years |
|||||||||||||||||
|
FY14 |
25 |
$35,262 |
$58,432 |
$75,546 |
$91,500 |
$131,812 |
$77,111 |
$37,864 |
$62,743 |
$81,120 |
$98,251 |
$141,537 |
$82,800 |
||||
|
FY15 |
25 |
$42,925 |
$52,596 |
$70,708 |
$90,000 |
$134,921 |
$76,226 |
$46,038 |
$56,410 |
$75,835 |
$96,525 |
$144,703 |
$81,753 |
||||
|
FY16 |
20 |
$39,716 |
$56,775 |
$69,017 |
$88,068 |
$137,897 |
$74,235 |
$42,065 |
$60,133 |
$73,099 |
$93,276 |
$146,053 |
$78,626 |
||||
|
FY17 |
15 |
$45,335 |
$71,778 |
$89,167 |
$98,415 |
$140,632 |
$87,838 |
$47,014 |
$74,437 |
$92,469 |
$102,060 |
$145,841 |
$91,092 |
||||
|
FY18 |
20 |
$45,268 |
$67,356 |
$81,076 |
$93,322 |
$151,993 |
$84,916 |
$45,826 |
$68,186 |
$82,075 |
$94,472 |
$153,867 |
$85,963 |
||||
|
Median Pay |
FY18 Pay Distribution |
Change |
|||||||||||||||
|
| FY17-FY18 FY14-FY18 FY09-FY18 FY04-FY18 FY01-FY18 | -11.24% 1.18% -11.48% -3.44% 12.30% | ||||||||||||||
|
Dollars in figures are in thousands. |
|||||||||||||||||
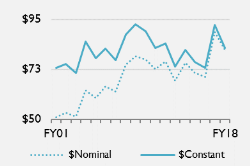
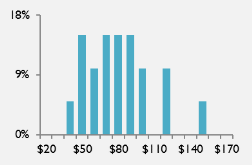
Source: Report of the Secretary of the Senate, as collated by LegiStorm, various years, and CRS calculations.
CRS-23
link to page 6
Table 20. Regional Director
Nominal, Current $
Constant, 2021 $
50 %ile
50 %ile
Year Number Minimum
25 %ile
Median
75 %ile
Maximum Average Minimum
25 %ile
Median
75 %ile
Maximum Average
FY19
25
$45,979
$63,000
$73,437
$79,638
$129,742
$74,207
$47,302
$64,813
$75,551
$81,930
$133,476
$76,342
FY20
25
$52,791
$64,158
$73,625
$81,952
$121,000
$75,459
$53,648
$65,200
$74,821
$83,283
$122,965
$76,684
FY20 Pay Distribution
Change
FY19-FY20
-0.97%
Dol ars in figures are in thousands.
Source: Report of the Secretary of the Senate, as col ated by LegiStorm, various years, and CRS calculations. Percentage change in pay is based on the change in median pay (expressed in constant, February 2021 dol ars) for the periods noted. Detailed information about data sources is available above in “Data Tables and Visualizations.”
CRS-24
link to page 6
Table 21. Regional Representative
Nominal, Current $
Constant, 2021 $
50 %ile
50 %ile
Year Number Minimum
25 %ile
Median
75 %ile
Maximum Average Minimum
25 %ile
Median
75 %ile
Maximum Average
FY19
11
$48,193
$50,583
$59,019
$62,198
$80,203
$59,296
$49,579
$52,039
$60,718
$63,988
$82,511
$61,002
FY20
11
$38,000
$47,143
$51,485
$75,312
$99,455
$60,762
$38,617
$47,908
$52,321
$76,535
$101,070
$61,749
FY20 Pay Distribution
Change
FY19-FY20
-13.83%
Dol ars in figures are in thousands.
Source: Report of the Secretary of the Senate, as col ated by LegiStorm, various years, and CRS calculations. Percentage change in pay is based on the change in median pay (expressed in constant, February 2021 dol ars) for the periods noted. Detailed information about data sources is available above in “Data Tables and Visualizations.”
CRS-25
link to page 6
Table 22. Scheduler
Nominal, Current $
Constant, 2021 $
50 %ile
50 %ile
Year Number Minimum
25 %ile
Median
75 %ile
Maximum Average Minimum
25 %ile
Median
75 %ile
Maximum Average
FY01
25
$29,690
$42,167
$50,917
$54,670
$75,308
$50,705
$44,094
$62,622
$75,617
$81,191
$111,841
$75,303
FY06
25
$44,026
$51,354
$64,825
$71,792
$102,673
$64,998
$57,438
$66,998
$84,573
$93,662
$133,950
$84,798
FY11
25
$38,000
$60,000
$72,500
$81,480
$159,333
$76,168
$44,432
$70,156
$84,772
$95,272
$186,303
$89,061
Most Recent Five Years
FY16
20
$39,716
$56,775
$69,017
$88,068
$137,897
$74,235
$43,524
$62,217
$75,633
$96,510
$151,116
$81,351
FY17
15
$45,335
$71,778
$89,167
$98,415
$140,632
$87,838
$48,644
$77,017
$95,675
$105,598
$150,896
$94,250
FY18
20
$45,268
$67,356
$81,076
$93,322
$151,993
$84,916
$47,414
$70,550
$84,920
$97,747
$159,200
$88,943
FY19
25
$36,750
$58,750
$73,977
$96,000
$129,333
$75,611
$37,807
$60,440
$76,105
$98,762
$133,055
$77,787
FY20
25
$46,478
$57,500
$67,875
$96,000
$162,000
$78,420
$47,233
$58,434
$68,977
$97,559
$164,631
$79,694
Median Pay
FY20 Pay Distribution
Change
FY19-FY20
-9.37%
FY16-FY20
-8.80%
FY11-FY20
-18.63%
FY06-FY20
-18.44%
FY01-FY20
-8.78%
Dol ars in figures are in thousands.
Source: Report of the Secretary of the Senate, as col ated by LegiStorm, various years, and CRS calculations. Percentage change in pay is based on the change in median pay (expressed in constant, March 2019 dollarsFebruary 2021 dol ars) for the periods noted. In the visualizations, position pay information based on constant 2019 dollars2021 dol ars in thousands of dollars, dol ars, or change in those levels, are presented in solid blue. Detailed information about data sources is available above in "“Data Tables and Visualizations.".” Data provided here are partial; complete data, FY2001-FY2018FY2020, are available to congressional requesters upon request.
|
Nominal, Current $ |
Constant, 2019, $ |
||||||||||||||||
|
Year |
Number |
Minimum |
25 %ile |
50 %ile Median |
75 %ile |
Maximum |
Average |
Minimum |
25 %ile |
50 %ile Median |
75 %ile |
Maximum |
Average |
||||
|
FY01 |
25 |
$22,000 |
$26,875 |
$28,985 |
$33,008 |
$51,275 |
$31,205 |
$31,578 |
$38,575 |
$41,604 |
$47,379 |
$73,598 |
$44,791 |
||||
|
FY04 |
25 |
$21,000 |
$28,792 |
$36,107 |
$44,142 |
$62,917 |
$36,668 |
$28,260 |
$38,745 |
$48,590 |
$59,402 |
$84,667 |
$49,344 |
||||
|
FY09 |
25 |
$18,683 |
$32,777 |
$35,216 |
$40,529 |
$56,500 |
$37,386 |
$22,137 |
$38,837 |
$41,727 |
$48,022 |
$66,946 |
$44,298 |
||||
|
Most Recent Five Years |
|||||||||||||||||
|
FY14 |
25 |
$28,114 |
$34,010 |
$36,551 |
$43,093 |
$75,000 |
$39,920 |
$30,188 |
$36,519 |
$39,247 |
$46,272 |
$80,533 |
$42,865 |
||||
|
FY15 |
25 |
$27,025 |
$32,375 |
$37,000 |
$40,917 |
$75,000 |
$38,956 |
$28,984 |
$34,722 |
$39,683 |
$43,883 |
$80,438 |
$41,780 |
||||
|
FY16 |
25 |
$24,401 |
$34,500 |
$36,500 |
$43,417 |
$64,083 |
$39,479 |
$25,844 |
$36,540 |
$38,659 |
$45,984 |
$67,873 |
$41,814 |
||||
|
FY17 |
25 |
$32,624 |
$34,937 |
$38,192 |
$39,578 |
$46,000 |
$37,750 |
$33,832 |
$36,231 |
$39,606 |
$41,044 |
$47,704 |
$39,148 |
||||
|
FY18 |
25 |
$30,000 |
$37,412 |
$40,953 |
$46,333 |
$87,950 |
$43,898 |
$30,370 |
$37,873 |
$41,458 |
$46,904 |
$89,034 |
$44,439 |
||||
|
Median Pay |
FY18 Pay Distribution |
Change |
|||||||||||||||
|
| FY17-FY18 FY14-FY18 FY09-FY18 FY04-FY18 FY01-FY18 | 4.68% 5.63% -0.64% -14.68% -0.35% | ||||||||||||||
|
Dollars in figures are in thousands. |
|||||||||||||||||
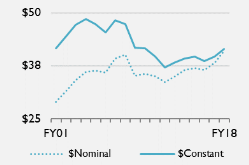
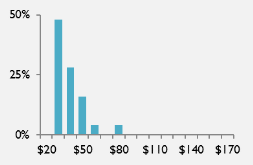
Source: Report of the Secretary of the Senate, as collated by LegiStorm, various years, and CRS calculations.
CRS-26
link to page 6
Table 23. Scheduling Director
Nominal, Current $
Constant, 2021 $
50 %ile
50 %ile
Year Number Minimum
25 %ile
Median
75 %ile
Maximum Average Minimum
25 %ile
Median
75 %ile
Maximum Average
FY19
25
$74,135
$79,231
$85,864
$102,211
$133,500
$92,633
$76,269
$81,511
$88,335
$105,152
$137,342
$95,298
FY20
22
$79,848
$87,888
$93,957
$104,813
$117,358
$95,894
$81,145
$89,315
$95,483
$106,515
$119,264
$97,452
Most Recent Five Years
FY20 Pay Distribution
Change
FY19-FY20
8.09%
Dol ars in figures are in thousands.
Source: Report of the Secretary of the Senate, as col ated by LegiStorm, various years, and CRS calculations. Percentage change in pay is based on the change in median pay (expressed in constant, February 2021 dol ars) for the periods noted. Detailed information about data sources is available above in “Data Tables and Visualizations.”
CRS-27
link to page 6
Table 24. Speechwriter
Nominal, Current $
Constant, 2021 $
50 %ile
50 %ile
Year Number Minimum
25 %ile
Median
75 %ile
Maximum Average Minimum
25 %ile
Median
75 %ile
Maximum Average
FY19
11
$74,135
$78,945
$85,328
$101,269
$133,500
$92,582
$76,269
$81,217
$87,784
$104,184
$137,342
$95,246
FY20
15
$40,000
$61,812
$68,822
$79,920
$123,068
$73,068
$40,649
$62,816
$69,939
$81,218
$125,066
$74,255
FY20 Pay Distribution
Change
FY19-FY20
-20.33%
Dol ars in figures are in thousands.
Source: Report of the Secretary of the Senate, as col ated by LegiStorm, various years, and CRS calculations. Percentage change in pay is based on the change in median pay (expressed in constant, February 2021 dol ars) for the periods noted. Detailed information about data sources is available above in “Data Tables and Visualizations.”
CRS-28
link to page 6
Table 25. Staff Assistant
Nominal, Current $
Constant, 2021 $
50 %ile
50 %ile
Year Number Minimum
25 %ile
Median
75 %ile
Maximum Average Minimum
25 %ile
Median
75 %ile
Maximum Average
FY01
25
$22,000
$26,875
$28,985
$33,008
$51,275
$31,205
$32,672
$39,912
$43,046
$49,021
$76,149
$46,344
FY06
25
$22,781
$29,220
$35,954
$44,558
$84,136
$39,231
$29,721
$38,121
$46,906
$58,131
$109,767
$51,183
FY11
25
$27,668
$31,509
$35,083
$41,000
$59,300
$37,963
$32,351
$36,842
$41,022
$47,940
$69,337
$44,389
Most Recent Five Years
FY16
25
$24,401
$34,500
$36,500
$43,417
$64,083
$39,479
$26,740
$37,807
$39,999
$47,579
$70,226
$43,264
FY17
25
$32,624
$34,937
$38,192
$39,578
$46,000
$37,750
$35,005
$37,487
$40,979
$42,466
$49,357
$40,505
FY18
25
$30,000
$37,412
$40,953
$46,333
$87,950
$43,898
$31,423
$39,186
$42,895
$48,530
$92,120
$45,980
FY19
25
$31,875
$39,677
$43,875
$48,198
$134,762
$48,522
$32,792
$40,818
$45,138
$49,585
$138,640
$49,918
FY20
25
$24,154
$39,375
$44,748
$46,956
$54,212
$42,814
$24,546
$40,014
$45,475
$47,718
$55,092
$43,509
Median Pay
FY20 Pay Distribution
Change
FY19-FY20
0.75%
FY16-FY20
13.69%
FY11-FY20
10.86%
FY06-FY20
-3.05%
FY01-FY20
5.64%
Dol ars in figures are in thousands.
Source: Report of the Secretary of the Senate, as col ated by LegiStorm, various years, and CRS calculations. Percentage change in pay is based on the change in median pay (expressed in constant, March 2019 dollarsFebruary 2021 dol ars) for the periods noted. In the visualizations, position pay information based on constant 2019 dollars2021 dol ars in thousands of dollars, dol ars, or change in those levels, are presented in solid blue. Detailed information about data sources is available above in "“Data Tables and Visualizations.".” Data provided here are partial; complete data, FY2001-FY2018FY2020, are available to congressional requesters upon request.
Table 18
CRS-29
link to page 6
Table 26. State Director
Nominal, Current $
Constant, 2021 $
50 %ile
50 %ile
Year Number Minimum
25 %ile
Median
75 %ile
Maximum Average Minimum
25 %ile
Median
75 %ile
Maximum Average
FY01
25
$56,000
$74,089
$79,521
$91,065
$122,533
$82,660
$83,166
$110,031 $118,098
$135,242
$181,976
$122,760
FY06
25
$54,398
$89,201
$101,328
$111,236
$159,755
$104,504
$70,969
$116,374 $132,196
$145,122
$208,421
$136,340
FY11
25
$81,500
$111,250
$123,557
$140,645
$169,459
$126,386
$95,295
$130,081 $144,472
$164,452
$198,143
$147,779
Most Recent Five Years
FY16
25
$77,042
$117,500
$132,563
$144,500
$169,459
$131,694
$84,427
$128,763 $145,271
$158,352
$185,703
$144,318
FY17
25
$105,208
$116,883
$136,750
$148,000
$169,459
$134,059
$112,887
$125,414 $146,731
$158,802
$181,827
$143,843
FY18
25
$60,750
$121,667
$139,250
$154,046
$169,459
$137,312
$63,630
$127,436 $145,853
$161,350
$177,494
$143,823
FY19
25
$99,675
$129,321
$140,299
$154,554
$169,459
$141,101
$102,543
$133,042 $144,336
$159,001
$174,335
$145,161
FY20
25
$102,525
$121,375
$131,987
$142,393
$172,790
$132,742
$104,190
$123,346 $134,131
$144,705
$175,596
$134,897
Median Pay
FY20 Pay Distribution
Change
FY19-FY20
-7.07%
FY16-FY20
-7.67%
FY11-FY20
-7.16%
FY06-FY20
1.46%
FY01-FY20
13.58%
Dol ars in figures are in thousands.
Source: Report of the Secretary of the Senate, as col ated by LegiStorm, various years, and CRS calculations. . State Director
|
Nominal, Current $ |
Constant, 2019, $ |
||||||||||||||||
|
Year |
Number |
Minimum |
25 %ile |
50 %ile Median |
75 %ile |
Maximum |
Average |
Minimum |
25 %ile |
50 %ile Median |
75 %ile |
Maximum |
Average |
||||
|
FY01 |
25 |
$56,000 |
$74,089 |
$79,521 |
$91,065 |
$122,533 |
$82,660 |
$80,380 |
$106,344 |
$114,141 |
$130,710 |
$175,879 |
$118,647 |
||||
|
FY04 |
25 |
$70,000 |
$83,598 |
$99,000 |
$105,396 |
$123,126 |
$96,097 |
$94,199 |
$112,498 |
$133,224 |
$141,832 |
$165,690 |
$129,318 |
||||
|
FY09 |
25 |
$81,132 |
$103,750 |
$113,975 |
$129,500 |
$167,305 |
$118,890 |
$96,132 |
$122,932 |
$135,047 |
$153,443 |
$198,237 |
$140,871 |
||||
|
Most Recent Five Years |
|||||||||||||||||
|
FY14 |
25 |
$78,833 |
$115,125 |
$127,467 |
$152,545 |
$169,459 |
$132,613 |
$84,649 |
$123,619 |
$136,871 |
$163,800 |
$181,961 |
$142,397 |
||||
|
FY15 |
25 |
$93,500 |
$111,817 |
$135,250 |
$157,094 |
$169,459 |
$134,582 |
$100,279 |
$119,924 |
$145,056 |
$168,484 |
$181,746 |
$144,340 |
||||
|
FY16 |
25 |
$77,042 |
$117,500 |
$132,563 |
$144,500 |
$169,459 |
$131,694 |
$81,598 |
$124,449 |
$140,403 |
$153,046 |
$179,481 |
$139,483 |
||||
|
FY17 |
25 |
$105,208 |
$116,883 |
$136,750 |
$148,000 |
$169,459 |
$134,059 |
$109,105 |
$121,212 |
$141,815 |
$153,482 |
$175,735 |
$139,024 |
||||
|
FY18 |
25 |
$60,750 |
$121,667 |
$139,250 |
$154,046 |
$169,459 |
$137,312 |
$61,499 |
$123,166 |
$140,966 |
$155,944 |
$171,548 |
$139,004 |
||||
|
Median Pay |
FY18 Pay Distribution |
Change |
|||||||||||||||
|
| FY17-FY18 FY14-FY18 FY09-FY18 FY04-FY18 FY01-FY18 | -0.60% 2.99% 4.38% 5.81% 23.50% | ||||||||||||||
|
Dollars in figures are in thousands. |
|||||||||||||||||
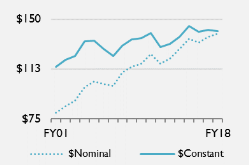
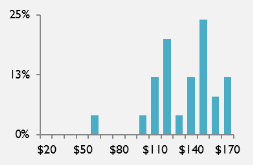
Source: Report of the Secretary of the Senate, as collated by LegiStorm, various years, and CRS calculations. Percentage change in pay is based on the change in median pay (expressed in constant, March 2019 dollarsFebruary 2021 dol ars) for the periods noted. In the visualizations, position pay information based on constant 2019 dollars2021 dol ars in thousands of dollars, dol ars, or change in those levels, are presented in solid blue. Detailed information about data sources is available above in "“Data Tables and Visualizations.".” Data provided here are partial; complete data, FY2001-FY2018FY2020, are available to congressional requesters upon request.
Author Contact Information
Acknowledgments
In addition to the listed authors, a number of CRS staff made substantial contributions to this report. Sandra L. EdwardsEdwards and Jonathan P. Kardashian, User Support Specialist, and Michael M. McCarthySpecialists, and Andrew M. Schaefer, Editor, provided formatting and editorial support. Amber Hope Wilhelm, Visual Information Specialist, created the visualizations. Raymond T Williams and Lara Chausow, former Research Assistant, was a coauthor of this reportAssistants, were coauthors of various previous versions of this report, and collected some of the data provided. Casey Burgat, former Research Assistant, provided update support. Michael M. McCarthy, Editor, Claudia Guidi, formerly a User Support Specialist, and Alex Marine, former Publications Editor, provided formatting and editorial support. Jacobo Licona, Brian Hamel, Joe Wisniewski, and Claire Laurence, former CRS interns, collected data for this report.
Disclaimer
This document was prepared by the Congressional Research Service (CRS). CRS serves as nonpartisan shared staff to congressional committees and Members of Congress. It operates solely at the behest of and under the direction of Congress. Information in a CRS Report should n ot be relied upon for purposes other than public understanding of information that has been provided by CRS to Members of Congress in
connection with CRS’s institutional role. CRS Reports, as a work of the United States Government, are not subject to copyright protection in the United States. Any CRS Report may be reproduced and distributed in its entirety without permission from CRS. However, as a CRS Report may include copyrighted images or material from a third party, you may need to obtain the permission of the copyright holder if you wish to copy or otherwise use copyrighted material.
Congressional Research Service
R44324 · VERSION 9 · UPDATED
31 data for this report.
Footnotes
| 1. |
|
| 2. |
For discussion of resources available to Members to carry out their official duties, see CRS Report RL30064, Congressional Salaries and Allowances: In Brief, by Ida A. Brudnick. |
| 3. |
U.S. Senate, Secretary of the Senate, 2006 U.S. Senate Employment, Compensation, Hiring and Benefits Study (Washington: 2006). |
| 4. |
In this report, pay refers to monies paid by the Senate to staff, and excludes other components of total compensation, which might include paid leave or employer contributions to various insurance and retirement benefits. |
| 5. |
The Report of the Secretary of the Senate since April 2011 is available at https://www.senate.gov/legislative/common/generic/report_secsen.htm. |
| 6. |
|
| 7. |
For a discussion of staff roles in Members' offices, see CRS Report RL34545, Congressional Staff: Duties and Functions of Selected Positions. |
| 8. |
Other job titles which may indicate similar duties, and for which pay data were collected for this category, include Casework Director, Casework Coordinator, and Director of Constituent Services. |
| 9. |
Other job titles which may indicate similar duties, and for which pay data were collected for this category, include Federal Caseworker and Constituent Caseworker. |
| 10. |
Another job title which may indicate similar duties, and for which pay data were collected for this category, was Regional Representative. |
| 11. |
Obtaining the salaries of every congressional staff member from every Senator's office listed in the Report of the Secretary of the Senate is beyond the capacity of available resources. Each year, a different, random sample of Senators' offices was taken for each position. The large random samples of positions in Senators' offices mean that a full accounting would be unlikely to yield significantly different results. At the same time, a study that examines pay data based on different job titles, or which combines pay data from positions of similar titles or duties (e.g., legislative assistant and senior legislative assistant, or executive assistants, schedulers, and executive assistant/schedulers), could result in findings that are different from those provided here. |
| 12. |
Other forms of payment do not appear to be recorded in a consistent manner. Sometimes overtime and other pay is listed as separate entries and in other instances, significant one-time changes in a quarterly total may suggest payments in addition to regular salary. |
| 13. |
For information on the number of first-term Members in each Congress, see CRS Report R41283, First-Term Members of the House of Representatives and Senate, 64th-114th Congresses, by Jennifer E. Manning and R. Eric Petersen. |
| 14. |
U.S. Senate, Committee on Rules and Administration, Senate Handbook (Washington: 1996), p. I-13. |
| 15. |
U.S. Department of Labor, Bureau of Labor Statistics, Consumer Price Index, at http://www.bls.gov/cpi/tables.htm. |
| 16. |
Member pay data are taken from CRS Report 97-1011, Salaries of Members of Congress: Recent Actions and Historical Tables, by Ida A. Brudnick. |
| 17. |
|