The Temporary Assistance for Needy Families (TANF) Block Grant: Responses to Frequently Asked Questions
Changes from April 12, 2019 to June 3, 2019
This page shows textual changes in the document between the two versions indicated in the dates above. Textual matter removed in the later version is indicated with red strikethrough and textual matter added in the later version is indicated with blue.
The Temporary Assistance for Needy Families (TANF) Block Grant: Responses to Frequently Asked Questions
Contents
- Introduction
- Funding and Expenditures
- What Is TANF's Funding Status?
- How Are State TANF Programs Funded?
- How Much Has the Value of the TANF Basic Block Grant Changed Over Time?
- How Have States Used TANF Funds?
- How Much of the TANF Grant Has Gone Unspent?
- The Caseload
- How Many Families Receive TANF- or MOE-Funded Benefits and Services?
- How Many Families and People Currently Receive TANF- or MOE-Funded "Assistance"?
- How Does the Current Assistance Caseload Level Compare with Historical Levels?
- What Are the Characteristics of Families Receiving TANF Assistance?
- TANF Cash Benefits: How Much Does a Family Receive in TANF Cash Per Month?
- TANF Work Participation Standards
- What Is the TANF Work Participation Standard States Must Meet?
- Have There Been Changes in the Work Participation Rules Enacted Since the 1996 Welfare Reform Law?
- What Work Participation Rates Have the States Achieved?
- How Many Jurisdictions Did Not Meet the All-Families Standard?
- Have States Met the Two-Parent Work Participation Standard?
Figures
- Figure 1. Uses of TANF Funds by Spending Category, FY2017
- Figure 2. Number of Families Receiving Cash Assistance, July 1959-September 2018
- Figure 3. Characteristics of Assistance Families, Selected Years FY1988 to FY2017
- Figure 4. TANF Cash Assistance Maximum Monthly Benefit Amounts for a Single Parent Family with Two Children, 50 States and the District of Columbia, July 2016
- Figure 5. National Average TANF Work Participation Rate for All Families, FY2002-FY2017
- Figure 6. States That Met or Did Not Meet the TANF All-Families Work Participation Standard: FY2006-FY2017
- Figure 7. Two-Parent TANF Work Participation Standard, Status by State: FY2006-FY2017
Tables
- Table 1. TANF Basic Block Grant Funding in Nominal and Constant Dollars
- Table 2. TANF Assistance Caseload: September 2018
- Table A-1. Trends in the Cash Assistance Caseload: 1961-2017
- Table A-2. Families Receiving AFDC/TANF Assistance by Family Category, Selected Years, FY1988-FY2017
- Table B-1. Use of FY2017 TANF and MOE Funds by Category
- Table B-2. Use of FY2017 TANF and MOE Funds by Category as a Percentage of Total Federal TANF and State MOE Funding
- Table B-3. Unspent TANF Funds at the End of FY2017
- Table B-4. Number of Families, Recipients, Children, and Adults Receiving TANF Assistance by State, September 2018
- Table B-5. Number of Needy Families with Children Receiving Assistance by State, September of Selected Years
- Table B-6. TANF Assistance Families by Number of Parents by State: September 2018
Summary
The Temporary Assistance for June 3, 2019 Needy Families (TANF) Block Grant: Gene Falk Responses to Frequently Asked Questions Specialist in Social Policy The Temporary Assistance for Needy Families (TANF) block grant funds a wide range of benefits and services for low-income families with children. TANF was created in the 1996 welfare reform law (P.L. 104-193). This report responds to some frequently asked questions about TANF; it does not describe TANF rules (see, instead, CRS Report RL32748, The Temporary Assistance for Needy Families (TANF) Block Grant: A Primer on TANF Financing and Federal Requirements, by Gene Falk).
TANF Funding and Expenditures. TANF provides fixed funding for the 50 states, the District of Columbia, the territories, and American Indian tribes. The basic block grant totals $16.5 billion per year. States are also required in total to contribute, from their own funds, at least $10.3 billion annually under a maintenance-of-effort (MOE) requirement.
Though TANF is best known for funding cash assistance payments for needy families with children, the block grant and MOE funds are used for a wide variety of benefits and activities. In FY2017, expenditures on basic assistance totaled $7.1 billion—23% of total federal TANF and MOE dollars. Basic assistance is often—but not exclusively—paid as cash. In addition to funding basic assistance, TANF also contributes funds for child care and services for children who have been, or are at risk of being, abused and neglected. Some states also count expenditures in prekindergarten programs toward the MOE requirement.
The TANF Assistance Caseload. A total of 1.2 million families, composed of 3.1 million recipients, received TANF- or MOE-funded assistance in September 2018. The bulk of the "recipients"“recipients” were children—2.3 million in that month. The assistance caseload is heterogeneous. The type of family once thought of as the "typical"“typical” assistance family—one with an unemployed adult recipient—accounted for 32% of all families on the rolls in FY2016. Additionally, 31% of cash assistance families had an employed adult, while 38% of all TANF families were "“child-only"” and had no adult recipient. Child-only families include those with disabled adults receiving Supplemental Security Income (SSI), adults who are nonparents (e.g., grandparents, aunts, uncles) caring for children, and families consisting of citizen children and ineligible noncitizen parents.
Cash Assistance Benefits. TANF cash benefit amounts are set by states. In July 2017, the maximum monthly benefit for a family of three ranged from $1,021 in New Hampshire to $170 in Mississippi. Only New Hampshire (at 60% of the federal poverty guidelines) had a maximum TANF cash assistance amount for this sized family in excess of 50% of poverty-level income.
Work Requirements. TANF'’s main federal work requirement is actually a performance measure that applies to the states. States determine the work rules that apply to individual recipients. TANF law requires states to engage 50% of all families and 90% of two-parent families with work-eligible individuals in work activities, though these standards can be reduced by "“credits."” Therefore, the effective standards states face are often less than the 50% or 90% targets, and vary by state. In FY2017, states achieved, on average, an all-family participation rate of 53.0% and a two-parent rate of 69.5%. In FY2017, two jurisdictions did not meet the all-family participation standard: Nevada and Guam. This is a reduction from FY2012, when 16 states did not meet that standard. In FY2017, nine jurisdictions did not meet the two-parent standard. States that do not meet work standards are at risk of being penalized by a reduction in their block grant.
Introduction
Congressional Research Service
link to page 5 link to page 5 link to page 5 link to page 5 link to page 5 link to page 6 link to page 7 link to page 8 link to page 8 link to page 8 link to page 8 link to page 9 link to page 10 link to page 11 link to page 13 link to page 13 link to page 13 link to page 13 link to page 14 link to page 15 link to page 17 link to page 7 link to page 9 link to page 11 link to page 12 link to page 12 link to page 15 link to page 15 link to page 16 link to page 16 link to page 18 link to page 18 link to page 6 link to page 8 link to page 19 The Temporary Assistance for Needy Families (TANF) Block Grant: FAQs
Contents
Introduction ..................................................................................................................................... 1 Funding and Expenditures ............................................................................................................... 1
What Is TANF’s Funding Status? ............................................................................................. 1 How Are State TANF Programs Funded? ................................................................................. 1 How Much Has the Value of the TANF Basic Block Grant Changed Over Time? ................... 1 How Have States Used TANF Funds? ...................................................................................... 2 How Much of the TANF Grant Has Gone Unspent? ................................................................ 3
The Caseload ................................................................................................................................... 4
How Many Families Receive TANF- or MOE-Funded Benefits and Services? ....................... 4 How Many Families and People Currently Receive TANF- or MOE-Funded
“Assistance”? ......................................................................................................................... 4
How Does the Current Assistance Caseload Level Compare with Historical Levels? ............. 5 What Are the Characteristics of Families Receiving TANF Assistance? .................................. 6
TANF Cash Benefits: How Much Does a Family Receive in TANF Cash Per Month? .................. 7 TANF Work Participation Standards ............................................................................................... 9
What Is the TANF Work Participation Standard States Must Meet? ........................................ 9 Have There Been Changes in the Work Participation Rules Enacted Since the 1996
Welfare Reform Law? ............................................................................................................ 9
What Work Participation Rates Have the States Achieved?.................................................... 10 How Many Jurisdictions Did Not Meet the All-Families Standard? ........................................ 11 Have States Met the Two-Parent Work Participation Standard? ............................................. 13
Figures Figure 1. Uses of TANF Funds by Spending Category, FY2017 .................................................... 3 Figure 2. Number of Families Receiving Cash Assistance, July 1959-September 2018................. 5 Figure 3. Characteristics of Assistance Families, Selected Years FY1988 to FY2017 ................... 7 Figure 4. TANF Cash Assistance Maximum Monthly Benefit Amounts for a Single Parent
Family with Two Children, 50 States and the District of Columbia, July 2016 ........................... 8
Figure 5. National Average TANF Work Participation Rate for All Families, FY2002-
FY2017 ........................................................................................................................................ 11
Figure 6. States That Met or Did Not Meet the TANF All-Families Work Participation
Standard: FY2006-FY2017 ........................................................................................................ 12
Figure 7. Two-Parent TANF Work Participation Standard, Status by State: FY2006-
FY2017 ....................................................................................................................................... 14
Tables Table 1. TANF Basic Block Grant Funding in Nominal and Constant Dollars ............................... 2 Table 2. TANF Assistance Caseload: September 2018 .................................................................... 4
Table A-1. Trends in the Cash Assistance Caseload: 1961-2017 ................................................... 15
Congressional Research Service
link to page 21 link to page 21 link to page 22 link to page 25 link to page 25 link to page 28 link to page 29 link to page 29 link to page 31 link to page 31 link to page 33 link to page 19 link to page 22 link to page 36 The Temporary Assistance for Needy Families (TANF) Block Grant: FAQs
Table A-2. Families Receiving AFDC/TANF Assistance by Family Category, Selected
Years, FY1988-FY2017 ............................................................................................................. 17
Table B-1. Use of FY2017 TANF and MOE Funds by Category .................................................. 18 Table B-2. Use of FY2017 TANF and MOE Funds by Category as a Percentage of Total
Federal TANF and State MOE Funding ..................................................................................... 21
Table B-3. Unspent TANF Funds at the End of FY2017 ............................................................... 24 Table B-4. Number of Families, Recipients, Children, and Adults Receiving TANF
Assistance by State, September 2018 ......................................................................................... 25
Table B-5. Number of Needy Families with Children Receiving Assistance by State,
September of Selected Years ...................................................................................................... 27
Table B-6. TANF Assistance Families by Number of Parents by State: September 2018 ............ 29
Appendixes Appendix A. Supplementary Tables .............................................................................................. 15 Appendix B. State Tables .............................................................................................................. 18
Contacts Author Information ........................................................................................................................ 32
Congressional Research Service
link to page 22 The Temporary Assistance for Needy Families (TANF) Block Grant: FAQs
Introduction This report provides responses to frequently asked questions about the Temporary Assistance for Needy Families (TANF) block grant. It is intended to serve as a quick reference to provide easy access to information and datadata. Appendix B presents a series of tables with state-level data. This report does not provide information on TANF program rules (for a discussion of TANF rules, see CRS Report RL32748, The Temporary Assistance for Needy Families (TANF) Block Grant: A Primer on TANF Financing and Federal Requirements, by Gene Falk).
Funding and Expenditures
What Is TANF'’s Funding Status?
On January 24, 2019, the President signed legislation (P.L. 116-4) that funds TANF and related programs through June 30, 2019. The legislationlaw permits states to receive their quarterly TANF grants for the 2ndsecond quarter (January through -March) and 3rdthird quarter (April through June) of FY2019. Additional legislation would be required to pay TANF grants in the final quarter (July through September) of FY2019.
-June) of FY2019. The majority leader has announced that the House is to consider legislation (H.R. 2940) during the week of June 3, 2019, that would extend TANF funding for the remainder of FY2019 through September 30, 2019. The legislation is expected to be considered under the expedited suspension of the rules procedure, which, among its principal features, requires a two-thirds vote of the House for passage.
How Are State TANF Programs Funded? How Are State TANF Programs Funded?
TANF programs are funded through a combination of federal and state funds. In FY2018, TANF has two federal grants to states. The bulk of the TANF funding is in a basic block grant to the states, totaling $16.5 billion for the 50 states, the District of Columbia, Puerto Rico, Guam, the Virgin Islands, and American Indian tribes. There is also a contingency fund available that provides extra federal funds to states that meet certain conditions.
Additionally, states are required to expend a minimum amount of their own funds for TANF and TANF-related activities under what is known as the maintenance of effort (MOE) requirement. States are required to spend at least 75% of what they spent in FY1994 on TANF'’s predecessor programs. The minimum MOE amount, in total, is $10.3 billion per year for the 50 states, the District of Columbia, and the territories.
How Much Has the Value of the TANF Basic Block Grant Changed Over Time?
TANF was created in the 1996 welfare reform law, the Personal Responsibility and Work Opportunity Reconciliation Act of 1996 (PRWORA, P.L. 104-193). A TANF basic block grant amount—both nationally and for each state—was established in the 1996 welfare reform law. The amount established in that law for the 50 states, District of Columbia, territories, and tribes was $16.6 billion in total. From FY1997 through FY2016, that amount remained the same. It was not adjusted for changes that occur over time, such as inflation, the size of the TANF assistance caseload, or changes in the poverty population. During this period, the real (inflation-adjusted) value of the block grant declined by one-third (33.1%). Beginning with FY2017, the state family assistance grant was reduced by 0.33% from its historical levels to finance TANF-related research and technical assistance. The reduced block grant amount is $16.5 billion.
Congressional Research Service 1 link to page 6 link to page 7 The Temporary Assistance for Needy Families (TANF) Block Grant: FAQs Table 1 shows the state family assistance grant, in both nominal (actual) and real (inflation-adjusted) dollars for each year, FY1997 through FY2018. In real (inflation-adjusted) terms, the FY2018 block grant was 36% below its value in FY1997.
Table 1. TANF Basic Block Grant Funding in Nominal and Constant Dollars
(In billions of $)
(In billions of $)
|
Fiscal Year |
|
State Family Assistance Grant Constant 1997 Dollars |
Cumulative Percentage Change |
|
1997 |
$16.567 |
$16.567 |
|
|
1998 |
16.567 |
16.306 |
-1.6% |
|
1999 |
16.567 |
15.991 |
-3.5 |
|
2000 |
16.567 |
15.498 |
-6.5 |
|
2001 |
16.567 |
15.020 |
-9.3 |
|
2002 |
16.567 |
14.792 |
-10.7 |
|
2003 |
16.567 |
14.456 |
-12.7 |
|
2004 |
16.567 |
14.124 |
-14.7 |
|
2005 |
16.567 |
13.680 |
-17.4 |
|
2006 |
16.567 |
13.190 |
-20.4 |
|
2007 |
16.567 |
12.893 |
-22.2 |
|
2008 |
16.567 |
12.345 |
-25.5 |
|
2009 |
16.567 |
12.382 |
-25.3 |
|
2010 |
16.567 |
12.182 |
-26.5 |
|
2011 |
16.567 |
11.859 |
-28.4 |
|
2012 |
16.567 |
11.585 |
-30.1 |
|
2013 |
16.567 |
11.394 |
-31.2 |
|
2014 |
16.567 |
11.217 |
-32.3 |
|
2015 |
16.567 |
11.179 |
-32.5 |
|
2016 |
16.567 |
11.082 |
-33.1 |
|
2017 |
16.512 |
10.820 |
-34.7 |
|
2018 |
16.512 |
10.564 |
-36.2 |
Source: Congressional Research Service (CRS) based on data from the U.S. Department of Health and Human Services (HHS), and the U.S. Department of Labor, Bureau of Labor Statistics (BLS).
Notes: Constant dollarsdol ars were computed using the Consumer Price Index for all Urban Consumers (CPI-U).
How Have States Used TANF Funds?
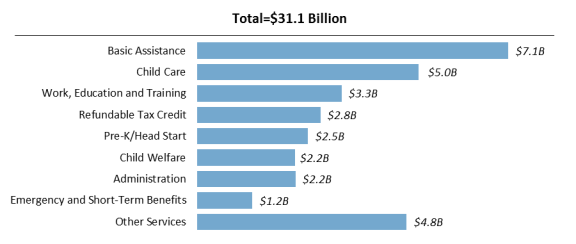
Figure 1 shows the uses of federal TANF grants to states and state MOE funds in FY2017. In FY2017, a total of $31.1 billion of both federal TANF and state MOE expenditures were either expended or transferred to other block grant programs. Basic assistance—ongoing benefits to
Congressional Research Service
2
link to page 22 link to page 25
The Temporary Assistance for Needy Families (TANF) Block Grant: FAQs
families to meet basic needs—represented 23% ($7.1 billion) of total FY2017 TANF and MOE dollars.
TANF is a major contributor of child care funding. In FY2017, $5 billion (16% of all TANF and MOE funds) were either expended on child care or transferred to the child care block grant (the Child Care and Development Fund, or CCDF). TANF work-related activities (including education and training) were the third-largest TANF and MOE spending category at $3.3 billion, or 11% of total TANF and MOE funds. TANF also helps low-wage parents by helping to finance state refundable tax credits, such as state add-ons to the Earned Income Tax Credit (EITC). TANF and MOE expenditures on refundable tax credits in FY2017 totaled $2.8 billion, or 9% of total TANF and MOE spending.
TANF is also a major contributor to the child welfare system, which provides foster care, adoption assistance, and services to families with children who either have experienced or are at risk of experiencing child abuse or neglect, spending about $2.2 billion on such activities. TANF and MOE funds also help fund state prekindergarten (pre-K) programs, with total FY2017 expenditures for that category also at $2.5 billion. TANF and MOE funds are also used for short-term and emergency benefits and a wide range of other social services.
For state-specific information on the use of TANF funds, see Table B-1 and Table B-2.
How Much of the TANF Grant Has Gone Unspent?
TANF law permits states to "reserve"“reserve” unused funds without time limit. This permits flexibility in timing of the use of TANF funds, including the ability to "save"“save” funds for unexpected occurrences that might increase costs (such as recessions or natural disasters).
At the end of FY2017 (September 30, 2017, the most recent data currently available), a total of $5.1 billion of federal TANF funding remained neither transferred nor spent. However, some of these unspent funds represent monies that states had already committed to spend later. At the end of FY2017, states had made such commitments to spend—that is, had obligated—a total of $1.8
Congressional Research Service
3
link to page 28 link to page 8 link to page 29 The Temporary Assistance for Needy Families (TANF) Block Grant: FAQs
billion. At the end of FY2017, states had $3.3 billion of "“unobligated balances."” These funds are available to states to make new spending commitmentscommitments. Table B-3 shows unspent TANF funds by state.
by state. The Caseload
How Many Families Receive TANF- or MOE-Funded Benefits and Services?
This number is not known. Federal TANF reporting requirements focus on families receiving only ongoing assistance. There is no complete reporting on families receiving other TANF benefits and services.
Assistance is defined as benefits provided to families to meet ongoing, basic needs.11 It is most often paid in cash. However, some states use TANF or MOE funds to provide an "“earnings supplement"supplement” to working parents added to monthly Supplemental Nutrition Assistance Program (SNAP) allotments. These "“earnings supplements"” are paid separately from the regular TANF cash assistance program. Additionally, TANF MOE dollars are used to fund food assistance for immigrants barred from regular SNAP benefits in certain states. These forms of nutrition aid meet an ongoing need, and thus are considered TANF assistance.
As discussed in a previous section of this report, TANF basic assistance accounts for about 24% of all TANF expenditures. Therefore, the federal reporting requirements that pertain to families receiving "assistance"“assistance” are likely to undercount the number of families receiving any TANF-funded benefit or service.
How Many Families and People Currently Receive TANF- or MOE-Funded “Assistance”? Funded "Assistance"?
Table 2 provides assistance caseload information. A total of 1.2 million families, composed of 3.1 million recipients, received TANF- or MOE-funded assistance in September 2018. The bulk of the “recipients”the "recipients" were children—2.3 million in that month. For state-by-state assistance caseloads, see Table B-4.
Table 2. TANF Assistance Caseload: September 2018
Families
1,175,335
Recipients
3,104,094
Child Recipients
2,280,173
Adult Recipients
823,921
Table 2. TANF Assistance Caseload: September 2018
|
Families |
1,175,335 |
|
Recipients |
3,104,094 |
|
Child Recipients |
2,280,173 |
|
Adult Recipients |
823,921 |
Source: Congressional Research Service (CRS) based on data from the U.S. Department of Health and Human Services (HHS).
Notes: TANF cash assistance caseload includes families receiving assistance in state-funded programs counted toward the TANF maintenance of effort (MOE) requirement.
1 The definition of TANF assistance is not in statute. However, because the statutory language has most TANF requirements triggered by a family receiving “assistance,” the Department of Health and Human Services (HHS) regulations define assistance at 45 C.F.R. §260.31. Congressional Research Service 4 link to page 9 The Temporary Assistance for Needy Families (TANF) Block Grant: FAQs How Does the Current Assistance Caseload Level Compare with Historical Levels?
Figure 2 provides a long-term historical perspective on the number of families receiving assistance from TANF or its predecessor program, from July 1959 to September 2017. The shaded areas of the figure represent months when the national economy was in recession. Though the health of the national economy has affected the trend in the cash assistance caseload, the long-term trend in receipt of cash assistance does not follow a classic countercyclical pattern. Such a pattern would have the caseload rise during economic slumps, and then fall again during periods of economic growth. Factors other than the health of the economy (demographic trends, policy changes) also have influenced the caseload trend.
The figure shows two periods of sustained caseload increases: the period from the mid-1960s to the mid-1970s and a second period from 1988 to 1994. The number of families receiving assistance peaked in March 1994 at 5.1 million families. The assistance caseload fell rapidly in the late 1990s (after the 1996 welfare reform law) before leveling off in 2001. In 2004, the caseload began another decline, albeit at a slower pace than in the late 1990s. During the recent 2007-2009 recession and its aftermath, the caseload began to rise from 1.7 million families in August 2008, peaking in December 2010 at close to 2.0 million families. By September 2018, the assistance caseload had declined to 1.2 million families.
Figure 2. Number of Families Receiving Cash Assistance, July 1959-September 2018 |
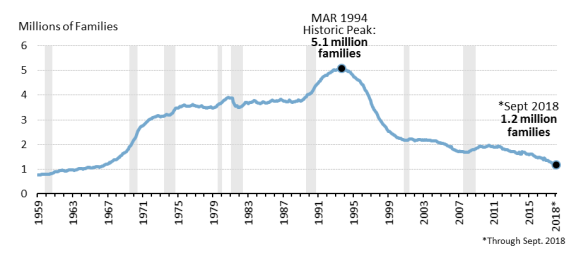 |
Click and type sub-title, or delete Source: Congressional Research Service (CRS) with data from the U.S. Department of Health and Human Services (HHS). Notes: Shaded areas denote months when the national economy was in recession. Information represents families receiving cash assistance from Aid to Dependent Children (ADC), Aid to Families with Dependent Children (AFDC), and TANF. For October 1999 through September 2018, includes families receiving assistance Congressional Research Service 5 link to page 19 link to page 31 link to page 11 The Temporary Assistance for Needy Families (TANF) Block Grant: FAQs from Separate State Programs (SSPs) with expenditures countable toward the TANF maintenance of effort requirement. See Table A-1 for average annual data on families, recipients, adult recipients, and child recipients of ADC, AFDC, and TANF cash assistance for 1961 to 2017. |
Table B-5 shows recent trends in the number of cash assistance families by state.
What Are the Characteristics of Families Receiving TANF Assistance?
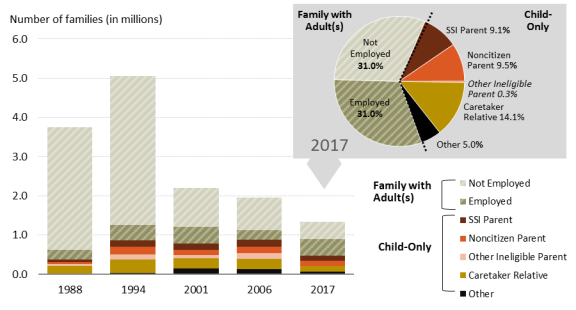
Before PRWORA, the "typical"“typical” family receiving assistance has been headed by a single parent (usually the mother) with one or two children. That single parent has also typically been unemployed. However, over the past 20 years the assistance caseload decline has occurred together with a major shift in the composition of the rollsrolls. Figure 3 shows the change in the size and composition of the assistance caseload under both AFDC (1988 and 1994) and TANF. In FY1988, an estimated 84% of AFDC families were headed by an unemployed adult recipient. In FY2016, families with an unemployed adult recipient represented 32% of all cash assistance families. This decline occurred, in large part, as the number of families headed by unemployed adult recipients declined more rapidly than other components of the assistance caseload. In FY1994, a monthly average of 3.8 million families per month who received AFDC cash assistance had adult recipients who were not working. In FY2016, a monthly average of 485,000 families per month had adult recipients or work-eligible individuals, with no adult recipient or work-eligible individual working.
With the decline in families headed by unemployed adults, the share of the caseload represented by families with employed adults and "“child only"” families has increased. In FY2017, families with all adult recipients unemployed and families with employed adult recipients each represented 31% of all assistance families. The latter category includes families in "“earnings supplement"supplement” programs separate from the regular TANF cash assistance program. "“Child-only" ” families are those where no adult recipient receives benefits in their own right; the family receives benefits on behalf of its children. The share of the caseload that was child-only in FY2017 was 38%. In FY2017, families with a nonrecipient, nonparent relative (grandparents, aunts, uncles) represented 14% of all assistance families. Families with ineligible, noncitizen adults or adults who have not reported their citizenship status made up 9% of the assistance caseload in that year. Families where the parent received Supplemental Security Income (SSI) and the children received TANF made up 9% of all assistance families in FY2017.
TANF Cash Benefits: How Much Does a Family Receive in TANF Cash Per Month?
There are no federal rules that help determine the amount of TANF cash benefits paid to a family. (There are also no federal rules that require states to use TANF to pay cash benefits, though all states do so.) Benefit amounts are determined solely by the states.
Most states base TANF cash benefit amounts on family size, paying larger cash benefits to larger families on the presumption that they have greater financial needs. The maximum monthly cash benefit is usually paid to a family that receives no other income (e.g., no earned or unearned income) and complies with program rules. Families with income other than TANF often are paid a reduced benefit. Moreover, some families are financially sanctioned for not meeting a program requirement (e.g., a work requirement), and are also paid a lower benefit.
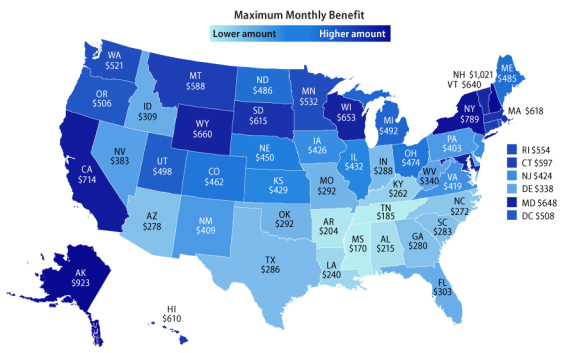
Figure 4 shows the maximum monthly TANF cash benefit by state for a single mother caring for two children (family of three) in July 2016.22 The benefit amounts shown are those for a single-parent family with two children.33 For a family of three, the maximum TANF benefit paid in July 2017 varied from $170 per month in Mississippi to $1,201 per month in New Hampshire. The 2 States are not required to report to the federal government their cash assistance benefit amounts in either the TANF state plan (under Section 402 of the Social Security Act) or in annual program reports (under Section 411 of the Social Security Act). The benefit amounts shown are from the “Welfare Rules Database,” maintained by the Urban Institute and funded by the Department of Health and Human Services (HHS).
3 Some states vary their benefit amounts for other family types such as two-parent families or “child-only” cases. States also vary their benefits by other factors such as housing costs and substate geography.
Congressional Research Service
7
The Temporary Assistance for Needy Families (TANF) Block Grant: FAQs
map shows a regional pattern to the maximum monthly benefit paid, with lower benefit amounts in the South than in other regions. Only New Hampshire (at 60% of the federal poverty guidelines) had a maximum TANF cash assistance amount for this sized family in excess of 50% of poverty-level income.4
TANF Work Participation Standards
TANF'’s main federal work requirement is actually a performance measure that applies to the states, rather than individual recipients. States determine the work rules that apply to individual recipients.
What Is the TANF Work Participation Standard States Must Meet?
The TANF statute requires states to have 50% of their caseload meet standards of participation in work or activities—that is, a family member must be in specified activities for a minimum number of hours.55 There is a separate participation standard that applies to the two-parent portion of a state'’s caseload, requiring 90% of the state'’s two-parent caseload to meet participation standards.
However, the statutory work participation standards are reduced by a "“caseload reduction credit." ” The caseload reduction credit reduces the participation standard one percentage point for each percentage point decline in a state'’s caseload. Additionally, under a regulatory provision, a state may get "extra"“extra” credit for caseload reduction if it spends more than required under the TANF MOE. Therefore, the effective standards states face are often less than the 50% and 90% targets, and vary by state and by year.
States that do not meet the TANF work participation standard are at risk of being penalized through a reduction in their block grant. However, penalties can be forgiven if a state claims, and the Secretary of HHS finds, that it had "“reasonable cause"” for not meeting the standard. Penalties can also be forgiven for states that enter into "“corrective compliance plans,"” and subsequently meet the work standard.
Have There Been Changes in the Work Participation Rules Enacted Since the 1996 Welfare Reform Law?
The 50% and 90% target standards that states face, as well as the caseload reduction credit, date back to the 1996 welfare reform law. However, the Deficit Reduction Act of 2005 (DRA, P.L. 109-171) made several changes to the work participation rules effective in FY2007
-
The caseload reduction credit was changed to measure caseload reduction from
FY2005, rather than the original law
'’s FY1995. -
The work participation standards were broadened to include families receiving
cash aid in
"“separate state programs."” Separate state programs are programs run with state funds, distinct from a state's "’s “TANF program,"” but with expenditures countable toward the TANF MOE. -
HHS was instructed to provide definition to the allowable TANF work activities
listed in law. HHS was also required to define what is meant by a
"“work-eligible"” individual, expanding the number of families that are included in the work participation calculation. - States were required to develop plans and procedures to verify work activities.
5 Families without a work-eligible individual are excluded from the participation rate calculation. It excludes families where the parent is a nonrecipient (for example, disabled receiving Supplemental Security Income or an ineligible noncitizen) or the children in the family are being cared for by a nonparent relative (e.g., grandparent, aunt, uncle) who does not receive assistance on his or her behalf.
Congressional Research Service
9
link to page 15 The Temporary Assistance for Needy Families (TANF) Block Grant: FAQs
The American Recovery and Reinvestment Act of 2009 (ARRA, P.L. 111-5), a law enacted in response to the sharp economic downturn of 2007-2009, held states "harmless"“harmless” for caseload increases affecting the work participation standards for FY2009 through FY2011. It did so by allowing states to "freeze"“freeze” caseload reduction credits at pre-recession levels through the FY2011 standards.
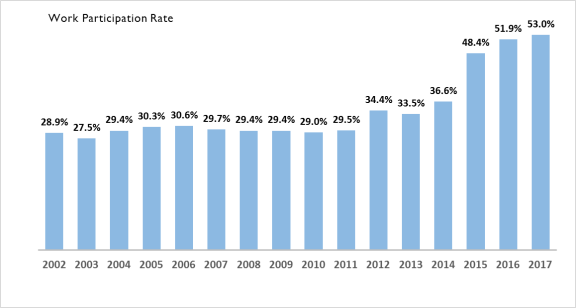
What Work Participation Rates Have the States Achieved?
HHS computes two work participation rates for each state that are then compared with the effective (after-credit) standard to determine if it has met the TANF work standard. An "all-families"“all-families” work participation rate is computed and compared with the all-families effective standard (50% minus the state'’s caseload reduction credit). HHS also computes a two-parent work participation rate that is compared with the two-parent effective standard (90% minus the state'state’s caseload reduction credit).
Figure 5 shows the national average all-families work participation rate for FY2002 through FY2017. For the period FY2002 through FY2011, states achieved an average all-families work participation rate hovering around 30%. The work participation rate increased since then. In FY2016, it exceeded 50% for the first time since TANF was established. However, it is important to note that the increase in the work participation rate has not come from an increase in the number of recipients in regular TANF assistance programs who are either working or in job preparation activities. This increase stems mostly from states creating new "“earnings supplement" ” programs that use TANF funds to aid working parents in the Supplemental Nutrition Assistance Program (SNAP, formerly food stamps) or who have left the regular TANF assistance programs for work.6
6 See CRS In Focus IF10856, Temporary Assistance for Needy Families: Work Requirements.
Congressional Research Service
10
link to page 16
The Temporary Assistance for Needy Families (TANF) Block Grant: FAQs
for work.6
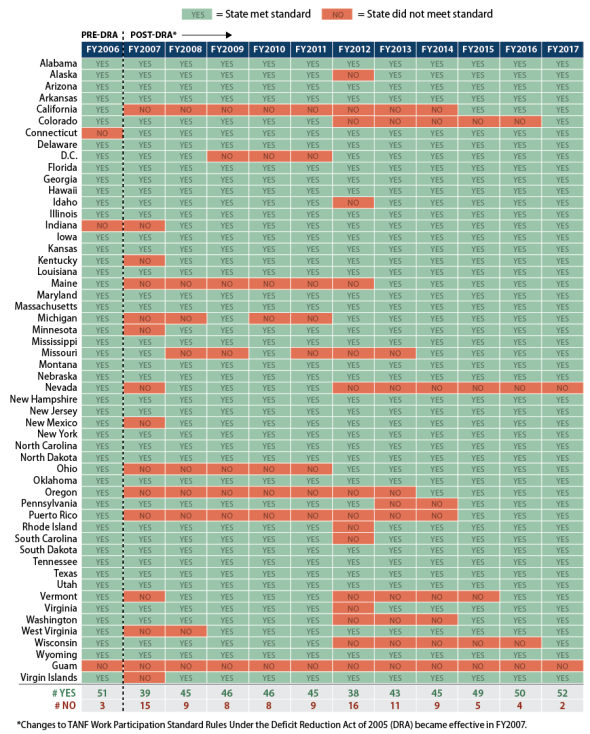
How Many Jurisdictions Did Not Meet the All-Families Standard?
Figure 6 shows which states did not meet the TANF all-families work participation standards from FY2006 through FY2017. Before FY2007, the first year that DRA was effective, only a few jurisdictions did not meet TANF all-families work participation standards. However, in FY2007, 15 jurisdictions did not meet the all-families standard. This number declined to 9 in FY2008 and 8 in FY2009.
In FY2012, despite the uptick in the national average work participation rate, 16 states did not meet the all-family standard, the largest number of states that did not meet their participation standards in any one year since the enactment of TANF. FY2012 was the year that ARRA's "freeze"’s “freeze” of the caseload reduction credit expired, and states were generally required to meet higher standards than in previous years.
The number of jurisdictions that did not meet the all-families standard declined over the FY2012 to FY2017 period. In FY2017, two jurisdictions did not meet the all-family participation standard: Nevada and Guam.
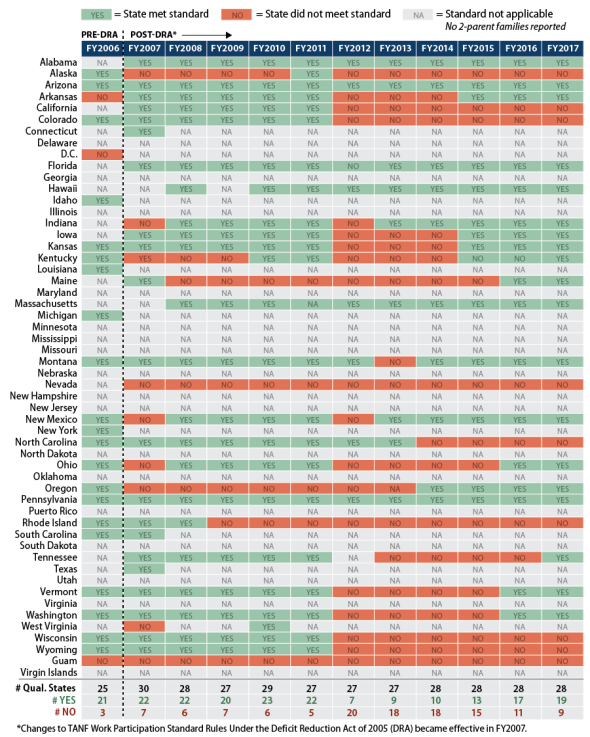
Congressional Research Service 12 link to page 18 The Temporary Assistance for Needy Families (TANF) Block Grant: FAQs Have States Met the Two-Parent Work Participation Standard?
In addition to meeting a work standard for all families, TANF also imposes a second standard—90%—for the two-parent portion of its cash assistance caseload. This standard can also be lowered by caseload reduction.
Figure 7 shows whether each state met its two-parent work participation standard for FY2006 through FY2017. However, the display on the table is more complex than that for reporting whether a state met or did not meet its "“all family"” rate.
A substantial number of states have reported no two-parent families subject to the work participation standard. These states are denoted on the table with an "“NA,"” indicating that the two-parent standard was not applicable to the state in that year. Before the changes made by the DRA were effective, a number of states had their two-parent families in separate state programs that were not included in the work participation calculation. When DRA brought families receiving assistance in separate state programs into the work participation rate calculations, a number of states moved these families into solely state-funded programs. These are state-funded programs with expenditures not countable toward the TANF maintenance of effort requirement, and hence are outside of TANF'’s rules.
For states with two-parent families in their caseloads, the table reports "Yes"“Yes” for states that met the two-parent standard, and "No"“No” for states that did not meet the two-parent standard. Of the 28 jurisdictions that had two-parent families in their FY2017 TANF work participation calculation, 19 met the standard and 9 did not.
Appendix A.
Supplementary Tables
Supplementary Tables
Table A-1. Trends in the Cash Assistance Caseload: 1961-2017
TANF Child Recipients
As a
As a
Percentage Percentage
Families
Recipients
Adults
Children
of All
of All Poor
Year
(millions)
(millions)
(millions)
(millions)
Children
Children
1961
0.873
3.363
0.765
2.598
3.7%
14.3%
1962
0.939
3.704
0.860
2.844
4.0
15.7
1963
0.963
3.945
0.988
2.957
4.1
17.4
1964
1.010
4.195
1.050
3.145
4.3
18.6
1965
1.060
4.422
1.101
3.321
4.5
21.5
1966
1.096
4.546
1.112
3.434
4.7
26.5
1967
1.220
5.014
1.243
3.771
5.2
31.2
1968
1.410
5.702
1.429
4.274
5.9
37.8
1969
1.696
6.689
1.716
4.973
6.9
49.7
1970
2.207
8.462
2.250
6.212
8.6
57.7
1971
2.763
10.242
2.808
7.435
10.4
68.5
1972
3.048
10.944
3.039
7.905
11.1
74.9
1973
3.148
10.949
3.046
7.903
11.2
79.9
1974
3.219
10.847
3.041
7.805
11.2
75.0
1975
3.481
11.319
3.248
8.071
11.8
71.2
1976
3.565
11.284
3.302
7.982
11.8
76.2
1977
3.568
11.015
3.273
7.743
11.6
73.9
1978
3.517
10.551
3.188
7.363
11.2
72.8
1979
3.509
10.312
3.130
7.181
11.0
68.0
1980
3.712
10.774
3.355
7.419
11.5
63.2
1981
3.835
11.079
3.552
7.527
11.7
59.2
1982
3.542
10.358
3.455
6.903
10.8
49.6
1983
3.686
10.761
3.663
7.098
11.1
50.1
1984
3.714
10.831
3.687
7.144
11.2
52.3
1985
3.701
10.855
3.658
7.198
11.3
54.4
1986
3.763
11.038
3.704
7.334
11.5
56.0
1987
3.776
11.027
3.661
7.366
11.5
56.4
1988
3.749
10.915
3.586
7.329
11.4
57.8
1989
3.798
10.992
3.573
7.419
11.5
57.9
1990
4.057
11.695
3.784
7.911
12.1
57.9
1991
4.497
12.930
4.216
8.715
13.2
59.8
Congressional Research Service
15
The Temporary Assistance for Needy Families (TANF) Block Grant: FAQs
TANF Child Recipients
As a
As a
Percentage Percentage
Families
Recipients
Adults
Children
of All
of All Poor
Year
(millions)
(millions)
(millions)
(millions)
Children
Children
1992
4.829
13.773
4.470
9.303
13.9
59.9
1993
5.012
14.205
4.631
9.574
14.1
60.0
1994
5.033
14.161
4.593
9.568
13.9
61.7
1995
4.791
13.418
4.284
9.135
13.1
61.5
1996
4.434
12.321
3.928
8.600
12.3
58.7
1997
3.740
10.376
NA
NA
10.0
50.1
1998
3.050
8.347
NA
NA
8.1
42.9
1999
2.578
6.924
NA
NA
6.7
39.4
2000
2.303
6.143
1.655
4.479
6.1
38.1
2001
2.192
5.717
1.514
4.195
5.7
35.3
2002
2.187
5.609
1.479
4.119
5.6
33.6
2003
2.180
5.490
1.416
4.063
5.5
31.3
2004
2.153
5.342
1.362
3.969
5.4
30.2
2005
2.061
5.028
1.261
3.756
5.1
28.9
2006
1.906
4.582
1.120
3.453
4.6
26.7
2007
1.730
4.075
0.956
3.119
4.2
23.2
2008
1.701
4.005
0.946
3.059
4.1
21.6
2009
1.838
4.371
1.074
3.296
4.4
21.2
2010
1.919
4.598
1.163
3.435
4.6
20.9
2011
1.907
4.557
1.149
3.408
4.6
20.9
2012
1.852
4.402
1.104
3.298
4.4
20.3
2013
1.726
4.042
0.993
3.050
4.1
19.1
2014
1.650
3.957
1.007
2.950
4.0
18.9
2015
1.609
4.126
1.155
2.971
4.0
20.4
2016
1.479
3.780
1.037
2.743
3.7
20.7
2017
1.358
3.516
0,930
2.577
3.5
20.1
Table A-1. Trends in the Cash Assistance Caseload: 1961-2017
|
TANF Child Recipients |
||||||||
|
Year |
Families (millions) |
Recipients (millions) |
Adults (millions) |
Children (millions) |
As a Percentage of All Children |
As a Percentage of All Poor Children |
||
|
1961 |
0.873 |
3.363 |
0.765 |
2.598 |
3.7% |
14.3% |
||
|
1962 |
0.939 |
3.704 |
0.860 |
2.844 |
4.0 |
15.7 |
||
|
1963 |
0.963 |
3.945 |
0.988 |
2.957 |
4.1 |
17.4 |
||
|
1964 |
1.010 |
4.195 |
1.050 |
3.145 |
4.3 |
18.6 |
||
|
1965 |
1.060 |
4.422 |
1.101 |
3.321 |
4.5 |
21.5 |
||
|
1966 |
1.096 |
4.546 |
1.112 |
3.434 |
4.7 |
26.5 |
||
|
1967 |
1.220 |
5.014 |
1.243 |
3.771 |
5.2 |
31.2 |
||
|
1968 |
1.410 |
5.702 |
1.429 |
4.274 |
5.9 |
37.8 |
||
|
1969 |
1.696 |
6.689 |
1.716 |
4.973 |
6.9 |
49.7 |
||
|
1970 |
2.207 |
8.462 |
2.250 |
6.212 |
8.6 |
57.7 |
||
|
1971 |
2.763 |
10.242 |
2.808 |
7.435 |
10.4 |
68.5 |
||
|
1972 |
3.048 |
10.944 |
3.039 |
7.905 |
11.1 |
74.9 |
||
|
1973 |
3.148 |
10.949 |
3.046 |
7.903 |
11.2 |
79.9 |
||
|
1974 |
3.219 |
10.847 |
3.041 |
7.805 |
11.2 |
75.0 |
||
|
1975 |
3.481 |
11.319 |
3.248 |
8.071 |
11.8 |
71.2 |
||
|
1976 |
3.565 |
11.284 |
3.302 |
7.982 |
11.8 |
76.2 |
||
|
1977 |
3.568 |
11.015 |
3.273 |
7.743 |
11.6 |
73.9 |
||
|
1978 |
3.517 |
10.551 |
3.188 |
7.363 |
11.2 |
72.8 |
||
|
1979 |
3.509 |
10.312 |
3.130 |
7.181 |
11.0 |
68.0 |
||
|
1980 |
3.712 |
10.774 |
3.355 |
7.419 |
11.5 |
63.2 |
||
|
1981 |
3.835 |
11.079 |
3.552 |
7.527 |
11.7 |
59.2 |
||
|
1982 |
3.542 |
10.358 |
3.455 |
6.903 |
10.8 |
49.6 |
||
|
1983 |
3.686 |
10.761 |
3.663 |
7.098 |
11.1 |
50.1 |
||
|
1984 |
3.714 |
10.831 |
3.687 |
7.144 |
11.2 |
52.3 |
||
|
1985 |
3.701 |
10.855 |
3.658 |
7.198 |
11.3 |
54.4 |
||
|
1986 |
3.763 |
11.038 |
3.704 |
7.334 |
11.5 |
56.0 |
||
|
1987 |
3.776 |
11.027 |
3.661 |
7.366 |
11.5 |
56.4 |
||
|
1988 |
3.749 |
10.915 |
3.586 |
7.329 |
11.4 |
57.8 |
||
|
1989 |
3.798 |
10.992 |
3.573 |
7.419 |
11.5 |
57.9 |
||
|
1990 |
4.057 |
11.695 |
3.784 |
7.911 |
12.1 |
57.9 |
||
|
1991 |
4.497 |
12.930 |
4.216 |
8.715 |
13.2 |
59.8 |
||
|
1992 |
4.829 |
13.773 |
4.470 |
9.303 |
13.9 |
59.9 |
||
|
1993 |
5.012 |
14.205 |
4.631 |
9.574 |
14.1 |
60.0 |
||
|
1994 |
5.033 |
14.161 |
4.593 |
9.568 |
13.9 |
61.7 |
||
|
1995 |
4.791 |
13.418 |
4.284 |
9.135 |
13.1 |
61.5 |
||
|
1996 |
4.434 |
12.321 |
3.928 |
8.600 |
12.3 |
58.7 |
||
|
1997 |
3.740 |
10.376 |
NA |
NA |
10.0 |
50.1 |
||
|
1998 |
3.050 |
8.347 |
NA |
NA |
8.1 |
42.9 |
||
|
1999 |
2.578 |
6.924 |
NA |
NA |
6.7 |
39.4 |
||
|
2000 |
2.303 |
6.143 |
1.655 |
4.479 |
6.1 |
38.1 |
||
|
2001 |
2.192 |
5.717 |
1.514 |
4.195 |
5.7 |
35.3 |
||
|
2002 |
2.187 |
5.609 |
1.479 |
4.119 |
5.6 |
33.6 |
||
|
2003 |
2.180 |
5.490 |
1.416 |
4.063 |
5.5 |
31.3 |
||
|
2004 |
2.153 |
5.342 |
1.362 |
3.969 |
5.4 |
30.2 |
||
|
2005 |
2.061 |
5.028 |
1.261 |
3.756 |
5.1 |
28.9 |
||
|
2006 |
1.906 |
4.582 |
1.120 |
3.453 |
4.6 |
26.7 |
||
|
2007 |
1.730 |
4.075 |
0.956 |
3.119 |
4.2 |
23.2 |
||
|
2008 |
1.701 |
4.005 |
0.946 |
3.059 |
4.1 |
21.6 |
||
|
2009 |
1.838 |
4.371 |
1.074 |
3.296 |
4.4 |
21.2 |
||
|
2010 |
1.919 |
4.598 |
1.163 |
3.435 |
4.6 |
20.9 |
||
|
2011 |
1.907 |
4.557 |
1.149 |
3.408 |
4.6 |
20.9 |
||
|
2012 |
1.852 |
4.402 |
1.104 |
3.298 |
4.4 |
20.3 |
||
|
2013 |
1.726 |
4.042 |
0.993 |
3.050 |
4.1 |
19.1 |
||
|
2014 |
1.650 |
3.957 |
1.007 |
2.950 |
4.0 |
18.9 |
||
|
2015 |
1.609 |
4.126 |
1.155 |
2.971 |
4.0 |
20.4 |
||
|
2016 |
1.479 |
3.780 |
1.037 |
2.743 |
3.7 |
20.7 |
||
|
2017 |
1.358 |
3.516 |
0,930 |
|
3.5 |
20.1 |
||
Source: Congressional Research Service (CRS), based on data from the U.S. Department of Health and Human Services (HHS) and the U.S. Census Bureau.
Notes: NA denotes not available. During transition reporting from AFDC to TANF, caseload statistics on adult and child recipients were not collectedcol ected. For those years, TANF children as a percent of all children and percent of all poor children were estimated by HHS and published in Welfare Indicators and Risk Factors, Annual Report to Congress, Table TANF 2, p. A-7. See http://aspe.hhs.gov/hsp/14/indicators/rpt_indicators.pdf.
.
Congressional Research Service
16
The Temporary Assistance for Needy Families (TANF) Block Grant: FAQs
Table A-2. Families Receiving AFDC/TANF Assistance by Family Category, Selected
Years, FY1988-FY2017
AFDC
TANF
1988
1994
2001
2006
2017
Number of Families Receiving Assistance
Adult Recipient or Work-Eligible Parent/Not Working
3,136,566
3,798,997
992,445
825,490
434,602
Adult Recipient or Work-Eligible Parent/Working
243,573
378,620
420,794
259,001
435,259
Child-Only/SSI Parent
59,988
171,391
171,951
176,670
126,483
Child-Only/Noncitizen Parent
47,566
184,397
125,900
153,445
133,173
Child-Only/Other Ineligible Parent
51,764
146,227
91,447
158,113
4,370
Child-Only/Caretaker Relative
188,598
328,290
255,984
261,944
198,103
Child-Only/Unknown
19,897
38,341
143,834
122,738
70,882
Totals
3,747,952
5,046,263
2,202,356
1,957,402
1,402,871
Percentage of All Families Receiving Assistance
Adult Recipient or Work-Eligible Parent/Not Working
83.7%
75.3%
45.1%
42.2%
31.0%
Adult Recipient or Work-Eligible Parent/Working
6.5
7.5
19.1
13.2
31.0
Child-Only/SSI Parent
1.6
3.4
7.8
9.0
9.0
Child-Only/Noncitizen Parent
1.3
3.7
5.7
7.8
9.5
Child-Only/Other Ineligible Parent
1.4
2.9
4.2
8.1
0.3
Child-Only/Caretaker Relative
5.0
6.5
11.6
13.4
14.1
Child-Only/Unknown
0.5
0.8
6.5
6.3
5.1
Totals
100.0
100.0
100.0
100.0
100.0
Years, FY1988-FY2017
|
AFDC |
TANF |
||||
|
|
1988 |
1994 |
2001 |
2006 |
2017 |
|
Number of Families Receiving Assistance |
|||||
|
Adult Recipient or Work-Eligible Parent/Not Working |
3,136,566 |
3,798,997 |
992,445 |
825,490 |
434,602 |
|
Adult Recipient or Work-Eligible Parent/Working |
243,573 |
378,620 |
420,794 |
259,001 |
435,259 |
|
Child-Only/SSI Parent |
59,988 |
171,391 |
171,951 |
176,670 |
126,483 |
|
Child-Only/Noncitizen Parent |
47,566 |
184,397 |
125,900 |
153,445 |
133,173 |
|
Child-Only/Other Ineligible Parent |
51,764 |
146,227 |
91,447 |
158,113 |
4,370 |
|
Child-Only/Caretaker Relative |
188,598 |
328,290 |
255,984 |
261,944 |
198,103 |
|
Child-Only/Unknown |
19,897 |
38,341 |
143,834 |
122,738 |
70,882 |
|
Totals |
3,747,952 |
5,046,263 |
2,202,356 |
1,957,402 |
1,402,871 |
|
Percentage of All Families Receiving Assistance |
|||||
|
Adult Recipient or Work-Eligible Parent/Not Working |
83.7% |
75.3% |
45.1% |
42.2% |
31.0% |
|
Adult Recipient or Work-Eligible Parent/Working |
6.5 |
7.5 |
19.1 |
13.2 |
31.0 |
|
Child-Only/SSI Parent |
1.6 |
3.4 |
7.8 |
9.0 |
9.0 |
|
Child-Only/Noncitizen Parent |
1.3 |
3.7 |
5.7 |
7.8 |
9.5 |
|
Child-Only/Other Ineligible Parent |
1.4 |
2.9 |
4.2 |
8.1 |
0.3 |
|
Child-Only/Caretaker Relative |
5.0 |
6.5 |
11.6 |
13.4 |
14.1 |
|
Child-Only/Unknown |
0.5 |
0.8 |
6.5 |
6.3 |
5.1 |
|
Totals |
100.0 |
100.0 |
100.0 |
100.0 |
100.0 |
Source: Congressional Research Service (CRS) tabulations of the FY1988 and FY1994 AFDC Quality Control (QC) data files and the FY2001, FY2006, and FY2017 TANF National Data Files.
Notes: FY2001 through FY2017 data include families receiving assistance from separate state programs (SSPs) with expenditures countable toward the TANF maintenance of effort (MOE) requirement. For FY2016, TANF families with an adult recipient include those families with "“work-eligible"” nonrecipient parents. These include nonrecipient parents who have been time-limited or sanctioned off the rollsrol s, but the family continues to receive a reduced benefit. For FY2001 and FY2006, such families cannot be identified and are classified as "“child-only” families.
Congressional Research Service
17
Appendix B. child-only" families.
State Tables Table B-1. Use of FY2017 TANF and MOE Funds by Category
(Dollars in millions)
Work,
Education,
Emergency and
Pre-
Basic
Administrative
and
Refundable
Short-Term
Child
K/Head
State
Assistance
Costs
Training
Child Care Tax Credit
Benefits
Welfare
Start
Other
Totals
Alabama
$22.318
$26.710
$5.349
$5.679
$0.000
$36.833
$32.240
$41.648
$40.208
$210.984
Alaska
58.114
6.024
8.397
8.879
0.000
0.000
0.000
0.000
4.985
86.399
Arizona
37.732
43.656
1.443
0.000
0.000
10.369
147.105
0.000
119.624
359.929
Arkansas
5.948
18.829
13.920
8.032
0.000
5.368
0.231
105.196
4.811
162.335
California
2539.250
573.786
1620.135
615.700
0.000
237.887
0.000
0.000
1010.169
6596.928
Colorado
89.927
23.474
10.687
11.929
77.489
31.389
46.532
74.851
43.716
409.995
Connecticut
52.352
46.885
12.037
41.764
0.000
18.646
61.273
83.561
171.132
487.651
Delaware
17.421
4.736
7.063
67.490
0.000
2.724
0.000
0.000
15.160
114.595
District of
121.650
8.398
37.991
59.532
28.928
51.110
0.000
0.000
9.299
316.909
Columbia
Florida
163.180
83.371
46.314
318.206
0.000
0.934
242.113
0.000
80.542
934.661
Georgia
86.540
20.570
11.265
22.183
0.000
0.085
257.554
0.000
90.828
489.024
Hawaii
39.957
16.540
52.170
4.972
0.000
0.425
1.294
0.000
84.876
200.233
Idaho
7.871
7.519
2.549
15.025
0.000
11.750
1.327
1.475
1.713
49.229
Il inois
43.419
0.184
18.685
596.459
47.254
0.916
221.080
58.586
79.217
1065.801
Indiana
16.714
23.452
182.300
112.404
28.904
0.546
15.520
0.000
131.405
511.244
Iowa
37.166
8.206
11.799
58.254
26.505
0.253
62.264
0.000
22.299
226.746
Kansas
13.920
14.568
1.594
6.673
48.347
0.071
22.980
14.437
50.495
173.086
Kentucky
170.762
14.601
29.380
38.815
0.000
0.000
0.000
0.000
15.474
269.032
CRS-18
Work,
Education,
Emergency and
Pre-
Basic
Administrative
and
Refundable
Short-Term
Child
K/Head
State
Assistance
Costs
Training
Child Care Tax Credit
Benefits
Welfare
Start
Other
Totals
Louisiana
19.191
18.079
26.153
10.214
14.671
9.471
33.144
45.991
35.029
211.945
Maine
25.693
3.138
0.310
14.888
7.561
4.162
7.683
0.415
28.130
91.980
Maryland
115.787
31.019
31.450
8.397
152.582
26.370
20.035
55.962
55.808
497.410
Massachusetts
207.063
36.557
174.674
327.404
174.125
103.873
8.311
0.000
66.263
1,098.270
Michigan
133.132
53.908
5.417
26.586
45.440
66.929
81.665
186.193
649.995
1,249.266
Minnesota
98.144
46.341
57.751
173.904
160.076
27.478
0.000
5.700
19.524
588.918
Mississippi
8.585
4.572
33.655
27.660
0.000
0.000
12.859
0.000
43.971
131.302
Missouri
42.341
7.317
19.813
64.380
0.000
59.191
102.816
0.000
60.586
356.444
Montana
26.080
7.451
6.282
10.495
0.000
2.195
3.187
0.000
9.708
65.397
Nebraska
26.603
5.383
14.079
23.489
35.062
0.000
2.836
0.000
0.290
107.742
Nevada
39.108
9.559
1.362
17.887
0.000
0.000
0.000
0.000
34.465
102.382
New
18.987
11.041
5.403
15.118
0.000
2.213
3.662
0.000
17.081
73.505
Hampshire
New Jersey
99.529
52.403
77.142
159.671
354.819
16.630
0.000
560.009
58.912
1,379.114
New Mexico
55.422
5.073
18.259
30.528
74.623
0.000
0.895
17.600
84.412
286.811
New York
1,455.625
389.219
147.068
355.940
1,410.980
219.797
290.559
467.685
361.475
5,098.348
North Carolina
41.570
43.356
4.785
194.900
0.000
5.077
125.782
115.709
44.926
576.104
North Dakota
4.070
4.422
4.070
1.102
0.000
0.019
17.270
0.000
1.274
32.226
Ohio
246.989
117.873
87.008
424.009
0.000
53.852
11.099
0.000
191.421
1,132.250
Oklahoma
42.603
11.274
10.776
48.668
0.000
3.536
15.999
12.079
29.282
174.217
Oregon
89.263
39.235
16.558
12.911
1.467
32.130
12.811
12.001
87.605
303.981
Pennsylvania
186.912
79.850
98.385
488.909
0.000
15.459
0.000
154.677
169.790
1,193.982
Rhode Island
24.435
5.434
10.869
41.679
19.129
26.237
27.334
0.800
10.171
166.088
CRS-19
Work,
Education,
Emergency and
Pre-
Basic
Administrative
and
Refundable
Short-Term
Child
K/Head
State
Assistance
Costs
Training
Child Care Tax Credit
Benefits
Welfare
Start
Other
Totals
South Carolina
38.231
24.983
14.782
4.085
0.000
0.000
0.000
26.794
54.010
162.886
South Dakota
13.813
2.581
3.866
0.803
0.000
3.174
1.958
0.000
3.057
29.254
Tennessee
62.597
22.152
9.618
18.976
0.000
0.000
0.000
61.668
1.377
176.387
Texas
50.837
77.601
82.284
0.000
0.000
32.166
284.108
342.674
59.966
929.636
Utah
25.289
8.863
26.555
21.438
0.000
4.419
3.676
5.501
33.702
129.443
Vermont
15.230
6.631
2.696
30.996
19.013
1.360
5.508
0.000
15.842
97.276
Virginia
68.485
31.387
38.944
32.558
0.371
5.269
0.000
0.000
84.885
261.900
Washington
143.608
88.021
145.004
222.086
0.000
56.731
0.000
61.125
315.382
1,031.957
West Virginia
26.753
15.010
0.461
15.321
0.000
19.584
35.656
0.000
26.644
139.428
Wisconsin
85.911
24.187
27.486
208.262
69.700
38.553
4.484
0.000
122.860
581.443
Wyoming
6.706
6.481
3.508
1.554
0.000
3.399
0.000
1.016
4.952
27.615
Totals
7,068.836
2,231.910
3,279.551
5,026.817
2,797.046
1,248.578
2,224.848
2,513.354
4,758.747
31,149.686
(Dollars in millions)
|
State |
Basic Assistance |
Administrative Costs |
Work, Education, and Training |
Child Care |
Refundable Tax Credit |
Emergency and Short-Term Benefits |
Child Welfare |
Pre-K/Head Start |
Other |
Totals |
|
Alabama |
$22.318 |
$26.710 |
$5.349 |
$5.679 |
$0.000 |
$36.833 |
$32.240 |
$41.648 |
$40.208 |
$210.984 |
|
Alaska |
58.114 |
6.024 |
8.397 |
8.879 |
0.000 |
0.000 |
0.000 |
0.000 |
4.985 |
86.399 |
|
Arizona |
37.732 |
43.656 |
1.443 |
0.000 |
0.000 |
10.369 |
147.105 |
0.000 |
119.624 |
359.929 |
|
Arkansas |
5.948 |
18.829 |
13.920 |
8.032 |
0.000 |
5.368 |
0.231 |
105.196 |
4.811 |
162.335 |
|
California |
2539.250 |
573.786 |
1620.135 |
615.700 |
0.000 |
237.887 |
0.000 |
0.000 |
1010.169 |
6596.928 |
|
Colorado |
89.927 |
23.474 |
10.687 |
11.929 |
77.489 |
31.389 |
46.532 |
74.851 |
43.716 |
409.995 |
|
Connecticut |
52.352 |
46.885 |
12.037 |
41.764 |
0.000 |
18.646 |
61.273 |
83.561 |
171.132 |
487.651 |
|
Delaware |
17.421 |
4.736 |
7.063 |
67.490 |
0.000 |
2.724 |
0.000 |
0.000 |
15.160 |
114.595 |
|
District of Columbia |
121.650 |
8.398 |
37.991 |
59.532 |
28.928 |
51.110 |
0.000 |
0.000 |
9.299 |
316.909 |
|
Florida |
163.180 |
83.371 |
46.314 |
318.206 |
0.000 |
0.934 |
242.113 |
0.000 |
80.542 |
934.661 |
|
Georgia |
86.540 |
20.570 |
11.265 |
22.183 |
0.000 |
0.085 |
257.554 |
0.000 |
90.828 |
489.024 |
|
Hawaii |
39.957 |
16.540 |
52.170 |
4.972 |
0.000 |
0.425 |
1.294 |
0.000 |
84.876 |
200.233 |
|
Idaho |
7.871 |
7.519 |
2.549 |
15.025 |
0.000 |
11.750 |
1.327 |
1.475 |
1.713 |
49.229 |
|
Illinois |
43.419 |
0.184 |
18.685 |
596.459 |
47.254 |
0.916 |
221.080 |
58.586 |
79.217 |
1065.801 |
|
Indiana |
16.714 |
23.452 |
182.300 |
112.404 |
28.904 |
0.546 |
15.520 |
0.000 |
131.405 |
511.244 |
|
Iowa |
37.166 |
8.206 |
11.799 |
58.254 |
26.505 |
0.253 |
62.264 |
0.000 |
22.299 |
226.746 |
|
Kansas |
13.920 |
14.568 |
1.594 |
6.673 |
48.347 |
0.071 |
22.980 |
14.437 |
50.495 |
173.086 |
|
Kentucky |
170.762 |
14.601 |
29.380 |
38.815 |
0.000 |
0.000 |
0.000 |
0.000 |
15.474 |
269.032 |
|
Louisiana |
19.191 |
18.079 |
26.153 |
10.214 |
14.671 |
9.471 |
33.144 |
45.991 |
35.029 |
211.945 |
|
Maine |
25.693 |
3.138 |
0.310 |
14.888 |
7.561 |
4.162 |
7.683 |
0.415 |
28.130 |
91.980 |
|
Maryland |
115.787 |
31.019 |
31.450 |
8.397 |
152.582 |
26.370 |
20.035 |
55.962 |
55.808 |
497.410 |
|
Massachusetts |
207.063 |
36.557 |
174.674 |
327.404 |
174.125 |
103.873 |
8.311 |
0.000 |
66.263 |
1,098.270 |
|
Michigan |
133.132 |
53.908 |
5.417 |
26.586 |
45.440 |
66.929 |
81.665 |
186.193 |
649.995 |
1,249.266 |
|
Minnesota |
98.144 |
46.341 |
57.751 |
173.904 |
160.076 |
27.478 |
0.000 |
5.700 |
19.524 |
588.918 |
|
Mississippi |
8.585 |
4.572 |
33.655 |
27.660 |
0.000 |
0.000 |
12.859 |
0.000 |
43.971 |
131.302 |
|
Missouri |
42.341 |
7.317 |
19.813 |
64.380 |
0.000 |
59.191 |
102.816 |
0.000 |
60.586 |
356.444 |
|
Montana |
26.080 |
7.451 |
6.282 |
10.495 |
0.000 |
2.195 |
3.187 |
0.000 |
9.708 |
65.397 |
|
Nebraska |
26.603 |
5.383 |
14.079 |
23.489 |
35.062 |
0.000 |
2.836 |
0.000 |
0.290 |
107.742 |
|
Nevada |
39.108 |
9.559 |
1.362 |
17.887 |
0.000 |
0.000 |
0.000 |
0.000 |
34.465 |
102.382 |
|
New Hampshire |
18.987 |
11.041 |
5.403 |
15.118 |
0.000 |
2.213 |
3.662 |
0.000 |
17.081 |
73.505 |
|
New Jersey |
99.529 |
52.403 |
77.142 |
159.671 |
354.819 |
16.630 |
0.000 |
560.009 |
58.912 |
1,379.114 |
|
New Mexico |
55.422 |
5.073 |
18.259 |
30.528 |
74.623 |
0.000 |
0.895 |
17.600 |
84.412 |
286.811 |
|
New York |
1,455.625 |
389.219 |
147.068 |
355.940 |
1,410.980 |
219.797 |
290.559 |
467.685 |
361.475 |
5,098.348 |
|
North Carolina |
41.570 |
43.356 |
4.785 |
194.900 |
0.000 |
5.077 |
125.782 |
115.709 |
44.926 |
576.104 |
|
North Dakota |
4.070 |
4.422 |
4.070 |
1.102 |
0.000 |
0.019 |
17.270 |
0.000 |
1.274 |
32.226 |
|
Ohio |
246.989 |
117.873 |
87.008 |
424.009 |
0.000 |
53.852 |
11.099 |
0.000 |
191.421 |
1,132.250 |
|
Oklahoma |
42.603 |
11.274 |
10.776 |
48.668 |
0.000 |
3.536 |
15.999 |
12.079 |
29.282 |
174.217 |
|
Oregon |
89.263 |
39.235 |
16.558 |
12.911 |
1.467 |
32.130 |
12.811 |
12.001 |
87.605 |
303.981 |
|
Pennsylvania |
186.912 |
79.850 |
98.385 |
488.909 |
0.000 |
15.459 |
0.000 |
154.677 |
169.790 |
1,193.982 |
|
Rhode Island |
24.435 |
5.434 |
10.869 |
41.679 |
19.129 |
26.237 |
27.334 |
0.800 |
10.171 |
166.088 |
|
South Carolina |
38.231 |
24.983 |
14.782 |
4.085 |
0.000 |
0.000 |
0.000 |
26.794 |
54.010 |
162.886 |
|
South Dakota |
13.813 |
2.581 |
3.866 |
0.803 |
0.000 |
3.174 |
1.958 |
0.000 |
3.057 |
29.254 |
|
Tennessee |
62.597 |
22.152 |
9.618 |
18.976 |
0.000 |
0.000 |
0.000 |
61.668 |
1.377 |
176.387 |
|
Texas |
50.837 |
77.601 |
82.284 |
0.000 |
0.000 |
32.166 |
284.108 |
342.674 |
59.966 |
929.636 |
|
Utah |
25.289 |
8.863 |
26.555 |
21.438 |
0.000 |
4.419 |
3.676 |
5.501 |
33.702 |
129.443 |
|
Vermont |
15.230 |
6.631 |
2.696 |
30.996 |
19.013 |
1.360 |
5.508 |
0.000 |
15.842 |
97.276 |
|
Virginia |
68.485 |
31.387 |
38.944 |
32.558 |
0.371 |
5.269 |
0.000 |
0.000 |
84.885 |
261.900 |
|
Washington |
143.608 |
88.021 |
145.004 |
222.086 |
0.000 |
56.731 |
0.000 |
61.125 |
315.382 |
1,031.957 |
|
West Virginia |
26.753 |
15.010 |
0.461 |
15.321 |
0.000 |
19.584 |
35.656 |
0.000 |
26.644 |
139.428 |
|
Wisconsin |
85.911 |
24.187 |
27.486 |
208.262 |
69.700 |
38.553 |
4.484 |
0.000 |
122.860 |
581.443 |
|
Wyoming |
6.706 |
6.481 |
3.508 |
1.554 |
0.000 |
3.399 |
0.000 |
1.016 |
4.952 |
27.615 |
|
Totals |
7,068.836 |
2,231.910 |
3,279.551 |
5,026.817 |
2,797.046 |
1,248.578 |
2,224.848 |
2,513.354 |
4,758.747 |
31,149.686 |
Source: Congressional Research Service (CRS), based on data from the U.S. Department of Health and Human Services (HHS).
Source: Congressional Research Service (CRS), based on data from the U.S. Department of Health and Human Services (HHS).
CRS-20
Table B-2. Use of FY2017 TANF and MOE Funds by Category as a Percentage of Total Federal TANF and State MOE Funding
Work,
Education,
Emergency and
Pre-
Basic
Administrative
and
Child
Refundable
Short-Term
Child
K/Head
State
Assistance
Costs
Training
Care
Tax Credit
Benefits
Welfare
Start
Other
Totals
Alabama
10.6%
12.7%
2.5%
2.7%
0.0%
17.5%
15.3%
19.7%
19.1%
100.0%
Alaska
67.3
7.0
9.7
10.3
0.0
0.0
0.0
0.0
5.8
100.0
Arizona
10.5
12.1
0.4
0.0
0.0
2.9
40.9
0.0
33.2
100.0
Arkansas
3.7
11.6
8.6
4.9
0.0
3.3
0.1
64.8
3.0
100.0
California
38.5
8.7
24.6
9.3
0.0
3.6
0.0
0.0
15.3
100.0
Colorado
21.9
5.7
2.6
2.9
18.9
7.7
11.3
18.3
10.7
100.0
Connecticut
10.7
9.6
2.5
8.6
0.0
3.8
12.6
17.1
35.1
100.0
Delaware
15.2
4.1
6.2
58.9
0.0
2.4
0.0
0.0
13.2
100.0
District of
38.4
2.6
12.0
18.8
9.1
16.1
0.0
0.0
2.9
100.0
Columbia
Florida
17.5
8.9
5.0
34.0
0.0
0.1
25.9
0.0
8.6
100.0
Georgia
17.7
4.2
2.3
4.5
0.0
0.0
52.7
0.0
18.6
100.0
Hawaii
20.0
8.3
26.1
2.5
0.0
0.2
0.6
0.0
42.4
100.0
Idaho
16.0
15.3
5.2
30.5
0.0
23.9
2.7
3.0
3.5
100.0
Il inois
4.1
0.0
1.8
56.0
4.4
0.1
20.7
5.5
7.4
100.0
Indiana
3.3
4.6
35.7
22.0
5.7
0.1
3.0
0.0
25.7
100.0
Iowa
16.4
3.6
5.2
25.7
11.7
0.1
27.5
0.0
9.8
100.0
Kansas
8.0
8.4
0.9
3.9
27.9
0.0
13.3
8.3
29.2
100.0
Kentucky
63.5
5.4
10.9
14.4
0.0
0.0
0.0
0.0
5.8
100.0
Louisiana
9.1
8.5
12.3
4.8
6.9
4.5
15.6
21.7
16.5
100.0
Maine
27.9
3.4
0.3
16.2
8.2
4.5
8.4
0.5
30.6
100.0
Maryland
23.3
6.2
6.3
1.7
30.7
5.3
4.0
11.3
11.2
100.0
CRS-21
Work,
Education,
Emergency and
Pre-
Basic
Administrative
and
Child
Refundable
Short-Term
Child
K/Head
State
Assistance
Costs
Training
Care
Tax Credit
Benefits
Welfare
Start
Other
Totals
Massachusetts
18.9
3.3
15.9
29.8
15.9
9.5
0.8
0.0
6.0
100.0
Michigan
10.7
4.3
0.4
2.1
3.6
5.4
6.5
14.9
52.0
100.0
Minnesota
16.7
7.9
9.8
29.5
27.2
4.7
0.0
1.0
3.3
100.0
Mississippi
6.5
3.5
25.6
21.1
0.0
0.0
9.8
0.0
33.5
100.0
Missouri
11.9
2.1
5.6
18.1
0.0
16.6
28.8
0.0
17.0
100.0
Montana
39.9
11.4
9.6
16.0
0.0
3.4
4.9
0.0
14.8
100.0
Nebraska
24.7
5.0
13.1
21.8
32.5
0.0
2.6
0.0
0.3
100.0
Nevada
38.2
9.3
1.3
17.5
0.0
0.0
0.0
0.0
33.7
100.0
New Hampshire
25.8
15.0
7.4
20.6
0.0
3.0
5.0
0.0
23.2
100.0
New Jersey
7.2
3.8
5.6
11.6
25.7
1.2
0.0
40.6
4.3
100.0
New Mexico
19.3
1.8
6.4
10.6
26.0
0.0
0.3
6.1
29.4
100.0
New York
28.6
7.6
2.9
7.0
27.7
4.3
5.7
9.2
7.1
100.0
North Carolina
7.2
7.5
0.8
33.8
0.0
0.9
21.8
20.1
7.8
100.0
North Dakota
12.6
13.7
12.6
3.4
0.0
0.1
53.6
0.0
4.0
100.0
Ohio
21.8
10.4
7.7
37.4
0.0
4.8
1.0
0.0
16.9
100.0
Oklahoma
24.5
6.5
6.2
27.9
0.0
2.0
9.2
6.9
16.8
100.0
Oregon
29.4
12.9
5.4
4.2
0.5
10.6
4.2
3.9
28.8
100.0
Pennsylvania
15.7
6.7
8.2
40.9
0.0
1.3
0.0
13.0
14.2
100.0
Rhode Island
14.7
3.3
6.5
25.1
11.5
15.8
16.5
0.5
6.1
100.0
South Carolina
23.5
15.3
9.1
2.5
0.0
0.0
0.0
16.4
33.2
100.0
South Dakota
47.2
8.8
13.2
2.7
0.0
10.9
6.7
0.0
10.5
100.0
Tennessee
35.5
12.6
5.5
10.8
0.0
0.0
0.0
35.0
0.8
100.0
Texas
5.5
8.3
8.9
0.0
0.0
3.5
30.6
36.9
6.5
100.0
CRS-22
Work,
Education,
Emergency and
Pre-
Basic
Administrative
and
Child
Refundable
Short-Term
Child
K/Head
State
Assistance
Costs
Training
Care
Tax Credit
Benefits
Welfare
Start
Other
Totals
Utah
19.5
6.8
20.5
16.6
0.0
3.4
2.8
4.3
26.0
100.0
Vermont
15.7
6.8
2.8
31.9
19.5
1.4
5.7
0.0
16.3
100.0
Virginia
26.1
12.0
14.9
12.4
0.1
2.0
0.0
0.0
32.4
100.0
Washington
13.9
8.5
14.1
21.5
0.0
5.5
0.0
5.9
30.6
100.0
West Virginia
19.2
10.8
0.3
11.0
0.0
14.0
25.6
0.0
19.1
100.0
Wisconsin
14.8
4.2
4.7
35.8
12.0
6.6
0.8
0.0
21.1
100.0
Wyoming
24.3
23.5
12.7
5.6
0.0
12.3
0.0
3.7
17.9
100.0
Totals
22.7
7.2
10.5
16.1
9.0
4.0
7.1
8.1
15.3
100.0
Table B-2. Use of FY2017 TANF and MOE Funds by Category as a Percentage of Total Federal TANF and State MOE Funding
|
Basic Assistance |
Administrative Costs |
Work, Education, and Training |
Child Care |
Refundable Tax Credit |
Emergency and Short-Term Benefits |
Child Welfare |
Pre-K/Head Start |
Other |
Totals |
||
|
Alabama |
10.6% |
12.7% |
2.5% |
2.7% |
0.0% |
17.5% |
15.3% |
19.7% |
19.1% |
100.0% |
|
|
Alaska |
67.3 |
7.0 |
9.7 |
10.3 |
0.0 |
0.0 |
0.0 |
0.0 |
5.8 |
100.0 |
|
|
Arizona |
10.5 |
12.1 |
0.4 |
0.0 |
0.0 |
2.9 |
40.9 |
0.0 |
33.2 |
100.0 |
|
|
Arkansas |
3.7 |
11.6 |
8.6 |
4.9 |
0.0 |
3.3 |
0.1 |
64.8 |
3.0 |
100.0 |
|
|
California |
38.5 |
8.7 |
24.6 |
9.3 |
0.0 |
3.6 |
0.0 |
0.0 |
15.3 |
100.0 |
|
|
Colorado |
21.9 |
5.7 |
2.6 |
2.9 |
18.9 |
7.7 |
11.3 |
18.3 |
10.7 |
100.0 |
|
|
Connecticut |
10.7 |
9.6 |
2.5 |
8.6 |
0.0 |
3.8 |
12.6 |
17.1 |
35.1 |
100.0 |
|
|
Delaware |
15.2 |
4.1 |
6.2 |
58.9 |
0.0 |
2.4 |
0.0 |
0.0 |
13.2 |
100.0 |
|
|
District of Columbia |
38.4 |
2.6 |
12.0 |
18.8 |
9.1 |
16.1 |
0.0 |
0.0 |
2.9 |
100.0 |
|
|
Florida |
17.5 |
8.9 |
5.0 |
34.0 |
0.0 |
0.1 |
25.9 |
0.0 |
8.6 |
100.0 |
|
|
Georgia |
17.7 |
4.2 |
2.3 |
4.5 |
0.0 |
0.0 |
52.7 |
0.0 |
18.6 |
100.0 |
|
|
Hawaii |
20.0 |
8.3 |
26.1 |
2.5 |
0.0 |
0.2 |
0.6 |
0.0 |
42.4 |
100.0 |
|
|
Idaho |
16.0 |
15.3 |
5.2 |
30.5 |
0.0 |
23.9 |
2.7 |
3.0 |
3.5 |
100.0 |
|
|
Illinois |
4.1 |
0.0 |
1.8 |
56.0 |
4.4 |
0.1 |
20.7 |
5.5 |
7.4 |
100.0 |
|
|
Indiana |
3.3 |
4.6 |
35.7 |
22.0 |
5.7 |
0.1 |
3.0 |
0.0 |
25.7 |
100.0 |
|
|
Iowa |
16.4 |
3.6 |
5.2 |
25.7 |
11.7 |
0.1 |
27.5 |
0.0 |
9.8 |
100.0 |
|
|
Kansas |
8.0 |
8.4 |
0.9 |
3.9 |
27.9 |
0.0 |
13.3 |
8.3 |
29.2 |
100.0 |
|
|
Kentucky |
63.5 |
5.4 |
10.9 |
14.4 |
0.0 |
0.0 |
0.0 |
0.0 |
5.8 |
100.0 |
|
|
Louisiana |
9.1 |
8.5 |
12.3 |
4.8 |
6.9 |
4.5 |
15.6 |
21.7 |
16.5 |
100.0 |
|
|
Maine |
27.9 |
3.4 |
0.3 |
16.2 |
8.2 |
4.5 |
8.4 |
0.5 |
30.6 |
100.0 |
|
|
Maryland |
23.3 |
6.2 |
6.3 |
1.7 |
30.7 |
5.3 |
4.0 |
11.3 |
11.2 |
100.0 |
|
|
Massachusetts |
18.9 |
3.3 |
15.9 |
29.8 |
15.9 |
9.5 |
0.8 |
0.0 |
6.0 |
100.0 |
|
|
Michigan |
10.7 |
4.3 |
0.4 |
2.1 |
3.6 |
5.4 |
6.5 |
14.9 |
52.0 |
100.0 |
|
|
Minnesota |
16.7 |
7.9 |
9.8 |
29.5 |
27.2 |
4.7 |
0.0 |
1.0 |
3.3 |
100.0 |
|
|
Mississippi |
6.5 |
3.5 |
25.6 |
21.1 |
0.0 |
0.0 |
9.8 |
0.0 |
33.5 |
100.0 |
|
|
Missouri |
11.9 |
2.1 |
5.6 |
18.1 |
0.0 |
16.6 |
28.8 |
0.0 |
17.0 |
100.0 |
|
|
Montana |
39.9 |
11.4 |
9.6 |
16.0 |
0.0 |
3.4 |
4.9 |
0.0 |
14.8 |
100.0 |
|
|
Nebraska |
24.7 |
5.0 |
13.1 |
21.8 |
32.5 |
0.0 |
2.6 |
0.0 |
0.3 |
100.0 |
|
|
Nevada |
38.2 |
9.3 |
1.3 |
17.5 |
0.0 |
0.0 |
0.0 |
0.0 |
33.7 |
100.0 |
|
|
New Hampshire |
25.8 |
15.0 |
7.4 |
20.6 |
0.0 |
3.0 |
5.0 |
0.0 |
23.2 |
100.0 |
|
|
New Jersey |
7.2 |
3.8 |
5.6 |
11.6 |
25.7 |
1.2 |
0.0 |
40.6 |
4.3 |
100.0 |
|
|
New Mexico |
19.3 |
1.8 |
6.4 |
10.6 |
26.0 |
0.0 |
0.3 |
6.1 |
29.4 |
100.0 |
|
|
New York |
28.6 |
7.6 |
2.9 |
7.0 |
27.7 |
4.3 |
5.7 |
9.2 |
7.1 |
100.0 |
|
|
North Carolina |
7.2 |
7.5 |
0.8 |
33.8 |
0.0 |
0.9 |
21.8 |
20.1 |
7.8 |
100.0 |
|
|
North Dakota |
12.6 |
13.7 |
12.6 |
3.4 |
0.0 |
0.1 |
53.6 |
0.0 |
4.0 |
100.0 |
|
|
Ohio |
21.8 |
10.4 |
7.7 |
37.4 |
0.0 |
4.8 |
1.0 |
0.0 |
16.9 |
100.0 |
|
|
Oklahoma |
24.5 |
6.5 |
6.2 |
27.9 |
0.0 |
2.0 |
9.2 |
6.9 |
16.8 |
100.0 |
|
|
Oregon |
29.4 |
12.9 |
5.4 |
4.2 |
0.5 |
10.6 |
4.2 |
3.9 |
28.8 |
100.0 |
|
|
Pennsylvania |
15.7 |
6.7 |
8.2 |
40.9 |
0.0 |
1.3 |
0.0 |
13.0 |
14.2 |
100.0 |
|
|
Rhode Island |
14.7 |
3.3 |
6.5 |
25.1 |
11.5 |
15.8 |
16.5 |
0.5 |
6.1 |
100.0 |
|
|
South Carolina |
23.5 |
15.3 |
9.1 |
2.5 |
0.0 |
0.0 |
0.0 |
16.4 |
33.2 |
100.0 |
|
|
South Dakota |
47.2 |
8.8 |
13.2 |
2.7 |
0.0 |
10.9 |
6.7 |
0.0 |
10.5 |
100.0 |
|
|
Tennessee |
35.5 |
12.6 |
5.5 |
10.8 |
0.0 |
0.0 |
0.0 |
35.0 |
0.8 |
100.0 |
|
|
Texas |
5.5 |
8.3 |
8.9 |
0.0 |
0.0 |
3.5 |
30.6 |
36.9 |
6.5 |
100.0 |
|
|
Utah |
19.5 |
6.8 |
20.5 |
16.6 |
0.0 |
3.4 |
2.8 |
4.3 |
26.0 |
100.0 |
|
|
Vermont |
15.7 |
6.8 |
2.8 |
31.9 |
19.5 |
1.4 |
5.7 |
0.0 |
16.3 |
100.0 |
|
|
Virginia |
26.1 |
12.0 |
14.9 |
12.4 |
0.1 |
2.0 |
0.0 |
0.0 |
32.4 |
100.0 |
|
|
Washington |
13.9 |
8.5 |
14.1 |
21.5 |
0.0 |
5.5 |
0.0 |
5.9 |
30.6 |
100.0 |
|
|
West Virginia |
19.2 |
10.8 |
0.3 |
11.0 |
0.0 |
14.0 |
25.6 |
0.0 |
19.1 |
100.0 |
|
|
Wisconsin |
14.8 |
4.2 |
4.7 |
35.8 |
12.0 |
6.6 |
0.8 |
0.0 |
21.1 |
100.0 |
|
|
Wyoming |
24.3 |
23.5 |
12.7 |
5.6 |
0.0 |
12.3 |
0.0 |
3.7 |
17.9 |
100.0 |
|
|
Totals |
22.7 |
7.2 |
10.5 |
16.1 |
9.0 |
4.0 |
7.1 |
8.1 |
15.3 |
100.0 |
|
Source: Congressional Research Service (CRS), based on data from the U.S. Department of Health and Human Services (HHS).
Source: Congressional Research Service (CRS), based on data from the U.S. Department of Health and Human Services (HHS). Notes: Detail may not add to totals because of rounding.
CRS-23 The Temporary Assistance for Needy Families (TANF) Block Grant: FAQs Table B-3. Unspent TANF Funds at the End of FY2017
(September 30, 2017, in millions of dollars)
Obligated
but Not
Unobligated
State
Spent
Balances
Alabama
$19.0
$55.2
Alaska
48.1
0.0
Arizona
0.0
30.7
Arkansas
32.7
31.0
California
307.2
0.0
Colorado
0.0
96.4
Connecticut
0.0
0.8
Delaware
0.6
7.8
District of
0.2
32.8
Columbia
Florida
17.1
0.0
Georgia
23.8
40.9
Hawaii
15.6
225.8
Idaho
0.0
20.0
Il inois
0.0
0.0
Indiana
46.3
109.5
Iowa
3.8
0.5
Kansas
0.4
67.9
Kentucky
0.0
66.5
Louisiana
7.9
0.0
Maine
5.6
141.1
Maryland
0.0
0.0
Massachusetts
0.0
0.0
Michigan
0.0
116.8
Minnesota
0.0
59.3
Mississippi
0.0
23.6
Missouri
0.0
0.3
Montana
10.3
13.1
Nebraska
0.0
64.2
Nevada
23.7
0.0
New
0.0
57.5
Hampshire
New Jersey
22.7
35.0
New Mexico
52.9
38.3
Congressional Research Service
24
The Temporary Assistance for Needy Families (TANF) Block Grant: FAQs
Obligated
but Not
Unobligated
State
Spent
Balances
New York
121.4
519.5
North
41.7
0.0
Carolina
North
0.0
9.7
Dakota
Ohio
462.7
29.4
Oklahoma
76.3
0.0
Oregon
0.0
50.3
Pennsylvania
63.3
427.0
Rhode Island
0.0
11.1
South
0.0
0.0
Carolina
South Dakota
0.0
22.5
Tennessee
0.0
517.8
Texas
190.0
1.3
Utah
0.0
79.2
Vermont
0.0
0.0
Virginia
8.0
122.0
Washington
0.0
65.1
West Virginia
0.0
57.4
Wisconsin
167.1
33.2
Wyoming
2.6
22.8
Total
1,771.0
3,303.1
(September 30, 2017, in millions of dollars)
|
State |
Obligated but Not Spent |
Unobligated Balances |
|
Alabama |
$19.0 |
$55.2 |
|
Alaska |
48.1 |
0.0 |
|
Arizona |
0.0 |
30.7 |
|
Arkansas |
32.7 |
31.0 |
|
California |
307.2 |
0.0 |
|
Colorado |
0.0 |
96.4 |
|
Connecticut |
0.0 |
0.8 |
|
Delaware |
0.6 |
7.8 |
|
District of Columbia |
0.2 |
32.8 |
|
Florida |
17.1 |
0.0 |
|
Georgia |
23.8 |
40.9 |
|
Hawaii |
15.6 |
225.8 |
|
Idaho |
0.0 |
20.0 |
|
Illinois |
0.0 |
0.0 |
|
Indiana |
46.3 |
109.5 |
|
Iowa |
3.8 |
0.5 |
|
Kansas |
0.4 |
67.9 |
|
Kentucky |
0.0 |
66.5 |
|
Louisiana |
7.9 |
0.0 |
|
Maine |
5.6 |
141.1 |
|
Maryland |
0.0 |
0.0 |
|
Massachusetts |
0.0 |
0.0 |
|
Michigan |
0.0 |
116.8 |
|
Minnesota |
0.0 |
59.3 |
|
Mississippi |
0.0 |
23.6 |
|
Missouri |
0.0 |
0.3 |
|
Montana |
10.3 |
13.1 |
|
Nebraska |
0.0 |
64.2 |
|
Nevada |
23.7 |
0.0 |
|
New Hampshire |
0.0 |
57.5 |
|
New Jersey |
22.7 |
35.0 |
|
New Mexico |
52.9 |
38.3 |
|
New York |
121.4 |
519.5 |
|
North Carolina |
41.7 |
0.0 |
|
North Dakota |
0.0 |
9.7 |
|
Ohio |
462.7 |
29.4 |
|
Oklahoma |
76.3 |
0.0 |
|
Oregon |
0.0 |
50.3 |
|
Pennsylvania |
63.3 |
427.0 |
|
Rhode Island |
0.0 |
11.1 |
|
South Carolina |
0.0 |
0.0 |
|
South Dakota |
0.0 |
22.5 |
|
Tennessee |
0.0 |
517.8 |
|
Texas |
190.0 |
1.3 |
|
Utah |
0.0 |
79.2 |
|
Vermont |
0.0 |
0.0 |
|
Virginia |
8.0 |
122.0 |
|
Washington |
0.0 |
65.1 |
|
West Virginia |
0.0 |
57.4 |
|
Wisconsin |
167.1 |
33.2 |
|
Wyoming |
2.6 |
22.8 |
|
Total |
1,771.0 |
3,303.1 |
Source: Congressional Research Service (CRS), based on data from the U.S. Department of Health and Human Services (HHS).
Table B-4. Number of Families, Recipients, Children, and Adults Receiving TANF
Assistance by State, September 2018
State
Families
Recipients
Children
Adults
Alabama
8,182
18,425
15,032
3,393
Alaska
2,571
6,815
4,732
2,083
Arizona
7,372
15,106
12,084
3,022
Arkansas
2,859
6,357
4,767
1,590
California
409,043
1,331,457
940,730
390,727
Colorado
12,502
32,692
22,727
9,965
Congressional Research Service
25
The Temporary Assistance for Needy Families (TANF) Block Grant: FAQs
State
Families
Recipients
Children
Adults
Connecticut
8,964
18,713
13,545
5,168
Delaware
3,761
10,450
6,272
4,178
District of Columbia
5,840
16,632
12,546
4,086
Florida
41,469
65,627
56,117
9,510
Georgia
10,484
20,246
18,353
1,893
Guam
491
1,083
929
154
Hawaii
4,274
11,653
8,294
3,359
Idaho
2,046
2,996
2,912
84
Il inois
11,048
21,810
19,689
2,121
Indiana
6,048
12,053
10,982
1,071
Iowa
9,650
23,295
17,746
5,549
Kansas
4,360
4,359
2,619
1,740
Kentucky
18,774
37,748
32,695
5,053
Louisiana
5,402
13,292
11,007
2,285
Maine
17,367
57,543
35,301
22,242
Maryland
17,352
42,996
32,025
10,971
Massachusetts
50,270
124,630
85,801
38,829
Michigan
12,338
30,453
24,978
5,475
Minnesota
16,973
40,370
31,246
9,124
Mississippi
4,040
7,907
6,399
1,508
Missouri
10,761
24,687
19,063
5,624
Montana
3,691
9,156
7,010
2,146
Nebraska
4,832
11,945
9,954
1,991
Nevada
9,023
22,836
17,191
5,645
New Hampshire
5,257
12,575
9,081
3,494
New Jersey
10,326
23,089
18,000
5,089
New Mexico
10,632
26,529
20,122
6,407
New York
122,363
313,143
221,544
91,599
North Carolina
14,574
25,263
22,791
2,472
North Dakota
984
2,453
2,072
381
Ohio
42,549
75,664
69,415
6,249
Oklahoma
6,176
13,696
11,958
1,738
Oregon
40,932
120,311
77,812
42,499
Pennsylvania
45,022
111,572
83,045
28,527
Puerto Rico
4,992
13,559
8,411
5,148
Rhode Island
4,197
9,954
7,274
2,680
South Carolina
8,314
18,326
15,449
2,877
Congressional Research Service
26
The Temporary Assistance for Needy Families (TANF) Block Grant: FAQs
State
Families
Recipients
Children
Adults
South Dakota
2,952
5,944
5,489
455
Tennessee
20,951
45,131
36,178
8,953
Texas
26,109
56,501
49,307
7,194
Utah
3,546
8,438
6,290
2,148
Vermont
2,918
6,599
4,703
1,896
Virgin Islands
160
496
334
162
Virginia
20,513
35,157
27,510
7,647
Washington
37,270
88,286
60,717
27,569
West Virginia
6,572
12,845
10,768
2,077
Wisconsin
15,740
34,089
28,275
5,814
Wyoming
499
1,142
882
260
Totals
1,175,335
3,104,094
2,280,173
823,921
Assistance by State, September 2018
|
State |
Families |
Recipients |
Children |
Adults |
|
Alabama |
8,182 |
18,425 |
15,032 |
3,393 |
|
Alaska |
2,571 |
6,815 |
4,732 |
2,083 |
|
Arizona |
7,372 |
15,106 |
12,084 |
3,022 |
|
Arkansas |
2,859 |
6,357 |
4,767 |
1,590 |
|
California |
409,043 |
1,331,457 |
940,730 |
390,727 |
|
Colorado |
12,502 |
32,692 |
22,727 |
9,965 |
|
Connecticut |
8,964 |
18,713 |
13,545 |
5,168 |
|
Delaware |
3,761 |
10,450 |
6,272 |
4,178 |
|
District of Columbia |
5,840 |
16,632 |
12,546 |
4,086 |
|
Florida |
41,469 |
65,627 |
56,117 |
9,510 |
|
Georgia |
10,484 |
20,246 |
18,353 |
1,893 |
|
Guam |
491 |
1,083 |
929 |
154 |
|
Hawaii |
4,274 |
11,653 |
8,294 |
3,359 |
|
Idaho |
2,046 |
2,996 |
2,912 |
84 |
|
Illinois |
11,048 |
21,810 |
19,689 |
2,121 |
|
Indiana |
6,048 |
12,053 |
10,982 |
1,071 |
|
Iowa |
9,650 |
23,295 |
17,746 |
5,549 |
|
Kansas |
4,360 |
4,359 |
2,619 |
1,740 |
|
Kentucky |
18,774 |
37,748 |
32,695 |
5,053 |
|
Louisiana |
5,402 |
13,292 |
11,007 |
2,285 |
|
Maine |
17,367 |
57,543 |
35,301 |
22,242 |
|
Maryland |
17,352 |
42,996 |
32,025 |
10,971 |
|
Massachusetts |
50,270 |
124,630 |
85,801 |
38,829 |
|
Michigan |
12,338 |
30,453 |
24,978 |
5,475 |
|
Minnesota |
16,973 |
40,370 |
31,246 |
9,124 |
|
Mississippi |
4,040 |
7,907 |
6,399 |
1,508 |
|
Missouri |
10,761 |
24,687 |
19,063 |
5,624 |
|
Montana |
3,691 |
9,156 |
7,010 |
2,146 |
|
Nebraska |
4,832 |
11,945 |
9,954 |
1,991 |
|
Nevada |
9,023 |
22,836 |
17,191 |
5,645 |
|
New Hampshire |
5,257 |
12,575 |
9,081 |
3,494 |
|
New Jersey |
10,326 |
23,089 |
18,000 |
5,089 |
|
New Mexico |
10,632 |
26,529 |
20,122 |
6,407 |
|
New York |
122,363 |
313,143 |
221,544 |
91,599 |
|
North Carolina |
14,574 |
25,263 |
22,791 |
2,472 |
|
North Dakota |
984 |
2,453 |
2,072 |
381 |
|
Ohio |
42,549 |
75,664 |
69,415 |
6,249 |
|
Oklahoma |
6,176 |
13,696 |
11,958 |
1,738 |
|
Oregon |
40,932 |
120,311 |
77,812 |
42,499 |
|
Pennsylvania |
45,022 |
111,572 |
83,045 |
28,527 |
|
Puerto Rico |
4,992 |
13,559 |
8,411 |
5,148 |
|
Rhode Island |
4,197 |
9,954 |
7,274 |
2,680 |
|
South Carolina |
8,314 |
18,326 |
15,449 |
2,877 |
|
South Dakota |
2,952 |
5,944 |
5,489 |
455 |
|
Tennessee |
20,951 |
45,131 |
36,178 |
8,953 |
|
Texas |
26,109 |
56,501 |
49,307 |
7,194 |
|
Utah |
3,546 |
8,438 |
6,290 |
2,148 |
|
Vermont |
2,918 |
6,599 |
4,703 |
1,896 |
|
Virgin Islands |
160 |
496 |
334 |
162 |
|
Virginia |
20,513 |
35,157 |
27,510 |
7,647 |
|
Washington |
37,270 |
88,286 |
60,717 |
27,569 |
|
West Virginia |
6,572 |
12,845 |
10,768 |
2,077 |
|
Wisconsin |
15,740 |
34,089 |
28,275 |
5,814 |
|
Wyoming |
499 |
1,142 |
882 |
260 |
|
Totals |
1,175,335 |
3,104,094 |
2,280,173 |
823,921 |
Source: Congressional Research Service (CRS), based on data from the U.S. Department of Health and Human Services (HHS).
Notes: TANF cash assistance caseload includes families receiving assistance in state-funded programs counted toward the TANF maintenance of effort (MOE) requirement.
Table B-5. Number of Needy Families with Children Receiving Assistance by State,
September of Selected Years
Percentage Change to 2018 from
State
1994
2010
2017
2018
1994
2010
2017
Alabama
48,752
23,052
9,326
8,182
-83.2
-64.5
-12.3
Alaska
12,450
3,507
3,093
2,571
-79.3
-26.7
-16.9
Arizona
72,728
18,774
8,222
7,372
-89.9
-60.7
-10.3
Arkansas
25,298
8,469
3,072
2,859
-88.7
-66.2
-6.9
California
916,795
590,121
511,311
409,043
-55.4
-30.7
-20.0
Colorado
40,544
11,707
16,646
12,502
-69.2
6.8
-24.9
Connecticut
60,336
16,848
9,798
8,964
-85.1
-46.8
-8.5
Delaware
11,408
5,508
3,873
3,761
-67.0
-31.7
-2.9
District of Columbia
27,320
8,547
3,124
5,840
-78.6
-31.7
86.9
Florida
239,702
57,742
45,027
41,469
-82.7
-28.2
-7.9
Georgia
141,596
20,133
10,399
10,484
-92.6
-47.9
0.8
Guam
2,089
1,276
541
491
-76.5
-61.5
-9.2
Hawaii
21,312
9,953
4,937
4,274
-79.9
-57.1
-13.4
Idaho
8,635
1,820
1,928
2,046
-76.3
12.4
6.1
Il inois
241,290
24,337
12,613
11,048
-95.4
-54.6
-12.4
Indiana
72,654
36,062
6,962
6,048
-91.7
-83.2
-13.1
Congressional Research Service
27
The Temporary Assistance for Needy Families (TANF) Block Grant: FAQs
Percentage Change to 2018 from
State
1994
2010
2017
2018
1994
2010
2017
Iowa
39,137
21,548
10,694
9,650
-75.3
-55.2
-9.8
Kansas
29,524
15,554
4,462
4,360
-85.2
-72.0
-2.3
Kentucky
78,720
30,875
20,785
18,774
-76.2
-39.2
-9.7
Louisiana
84,162
10,849
5,521
5,402
-93.6
-50.2
-2.2
Maine
22,322
15,377
18,452
17,367
-22.2
12.9
-5.9
Maryland
80,266
25,110
18,611
17,352
-78.4
-30.9
-6.8
Massachusetts
108,985
49,836
51,196
50,270
-53.9
0.9
-1.8
Michigan
215,873
67,241
13,846
12,338
-94.3
-81.7
-10.9
Minnesota
59,987
24,574
18,519
16,973
-71.7
-30.9
-8.3
Mississippi
55,232
11,895
4,891
4,040
-92.7
-66.0
-17.4
Missouri
91,875
39,262
12,452
10,761
-88.3
-72.6
-13.6
Montana
11,416
3,686
4,517
3,691
-67.7
0.1
-18.3
Nebraska
15,435
8,702
5,262
4,832
-68.7
-44.5
-8.2
Nevada
14,620
10,612
9,828
9,023
-38.3
-15.0
-8.2
New Hampshire
11,398
6,175
4,884
5,257
-53.9
-14.9
7.6
New Jersey
122,376
34,516
12,640
10,326
-91.6
-70.1
-18.3
New Mexico
34,535
21,223
11,066
10,632
-69.2
-49.9
-3.9
New York
461,751
154,936
132,675
122,363
-73.5
-21.0
-7.8
North Carolina
129,258
23,705
16,108
14,574
-88.7
-38.5
-9.5
North Dakota
5,410
1,996
1,105
984
-81.8
-50.7
-11.0
Ohio
244,099
105,140
54,161
42,549
-82.6
-59.5
-21.4
Oklahoma
46,572
9,388
6,797
6,176
-86.7
-34.2
-9.1
Oregon
40,504
31,751
43,754
40,932
1.1
28.9
-6.4
Pennsylvania
212,457
53,274
50,615
45,022
-78.8
-15.5
-11.1
Puerto Rico
57,337
13,371
7,000
4,992
-91.3
-62.7
-28.7
Rhode Island
22,776
6,758
4,466
4,197
-81.6
-37.9
-6.0
South Carolina
50,430
19,347
8,672
8,314
-83.5
-57.0
-4.1
South Dakota
6,601
3,291
3,030
2,952
-55.3
-10.3
-2.6
Tennessee
109,678
62,714
24,562
20,951
-80.9
-66.6
-14.7
Texas
284,973
51,931
28,839
26,109
-90.8
-49.7
-9.5
Utah
17,505
6,646
4,013
3,546
-79.7
-46.6
-11.6
Vermont
9,761
3,256
3,371
2,918
-70.1
-10.4
-13.4
Virgin Islands
1,146
537
197
160
-86.0
-70.2
-18.8
Virginia
74,257
37,448
22,232
20,513
-72.4
-45.2
-7.7
Washington
101,542
70,200
35,284
37,270
-63.3
-46.9
5.6
West Virginia
40,279
10,496
7,113
6,572
-83.7
-37.4
-7.6
Congressional Research Service
28
The Temporary Assistance for Needy Families (TANF) Block Grant: FAQs
Percentage Change to 2018 from
State
1994
2010
2017
2018
1994
2010
2017
Wisconsin
75,086
24,746
16,318
15,740
-79.0
-36.4
-3.5
Wyoming
5,351
318
513
499
-90.7
56.9
-2.7
Totals
5,015,545 1,926,140 1,349,323 1,175,335
-76.6
-39.0
-12.9
Source: Congressional Research Service (CRS), based on data from the U.S. Department of Health and Human Services (HHS). Notes: Data for Puerto Rico are unavailable for September 2017. Total change excludes data for Puerto Rico
for all years. Caseload data for 2000 through 2017 include those families in Separate State Programs with expenditures countable toward the TANF maintenance of effort (MOE) requirement.
Table B-6. TANF Assistance Families by Number of Parents by State:
September 2018
Percentage of Total Families
Total
Single
Two
No
Fami-
Single
Two
No
Total
State
Parent Parent Parent
lies
Parent
Parent
Parent
Families
Alabama
3,272
42
4,868
8,182
40.0%
0.5%
59.5%
100.0%
Alaska
1,510
252
809
2,571
58.7
9.8
31.5
100.0
Arizona
2,718
114
4,540
7,372
36.9
1.5
61.6
100.0
Arkansas
1,462
59
1,338
2,859
51.1
2.1
46.8
100.0
California
251,231
27,704 130,108
409,043
61.4
6.8
31.8
100.0
Colorado
9,331
0
3,171
12,502
74.6
0.0
25.4
100.0
Connecticut
2,942
0
6,022
8,964
32.8
0.0
67.2
100.0
Delaware
994
9
2,758
3,761
26.4
0.2
73.3
100.0
District of Columbia
4,086
0
1,754
5,840
70.0
0.0
30.0
100.0
Florida
5,287
215
35,967
41,469
12.7
0.5
86.7
100.0
Georgia
1,982
0
8,502
10,484
18.9
0.0
81.1
100.0
Guam
86
27
378
491
17.5
5.5
77.0
100.0
Hawaii
2,577
611
1,086
4,274
60.3
14.3
25.4
100.0
Idaho
84
0
1,962
2,046
4.1
0.0
95.9
100.0
Il inois
2,199
0
8,849
11,048
19.9
0.0
80.1
100.0
Indiana
1,366
40
4,642
6,048
22.6
0.7
76.8
100.0
Iowa
4,682
390
4,578
9,650
48.5
4.0
47.4
100.0
Kansas
1,806
206
2,348
4,360
41.4
4.7
53.9
100.0
Kentucky
4,308
382
14,084
18,774
22.9
2.0
75.0
100.0
Congressional Research Service
29
The Temporary Assistance for Needy Families (TANF) Block Grant: FAQs
Percentage of Total Families
Total
Single
Two
No
Fami-
Single
Two
No
Total
State
Parent Parent Parent
lies
Parent
Parent
Parent
Families
Louisiana
2,268
0
3,134
5,402
42.0
0.0
58.0
100.0
Maine
9,178
6,529
1,660
17,367
52.8
37.6
9.6
100.0
Maryland
10,651
281
6,420
17,352
61.4
1.6
37.0
100.0
Massachusetts
34,435
3,029
12,806
50,270
68.5
6.0
25.5
100.0
Michigan
4,646
0
7,692
12,338
37.7
0.0
62.3
100.0
Minnesota
9,185
0
7,788
16,973
54.1
0.0
45.9
100.0
Mississippi
1,481
0
2,559
4,040
36.7
0.0
63.3
100.0
Missouri
6,301
0
4,460
10,761
58.6
0.0
41.4
100.0
Montana
1,792
282
1,617
3,691
48.6
7.6
43.8
100.0
Nebraska
1,984
0
2,848
4,832
41.1
0.0
58.9
100.0
Nevada
4,161
680
4,182
9,023
46.1
7.5
46.3
100.0
New Hampshire
3,304
37
1,916
5,257
62.8
0.7
36.4
100.0
New Jersey
5,745
59
4,522
10,326
55.6
0.6
43.8
100.0
New Mexico
5,057
675
4,900
10,632
47.6
6.3
46.1
100.0
New York
77,545
2,508
42,310
122,363
63.4
2.0
34.6
100.0
North Carolina
1,772
24
12,778
14,574
12.2
0.2
87.7
100.0
North Dakota
381
0
603
984
38.7
0.0
61.3
100.0
Ohio
5,322
345
36,882
42,549
12.5
0.8
86.7
100.0
Oklahoma
1,738
0
4,438
6,176
28.1
0.0
71.9
100.0
Oregon
27,855
6,521
6,556
40,932
68.1
15.9
16.0
100.0
Pennsylvania
27,889
471
16,662
45,022
61.9
1.0
37.0
100.0
Puerto Rico
4,490
251
251
4,992
89.9
5.0
5.0
100.0
Rhode Island
2,959
164
1,074
4,197
70.5
3.9
25.6
100.0
South Carolina
2,877
0
5,437
8,314
34.6
0.0
65.4
100.0
South Dakota
455
0
2,497
2,952
15.4
0.0
84.6
100.0
Tennessee
8,052
224
12,675
20,951
38.4
1.1
60.5
100.0
Texas
7,194
0
18,915
26,109
27.6
0.0
72.4
100.0
Utah
1,564
0
1,982
3,546
44.1
0.0
55.9
100.0
Vermont
1,322
277
1,319
2,918
45.3
9.5
45.2
100.0
Virgin Islands
131
0
29
160
81.9
0.0
18.1
100.0
Virginia
11,114
0
9,399
20,513
54.2
0.0
45.8
100.0
Washington
17,561
7,313
12,396
37,270
47.1
19.6
33.3
100.0
West Virginia
1,572
0
5,000
6,572
23.9
0.0
76.1
100.0
Wisconsin
4,956
192
10,592
15,740
31.5
1.2
67.3
100.0
Congressional Research Service
30
The Temporary Assistance for Needy Families (TANF) Block Grant: FAQs
Percentage of Total Families
Total
Single
Two
No
Fami-
Single
Two
No
Total
State
Parent Parent Parent
lies
Parent
Parent
Parent
Families
Wyoming
223
19
257
499
44.7
3.8
51.5
100.0
Totals
609,083
59,932 506,320 1,175,335
51.8
5.1
43.1
100.0
Source: Congressional Research Service (CRS), based on data from the U.S. Department of Health and Human Services (HHS). Notes: TANF cash assistance caseload includes families receiving assistance in state-funded programs counted toward the TANF maintenance of effort (MOE) requirement.
Congressional Research Service
31
The Temporary Assistance for Needy Families (TANF) Block Grant: FAQs
Author Information
Gene Falk
Specialist in Social Policy
Acknowledgments
September of Selected Years
|
Percentage Change to 2018 from |
|||||||
|
State |
1994 |
2010 |
2017 |
2018 |
1994 |
2010 |
2017 |
|
Alabama |
48,752 |
23,052 |
9,326 |
8,182 |
-83.2 |
-64.5 |
-12.3 |
|
Alaska |
12,450 |
3,507 |
3,093 |
2,571 |
-79.3 |
-26.7 |
-16.9 |
|
Arizona |
72,728 |
18,774 |
8,222 |
7,372 |
-89.9 |
-60.7 |
-10.3 |
|
Arkansas |
25,298 |
8,469 |
3,072 |
2,859 |
-88.7 |
-66.2 |
-6.9 |
|
California |
916,795 |
590,121 |
511,311 |
409,043 |
-55.4 |
-30.7 |
-20.0 |
|
Colorado |
40,544 |
11,707 |
16,646 |
12,502 |
-69.2 |
6.8 |
-24.9 |
|
Connecticut |
60,336 |
16,848 |
9,798 |
8,964 |
-85.1 |
-46.8 |
-8.5 |
|
Delaware |
11,408 |
5,508 |
3,873 |
3,761 |
-67.0 |
-31.7 |
-2.9 |
|
District of Columbia |
27,320 |
8,547 |
3,124 |
5,840 |
-78.6 |
-31.7 |
86.9 |
|
Florida |
239,702 |
57,742 |
45,027 |
41,469 |
-82.7 |
-28.2 |
-7.9 |
|
Georgia |
141,596 |
20,133 |
10,399 |
10,484 |
-92.6 |
-47.9 |
0.8 |
|
Guam |
2,089 |
1,276 |
541 |
491 |
-76.5 |
-61.5 |
-9.2 |
|
Hawaii |
21,312 |
9,953 |
4,937 |
4,274 |
-79.9 |
-57.1 |
-13.4 |
|
Idaho |
8,635 |
1,820 |
1,928 |
2,046 |
-76.3 |
12.4 |
6.1 |
|
Illinois |
241,290 |
24,337 |
12,613 |
11,048 |
-95.4 |
-54.6 |
-12.4 |
|
Indiana |
72,654 |
36,062 |
6,962 |
6,048 |
-91.7 |
-83.2 |
-13.1 |
|
Iowa |
39,137 |
21,548 |
10,694 |
9,650 |
-75.3 |
-55.2 |
-9.8 |
|
Kansas |
29,524 |
15,554 |
4,462 |
4,360 |
-85.2 |
-72.0 |
-2.3 |
|
Kentucky |
78,720 |
30,875 |
20,785 |
18,774 |
-76.2 |
-39.2 |
-9.7 |
|
Louisiana |
84,162 |
10,849 |
5,521 |
5,402 |
-93.6 |
-50.2 |
-2.2 |
|
Maine |
22,322 |
15,377 |
18,452 |
17,367 |
-22.2 |
12.9 |
-5.9 |
|
Maryland |
80,266 |
25,110 |
18,611 |
17,352 |
-78.4 |
-30.9 |
-6.8 |
|
Massachusetts |
108,985 |
49,836 |
51,196 |
50,270 |
-53.9 |
0.9 |
-1.8 |
|
Michigan |
215,873 |
67,241 |
13,846 |
12,338 |
-94.3 |
-81.7 |
-10.9 |
|
Minnesota |
59,987 |
24,574 |
18,519 |
16,973 |
-71.7 |
-30.9 |
-8.3 |
|
Mississippi |
55,232 |
11,895 |
4,891 |
4,040 |
-92.7 |
-66.0 |
-17.4 |
|
Missouri |
91,875 |
39,262 |
12,452 |
10,761 |
-88.3 |
-72.6 |
-13.6 |
|
Montana |
11,416 |
3,686 |
4,517 |
3,691 |
-67.7 |
0.1 |
-18.3 |
|
Nebraska |
15,435 |
8,702 |
5,262 |
4,832 |
-68.7 |
-44.5 |
-8.2 |
|
Nevada |
14,620 |
10,612 |
9,828 |
9,023 |
-38.3 |
-15.0 |
-8.2 |
|
New Hampshire |
11,398 |
6,175 |
4,884 |
5,257 |
-53.9 |
-14.9 |
7.6 |
|
New Jersey |
122,376 |
34,516 |
12,640 |
10,326 |
-91.6 |
-70.1 |
-18.3 |
|
New Mexico |
34,535 |
21,223 |
11,066 |
10,632 |
-69.2 |
-49.9 |
-3.9 |
|
New York |
461,751 |
154,936 |
132,675 |
122,363 |
-73.5 |
-21.0 |
-7.8 |
|
North Carolina |
129,258 |
23,705 |
16,108 |
14,574 |
-88.7 |
-38.5 |
-9.5 |
|
North Dakota |
5,410 |
1,996 |
1,105 |
984 |
-81.8 |
-50.7 |
-11.0 |
|
Ohio |
244,099 |
105,140 |
54,161 |
42,549 |
-82.6 |
-59.5 |
-21.4 |
|
Oklahoma |
46,572 |
9,388 |
6,797 |
6,176 |
-86.7 |
-34.2 |
-9.1 |
|
Oregon |
40,504 |
31,751 |
43,754 |
40,932 |
1.1 |
28.9 |
-6.4 |
|
Pennsylvania |
212,457 |
53,274 |
50,615 |
45,022 |
-78.8 |
-15.5 |
-11.1 |
|
Puerto Rico |
57,337 |
13,371 |
7,000 |
4,992 |
-91.3 |
-62.7 |
-28.7 |
|
Rhode Island |
22,776 |
6,758 |
4,466 |
4,197 |
-81.6 |
-37.9 |
-6.0 |
|
South Carolina |
50,430 |
19,347 |
8,672 |
8,314 |
-83.5 |
-57.0 |
-4.1 |
|
South Dakota |
6,601 |
3,291 |
3,030 |
2,952 |
-55.3 |
-10.3 |
-2.6 |
|
Tennessee |
109,678 |
62,714 |
24,562 |
20,951 |
-80.9 |
-66.6 |
-14.7 |
|
Texas |
284,973 |
51,931 |
28,839 |
26,109 |
-90.8 |
-49.7 |
-9.5 |
|
Utah |
17,505 |
6,646 |
4,013 |
3,546 |
-79.7 |
-46.6 |
-11.6 |
|
Vermont |
9,761 |
3,256 |
3,371 |
2,918 |
-70.1 |
-10.4 |
-13.4 |
|
Virgin Islands |
1,146 |
537 |
197 |
160 |
-86.0 |
-70.2 |
-18.8 |
|
Virginia |
74,257 |
37,448 |
22,232 |
20,513 |
-72.4 |
-45.2 |
-7.7 |
|
Washington |
101,542 |
70,200 |
35,284 |
37,270 |
-63.3 |
-46.9 |
5.6 |
|
West Virginia |
40,279 |
10,496 |
7,113 |
6,572 |
-83.7 |
-37.4 |
-7.6 |
|
Wisconsin |
75,086 |
24,746 |
16,318 |
15,740 |
-79.0 |
-36.4 |
-3.5 |
|
Wyoming |
5,351 |
318 |
513 |
499 |
-90.7 |
56.9 |
-2.7 |
|
Totals |
5,015,545 |
1,926,140 |
1,349,323 |
1,175,335 |
-76.6 |
-39.0 |
-12.9 |
|
Percentage of Total Families |
||||||||
|
State |
Single Parent |
Two Parent |
No Parent |
Total Fami-lies |
Single Parent |
Two Parent |
No Parent |
Total Families |
|
Alabama |
3,272 |
42 |
4,868 |
8,182 |
40.0% |
0.5% |
59.5% |
100.0% |
|
Alaska |
1,510 |
252 |
809 |
2,571 |
58.7 |
9.8 |
31.5 |
100.0 |
|
Arizona |
2,718 |
114 |
4,540 |
7,372 |
36.9 |
1.5 |
61.6 |
100.0 |
|
Arkansas |
1,462 |
59 |
1,338 |
2,859 |
51.1 |
2.1 |
46.8 |
100.0 |
|
California |
251,231 |
27,704 |
130,108 |
409,043 |
61.4 |
6.8 |
31.8 |
100.0 |
|
Colorado |
9,331 |
0 |
3,171 |
12,502 |
74.6 |
0.0 |
25.4 |
100.0 |
|
Connecticut |
2,942 |
0 |
6,022 |
8,964 |
32.8 |
0.0 |
67.2 |
100.0 |
|
Delaware |
994 |
9 |
2,758 |
3,761 |
26.4 |
0.2 |
73.3 |
100.0 |
|
District of Columbia |
4,086 |
0 |
1,754 |
5,840 |
70.0 |
0.0 |
30.0 |
100.0 |
|
Florida |
5,287 |
215 |
35,967 |
41,469 |
12.7 |
0.5 |
86.7 |
100.0 |
|
Georgia |
1,982 |
0 |
8,502 |
10,484 |
18.9 |
0.0 |
81.1 |
100.0 |
|
Guam |
86 |
27 |
378 |
491 |
17.5 |
5.5 |
77.0 |
100.0 |
|
Hawaii |
2,577 |
611 |
1,086 |
4,274 |
60.3 |
14.3 |
25.4 |
100.0 |
|
Idaho |
84 |
0 |
1,962 |
2,046 |
4.1 |
0.0 |
95.9 |
100.0 |
|
Illinois |
2,199 |
0 |
8,849 |
11,048 |
19.9 |
0.0 |
80.1 |
100.0 |
|
Indiana |
1,366 |
40 |
4,642 |
6,048 |
22.6 |
0.7 |
76.8 |
100.0 |
|
Iowa |
4,682 |
390 |
4,578 |
9,650 |
48.5 |
4.0 |
47.4 |
100.0 |
|
Kansas |
1,806 |
206 |
2,348 |
4,360 |
41.4 |
4.7 |
53.9 |
100.0 |
|
Kentucky |
4,308 |
382 |
14,084 |
18,774 |
22.9 |
2.0 |
75.0 |
100.0 |
|
Louisiana |
2,268 |
0 |
3,134 |
5,402 |
42.0 |
0.0 |
58.0 |
100.0 |
|
Maine |
9,178 |
6,529 |
1,660 |
17,367 |
52.8 |
37.6 |
9.6 |
100.0 |
|
Maryland |
10,651 |
281 |
6,420 |
17,352 |
61.4 |
1.6 |
37.0 |
100.0 |
|
Massachusetts |
34,435 |
3,029 |
12,806 |
50,270 |
68.5 |
6.0 |
25.5 |
100.0 |
|
Michigan |
4,646 |
0 |
7,692 |
12,338 |
37.7 |
0.0 |
62.3 |
100.0 |
|
Minnesota |
9,185 |
0 |
7,788 |
16,973 |
54.1 |
0.0 |
45.9 |
100.0 |
|
Mississippi |
1,481 |
0 |
2,559 |
4,040 |
36.7 |
0.0 |
63.3 |
100.0 |
|
Missouri |
6,301 |
0 |
4,460 |
10,761 |
58.6 |
0.0 |
41.4 |
100.0 |
|
Montana |
1,792 |
282 |
1,617 |
3,691 |
48.6 |
7.6 |
43.8 |
100.0 |
|
Nebraska |
1,984 |
0 |
2,848 |
4,832 |
41.1 |
0.0 |
58.9 |
100.0 |
|
Nevada |
4,161 |
680 |
4,182 |
9,023 |
46.1 |
7.5 |
46.3 |
100.0 |
|
New Hampshire |
3,304 |
37 |
1,916 |
5,257 |
62.8 |
0.7 |
36.4 |
100.0 |
|
New Jersey |
5,745 |
59 |
4,522 |
10,326 |
55.6 |
0.6 |
43.8 |
100.0 |
|
New Mexico |
5,057 |
675 |
4,900 |
10,632 |
47.6 |
6.3 |
46.1 |
100.0 |
|
New York |
77,545 |
2,508 |
42,310 |
122,363 |
63.4 |
2.0 |
34.6 |
100.0 |
|
North Carolina |
1,772 |
24 |
12,778 |
14,574 |
12.2 |
0.2 |
87.7 |
100.0 |
|
North Dakota |
381 |
0 |
603 |
984 |
38.7 |
0.0 |
61.3 |
100.0 |
|
Ohio |
5,322 |
345 |
36,882 |
42,549 |
12.5 |
0.8 |
86.7 |
100.0 |
|
Oklahoma |
1,738 |
0 |
4,438 |
6,176 |
28.1 |
0.0 |
71.9 |
100.0 |
|
Oregon |
27,855 |
6,521 |
6,556 |
40,932 |
68.1 |
15.9 |
16.0 |
100.0 |
|
Pennsylvania |
27,889 |
471 |
16,662 |
45,022 |
61.9 |
1.0 |
37.0 |
100.0 |
|
Puerto Rico |
4,490 |
251 |
251 |
4,992 |
89.9 |
5.0 |
5.0 |
100.0 |
|
Rhode Island |
2,959 |
164 |
1,074 |
4,197 |
70.5 |
3.9 |
25.6 |
100.0 |
|
South Carolina |
2,877 |
0 |
5,437 |
8,314 |
34.6 |
0.0 |
65.4 |
100.0 |
|
South Dakota |
455 |
0 |
2,497 |
2,952 |
15.4 |
0.0 |
84.6 |
100.0 |
|
Tennessee |
8,052 |
224 |
12,675 |
20,951 |
38.4 |
1.1 |
60.5 |
100.0 |
|
Texas |
7,194 |
0 |
18,915 |
26,109 |
27.6 |
0.0 |
72.4 |
100.0 |
|
Utah |
1,564 |
0 |
1,982 |
3,546 |
44.1 |
0.0 |
55.9 |
100.0 |
|
Vermont |
1,322 |
277 |
1,319 |
2,918 |
45.3 |
9.5 |
45.2 |
100.0 |
|
Virgin Islands |
131 |
0 |
29 |
160 |
81.9 |
0.0 |
18.1 |
100.0 |
|
Virginia |
11,114 |
0 |
9,399 |
20,513 |
54.2 |
0.0 |
45.8 |
100.0 |
|
Washington |
17,561 |
7,313 |
12,396 |
37,270 |
47.1 |
19.6 |
33.3 |
100.0 |
|
West Virginia |
1,572 |
0 |
5,000 |
6,572 |
23.9 |
0.0 |
76.1 |
100.0 |
|
Wisconsin |
4,956 |
192 |
10,592 |
15,740 |
31.5 |
1.2 |
67.3 |
100.0 |
|
Wyoming |
223 |
19 |
257 |
499 |
44.7 |
3.8 |
51.5 |
100.0 |
|
Totals |
609,083 |
59,932 |
506,320 |
1,175,335 |
51.8 |
5.1 |
43.1 |
100.0 |
Author Contact Information
Acknowledgments
Jameson Carter and Mariam Ghavalyan updated the information in this report. Karen Lynch contributed to the discussion of the TANF funding lapse and legislation to fund TANF in FY2019. Amber Wilhelm produced this report'’s data visualizations.
Disclaimer
This document was prepared by the Congressional Research Service (CRS). CRS serves as nonpartisan shared staff to congressional committees and Members of Congress. It operates solely at the behest of and under the direction of Congress. Information in a CRS Report should not be relied upon for purposes other than public understanding of information that has been provided by CRS to Members of Congress in connection with CRS’s institutional role. CRS Reports, as a work of the United States Government, are not subject to copyright protection in the United States. Any CRS Report may be reproduced and distributed in its entirety without permission from CRS. However, as a CRS Report may include copyrighted images or material from a third party, you may need to obtain the permission of the copyright holder if you wish to copy or otherwise use copyrighted material.
Congressional Research Service
RL32760 · VERSION 179 · UPDATED
32 s data visualizations.
Footnotes
| 1. |
The definition of TANF assistance is not in statute. However, because the statutory language has most TANF requirements triggered by a family receiving "assistance," the Department of Health and Human Services (HHS) regulations define assistance at 45 C.F.R. §260.31. |
| 2. |
States are not required to report to the federal government their cash assistance benefit amounts in either the TANF state plan (under Section 402 of the Social Security Act) or in annual program reports (under Section 411 of the Social Security Act). The benefit amounts shown are from the "Welfare Rules Database," maintained by the Urban Institute and funded by the Department of Health and Human Services (HHS). |
| 3. |
Some states vary their benefit amounts for other family types such as two-parent families or "child-only" cases. States also vary their benefits by other factors such as housing costs and substate geography. |
| 4. |
In 2017, the HHS poverty guidelines for the contiguous 48 states and the District of Columbia for a family of three was $1,702 per month. Higher poverty lines applied in Alaska ($2,126 per month for a family of three) and Hawaii ($1,933 per month for a family of three). |
| 5. |
Families without a work-eligible individual are excluded from the participation rate calculation. It excludes families where the parent is a nonrecipient (for example, disabled receiving Supplemental Security Income or an ineligible noncitizen) or the children in the family are being cared for by a nonparent relative (e.g., grandparent, aunt, uncle) who does not receive assistance on his or her behalf. |
| 6. |
See CRS In Focus IF10856, Temporary Assistance for Needy Families: Work Requirements. |