Federal Pell Grant Program of the Higher Education Act: Primer
Changes from November 28, 2018 to September 9, 2021
This page shows textual changes in the document between the two versions indicated in the dates above. Textual matter removed in the later version is indicated with red strikethrough and textual matter added in the later version is indicated with blue.
Federal Pell Grant Program of the Higher Education Act: Primer
Contents
- Introduction
- Student Eligibility and Program Award Rules
- Student Eligibility
- Underlying Concepts and Award Rules
- Award Year
- Academic Year
- Payment Period
- Discretionary Base Maximum Award
- Mandatory Add-On Award
- Total Maximum Award
- Expected Family Contribution (EFC)
- Cost of Attendance (COA)
- Scheduled Award Rule
- Annual Award Rule
- Minimum Award
- Pell Grant Award Disbursements
- Year-Round (Summer) Pell Grants
- Maximum Pell Grant Lifetime Eligibility
- Institutional Role
- Description of Pell Grant Recipients and Participation
- Number of Recipients
- Income of Recipients
- Distribution of Pell Grant Recipients and Funds by Institutional Type
- Role of the Pell Grant
- Purchasing Power
- Receipt of Pell Grants and Other Aid
- Program Funding
- Role of Discretionary Funding
- Role of Mandatory Funding
- Summary of Recent and Projected Funding
- Discretionary Funding Shortfalls and Surpluses
- Policy Implications and Measures to Address Funding Shortfalls
- Reductions in Students' Awards and Recipient Caps Before 1992
- CBO Scoring Rule
- Reductions in Program Costs
- Supplementary Appropriations
- Policy Implications and Measures to Address Funding Surpluses
- Estimated Program Costs for Recent and Future Years
Figures
Tables
- Table 1. Pell Grant Award Amounts, AY2014-2015 through AY2018-2019
- Table 2. Federal Pell Grant Recipients, AY2011-2012 to AY2015-2016
- Table 3. Estimated Distribution of Pell Grant Recipients and Undergraduates not Receiving Pell Grants by Sector of Enrolling Institution, AY2015-2016
- Table 4. Pell Grant Aid, Student Loans, and Total Aid from All Sources as Average Percentages of Cost of Attendance for Undergraduate Students Who Have a Zero EFC and Received a Pell Grant, by Total Family Income (2014)
- Table 5. Pell Grant Funding (FY2012 to FY2021)
- Table 6. Annual and Cumulative Discretionary Funding Shortfalls in the Pell Grant Program, FY2009-FY2018
- Table 7. Estimated Pell Grant Program Costs, AY2012-2013 to AY2021-2022
- Table A-1. Pell Grant Award Amounts, AY1973-1974 and Subsequent Years
- Table B-1. Federal Pell Grant Recipients, AY1973-1974 to AY2015-2016
- Table C-1. Pell Grant Annual Funding: FY2008-FY2021
- Table D-1. Annual and Cumulative Discretionary Funding Shortfalls and Surpluses in the Pell Grant Program, FY1973-FY2018
Appendixes
- Appendix A. Historical Pell Grant Award Amounts
- Appendix B. Federal Pell Grant Recipients, AY1973-1974 to AY2015-2016
- Appendix C. Program Funding: FY2008-FY2021
- Appendix D. Annual and Cumulative Discretionary Funding Shortfalls and Surpluses in the Pell Grant Program, FY1973-FY2018
- Appendix E. Glossary/Acronyms
Summary
The federal Pell Grant program, authorized by Title IV of the Higher Education Act of 1965, as amended (HEA; P.L. 89-329), is the single largest source of federal grant aid supporting postsecondary education students. Pell Grants, and their predecessor, Basic Education Opportunity Grants, have been awarded since 1973. The program provided approximately $29 billion in aid to approximately 7.2 million undergraduate students in FY2017. Pell Grants are need-based aid that is intended to be the foundation for all need-based federal student aid awarded to undergraduates.
To be eligible for a Pell Federal Pell Grant Program of the Higher
September 9, 2021
Education Act: Primer
Cassandria Dortch
The federal Pel Grant program, authorized by Title IV of the Higher Education Act of
Specialist in Education
1965, as amended (HEA; P.L. 89-329), is the single largest source of federal grant aid
Policy
supporting postsecondary education students. Pel Grants, and their predecessor, Basic
Education Opportunity Grants, have been awarded since 1973. The program provided
approximately $27 bil ion in aid to approximately 6.3 mil ion undergraduate students in FY2020. Pel Grants are need-based aid that is intended to be the foundation for al need-based federal student aid awarded to undergraduates. Unlike loans, students do not repay Pel Grants.
Effective in award year 2023-2024, the FAFSA Simplification Act (FSA; Title VII of Division FF of P.L. 116-260, Consolidated Appropriations Act, 2021) makes several changes to the program. This report describes the Pel Grant program prior to award year 2023-2024.
To be eligible for a Pel Grant, an undergraduate student must meet several requirements. One key requirement is
Grant, an undergraduate student must meet several requirements. One key requirement is that the student and his or her family demonstrate financial need. Financial need is determined through the calculation of an expected family contribution (EFC), which is based on applicable family financial information provided on the Free Application for Federal Student Aid (FAFSA). Although there is no absolute income threshold that determines who is eligible or ineligible for Pell for Pel Grants, an estimated 95% of Pell Pel Grant recipients had a total family income at or below $60,000 in academic year 2015-20162017-2018. Other requirements include, but are not limited to, the student not having earned a bachelor'’s degree and being enrolled in an eligible program at an HEA HEA Title IV-participating institution of higher education for the purpose of earning a certificate or degree.
The maximum annual award a student may receive during an academic year is calculated in accordance with the Pell Pel Grant award rules. The student'’s scheduled award is the least of (1) the total maximum Pell Pel Grant minus the student'student’s EFC, or (2) Cost of Attendance (COA) minus EFC. For a student who enrolls on a less-than-full-time basis, the student'’s maximum annual award is the scheduled award ratably reduced. For FY2019FY2021 (academic year 2019-2020
2021-2022), the total maximum Pell Pel Grant is $6,195495. The COA is a measure of a student'’s educational expenses for the academic year. Qualified students who exhaust their scheduled award and remain enrolled beyond the academic year (e.g., enroll in a summer semester) during an award year receive a year-round or summer Pell Grant. With year-round Pell Grants, qualified studentsPel Grant such that they may receive up to 1½ scheduled grants in each award year. FinallyFinal y, a student may receive the value of no more than 12 full-time semesters (or the equivalent) of Pell Pel Grant awards over a lifetime.
The program is funded primarily through annual discretionary appropriations, although in recent years mandatory appropriations have played an increasing role in the programbut the HEA provides mandatory appropriations. The total maximum Pell Pel Grant is the sum of two components: the discretionary maximum award and the mandatory add-on award. The discretionary maximum award amount is funded by discretionary appropriations enacted in annual appropriations acts, and augmented by permanent and definite mandatory appropriations provided for in the HEA. For FY2019. For FY2021, the discretionary appropriation is $22.475 billionbil ion and the augmenting mandatory
funds total $1.370 billion170 bil ion. The mandatory add-on award amount is funded entirely by a permanent and indefinite mandatory appropriation of such sums as necessary, as authorized in the HEA. The mandatory add-on is estimated to require $6.077 billion in FY20195.412 bil ion in FY2021. Funding provided for the Pell Pel Grant program is exempt from sequestration.
The Pell
The Pel Grant program is often referred to as a quasi-entitlement because for the most part eligible students receive the Pell Pel Grant award level calculated for them without regard to available appropriations. In a given year, the discretionary appropriation level may be smallersmal er or larger than the actual cost to fund the discretionary
maximum award, despite the augmenting mandatory appropriation. When the discretionary appropriation is too smallsmal , the program carries a shortfall shortfal into the subsequent fiscal year. When the discretionary appropriation is too large, the program carries a surplus into the following fiscal year. Since FY2012, the program has maintained a surplus. The surplus has variably been used to increase Pell Grant awards, expand eligibility, and either fund other programs or reduce the national deficit.
Introduction
The Federal Pell had a surplus.
Congressional Research Service
link to page 5 link to page 6 link to page 6 link to page 8 link to page 8 link to page 8 link to page 9 link to page 9 link to page 9 link to page 10 link to page 10 link to page 10 link to page 11 link to page 12 link to page 12 link to page 12 link to page 13 link to page 14 link to page 15 link to page 15 link to page 15 link to page 16 link to page 17 link to page 17 link to page 18 link to page 20 link to page 21 link to page 21 link to page 22 link to page 22 link to page 24 link to page 25 link to page 26 link to page 26 link to page 28 link to page 28 link to page 28 link to page 29 link to page 29 link to page 30 link to page 13 Federal Pell Grant Program of the Higher Education Act: Primer
Contents
Introduction ................................................................................................................... 1 Student Eligibility and Program Award Rules ...................................................................... 2
Student Eligibility...................................................................................................... 2 Underlying Concepts and Award Rules ......................................................................... 4
Award Year.......................................................................................................... 4 Academic Year..................................................................................................... 4 Payment Period .................................................................................................... 5
Cost of Attendance (COA) ..................................................................................... 5 Discretionary Base Maximum Award ...................................................................... 5 Mandatory Add-On Award ..................................................................................... 6 Total Maximum Award.......................................................................................... 6 Expected Family Contribution (EFC) ...................................................................... 6
Scheduled Award Rule .......................................................................................... 7 Annual Award Rule .............................................................................................. 8 Minimum Award .................................................................................................. 8 Pel Grant Award Disbursements............................................................................. 8 Year-Round (Summer) Pel Grants .......................................................................... 9
Maximum Pel Grant Lifetime Eligibility ............................................................... 10
Institutional Role ..................................................................................................... 11
Description of Pel Grant Recipients and Participation ........................................................ 11
Number of Recipients............................................................................................... 11
Income of Recipients ............................................................................................... 12 Distribution of Pel Grant Recipients and Funds by Institutional Type.............................. 13
Role of the Pel Grant .................................................................................................... 13
Purchasing Power .................................................................................................... 14 Receipt of Pel Grants and Other Aid .......................................................................... 16
Program Funding .......................................................................................................... 17
Role of Discretionary Funding ................................................................................... 17 Role of Mandatory Funding ...................................................................................... 18 Summary of Recent and Projected Funding ................................................................. 18 Discretionary Funding Shortfal s and Surpluses............................................................ 20 Policy Implications and Measures to Address Funding Surpluses .................................... 21
Pursuing Other Policy Priorities............................................................................ 22 Expanding the Pel Grant Program ........................................................................ 22
Policy Implications and Measures to Address Funding Shortfal s .................................... 24
Reductions in Students’ Awards and Recipient Caps Before 1992 .............................. 24 CBO Scoring Rule.............................................................................................. 24 Reductions in Program Costs ............................................................................... 25
Supplementary Appropriations ............................................................................. 25
Estimated Program Costs for Recent and Future Years ........................................................ 26
Figures Figure 1. Example of Pel Grant Award Disbursement........................................................... 9
Congressional Research Service
link to page 14 link to page 14 link to page 19 link to page 19 link to page 9 link to page 16 link to page 17 link to page 17 link to page 20 link to page 20 link to page 20 link to page 23 link to page 25 link to page 25 link to page 30 link to page 32 link to page 34 link to page 36 link to page 39 link to page 39 link to page 32 link to page 34 link to page 36 link to page 39 link to page 39 link to page 42 link to page 42 Federal Pell Grant Program of the Higher Education Act: Primer
Figure 2. Example of Pel Grant Award Disbursement with Year-Round (Summer) Pel
Grant ........................................................................................................................ 10
Figure 3. Percentage of Tuition, Fees, Room, and Board Covered by the Total Maximum
Pel Grant, by Institutional Sector: AY1973-1974 to AY2019-2020 .................................... 15
Tables Table 1. Pel Grant Award Amounts, AY2017-2018 through AY2021-2022............................... 5 Table 2. Federal Pel Grant Recipients, AY2015-2016 to AY2019-2020 ................................. 12 Table 3. Estimated Distribution of Pel Grant Recipients and Undergraduates not
Receiving Pell Grants by Sector of Enrolling Institution, AY2015-2016 .............................. 13
Table 4. Pel Grant Aid, Student Loans, and Total Aid from Al Sources as Average
Percentages of Cost of Attendance for Undergraduate Students Who Have a Zero EFC and Received a Pel Grant, by Total Family Income (2014) ............................................... 16
Table 5. Pel Grant Funding (FY2017 to FY2026) .............................................................. 19 Table 6. Estimated Annual and Cumulative Discretionary Funding Shortfal s in
the Pel Grant Program, FY2017-FY2021 ...................................................................... 21
Table 7. Estimated Pel Grant Program Costs, AY2017-2018 to AY2026-2027 ........................ 26
Table A-1. Pel Grant Award Amounts, AY1973-1974 and Subsequent Years .......................... 28 Table B-1. Federal Pel Grant Recipients, AY1973-1974 and Subsequent Years ...................... 30 Table C-1. Pel Grant Annual Funding: FY2008-FY2021 .................................................... 32 Table D-1. Annual and Cumulative Discretionary Funding Shortfal s and Surpluses in
the Pel Grant Program, FY1973 and Subsequent Years .................................................... 35
Appendixes Appendix A. Historical Pell Grant Award Amounts............................................................. 28 Appendix B. Federal Pel Grant Recipients, AY1973-1974 and Subsequent Years ................... 30 Appendix C. Program Funding: FY2008-FY2021 .............................................................. 32 Appendix D. Annual and Cumulative Discretionary Funding Shortfal s and Surpluses in
the Pel Grant Program, FY1973 and Subsequent Years .................................................... 35
Appendix E. Glossary/Acronyms..................................................................................... 38
Contacts Author Information ....................................................................................................... 38
Congressional Research Service
Federal Pell Grant Program of the Higher Education Act: Primer
Introduction The Federal Pel Grant program, authorized by Title IV-A-1 of the Higher Education Act of 1965, (HEA; P.L. 89-329), as amended, is the single largest source of federal grant aid supporting
undergraduate students. The program provided approximately $29 billion 27 bil ion in aid to approximately 7.2 million undergraduate students in FY2017.1 Pell 6.3 mil ion undergraduate students in FY2020.1 Pel Grants are need-based aid that is intended to be the foundation for all al federal need-based student aid awarded to undergraduates. In award year 2015-2016, Pell Pel Grants represented 72% of all al federal undergraduate grant aid; 53% of federal, state, and institutional undergraduate need-based grant aid; and 28% of total grant aid for undergraduates coming from federal, state, institutional, and private sources.2
The2 Unlike loans,
students are not required to repay Pel Grants.
Prior to July 1, 2023, the discretionary statutory authority for the Pell Pel Grant program was authorized
reauthorized through FY2017.3 by the Higher Education Opportunity Act of 2008 (HEOA; P.L. 110-315). The discretionary authorization was extended through FY2018 under the General Education Provisions Act (GEPA), although the program has continued to receive appropriations.43 Effective July 1, 2023, the FAFSA Simplification Act (FSA; Title VII of Division FF of P.L. 116-260, Consolidated Appropriations Act, 2021) authorizes discretionary appropriations for FY2023
through FY2033.4 HEA also provides permanent mandatory program appropriations.
This report provides descriptions of key elements of the Pell Pel Grant program and information on recipient demographics, award levels, award value, program costs, and program funding.5 The prior to
the effective date of the FSA.5 For information on key changes authorized by the FSA that go into effect for award year 2023-2024, see CRS Report R46909, The FAFSA Simplification Act. The first section of the report addresses how the program works and describes the basic process for awarding Pell Pel Grants including the application process, student eligibility requirements, award rules and calculations, and the role of the institution of higher education (IHE) in the process. This section is followed by sectionsThe subsequent sections provide information on recipient characteristics and the role the program
plays in relation to other student aid.66 The report explains the complex Pell Pel Grant funding streams and their implications. FinallyFinal y, program costs and estimates are presented. In addition, the appendices provide historical Pell Pel Grant award amounts (Appendix A), Pell Grant recipient counts (Appendix B), recent and future program funding (Appendix C), surplus and shortfall Pel Grant recipient
1 U.S. Department of Education, Fiscal Year 2022 Budget, pp. O-4–O-5. 2 CRS analysis of AY2015-2016 data from the Department of Education, National Postsecondary Student Aid Study (NPSAS). T his survey, which is conducted about every four or more years, was most recently conducted for award year 2015-2016.
3 For more information on GEPA’s Contingent Extension of Programs, see CRS Report R41119, General Education Provisions Act (GEPA): Overview and Issues.
4 T he Department of Education has indicated that it is anticipating a phased implementation that would extend to award year 2024-25. Department of Education, Federal Student Aid, Beginning Phased Im plem entation of the FAFSA Sim plification Act (EA ID: GENERAL-21-39), June 11, 2021. 5 T his CRS report supersedes CRS Report 422446, Federal Pell Grant Program of the Higher Education Act: How the Program Works and Recent Legislative Changes. T he current report contains updated information.
6 T itle IV of HEA authorizes several student aid programs: Pell Grant program, Iraq and Afghanistan service grants, William D. Ford Federal Direct Loan (DL) Program, Federal Supplemental Educational Opportunity Grant (FSEOG) program, and Federal Work-Study (FWS) program. See CRS Report RL31618, Cam pus-Based Student Financial Aid Program s Under the Higher Education Act, and CRS Report R40122, Federal Student Loans Made Under the Federal Fam ily Education Loan Program and the William D. Ford Federal Direct Loan Program : Term s and Conditions for Borrowers.
Congressional Research Service
1
link to page 21 Federal Pell Grant Program of the Higher Education Act: Primer
counts (Appendix B), recent and future program funding (Appendix C), surplus and shortfal
levels (Appendix D), and acronyms commonly used in the report (Appendix E).
levels (Appendix D), and acronyms commonly used in the report (Appendix E).
Student Eligibility and Program Award Rules
This section of the report provides an overview of the structure of the Pell Pel Grant program and the process through which grants are made to students. It describes student eligibility, underlying concepts and award rules for determining students'’ grants, and the role played by postsecondary
institutions in the program.
Briefly, the Pell Pel Grant program provides grants (i.e., aid that does not have to be repaid) to financiallyfinancial y needy undergraduates. To apply for a Pell Pel Grant or any HEA Title IV student aid,
students must complete and submit the Free Application for Federal Student Aid (FAFSA), providing requested financial and other information.77 When the FAFSA is processed, the individual'individual’s expected family contribution (EFC) is calculated. The EFC is the amount expected to be contributed by the student and the student'’s family toward postsecondary education expenses for the upcoming academic year. After processing, each applicant receives a Student Aid Record
(SAR). Each institution of higher education (IHE) designated by the applicant on the FAFSA receives an Institutional Student Information Record (ISIR). The SAR and ISIR contain the
information submitted on the FAFSA and the individual's EFC.8
’s EFC.8
Institutions that receive valid SARs or valid ISIRs for eligible Pell Pel Grant applicants are required to disburse Pell Pel Grant funds to students who successfullysuccessful y enroll in approved coursework. Pell Pel Grants are portable aid, that is, the grant aid follows students to the eligible postsecondary education institutions in which they enroll. In addition, the Pell Pel Grant program is often referred to as a quasi-entitlement because for the most part eligible students receive the Pell Pel Grant award
level calculated for them without regard to available appropriations (for more on program funding, see the "“Program Funding”" section).99 The size of each student'’s grant is based, principallyprincipal y, on EFC, the total maximum Pell Pel Grant for the award year,1010 and the student's ’s
enrollment rate, but may not exceed the student'’s cost of attendance.
Student Eligibility
To be eligible for a Pell Pel Grant, a student must meet requirements that apply to HEA Title IV
student aid programs in general as well wel as requirements specific to the Pell Pel Grant program.11
11
Among the requirements generallygeneral y applicable to the HEA Title IV student aid programs for award
year (AY) 2021-2022 are the following:
7 T here are two ways to complete and submit a FAFSA for consideration of federal student aid. For instance, students and families may use FAFSA on the Web, which is an interactive online process. Alternatively, they may obtain a paper FAFSA from their financial aid office or other locations and submit it to the address listed on the form, although most applications are submitted electronically.
8 For more information on the FAFSA processes and calculation of EFC, see CRS Report R44503, Federal Student Aid: Need Analysis Form ulas and Expected Fam ily Contribution . 9 Student awards have not been reduced nor recipient caps imposed since AY1990-AY1991. 10 T he Pell Grant award year begins the first day of July in a given year and ends the last day of June the following year.
11 See Higher Education Act, as amended prior to the effective date of the FSA (hereinaft er referred to as HEA), Section 484 (34 C.F.R. part 668, subpart C) for general requirements and Section 401 (34 C.F.R. part 690, subpart A) for Pell Grant specific requirements.
Congressional Research Service
2
Federal Pell Grant Program of the Higher Education Act: Primer
year (AY) 2018-2019 are the following:
- Students must be accepted for enrollment or enrolled in an eligible
eligible institutioneligible institution of higher education for the purpose of earning a certificate or degree.12 - 12
Students must not be enrolled in an elementary or secondary school and must
have a high school diploma (or equivalent).
13 - 13
Students must meet citizenship requirements.
14 - Males must have registered with the selective service system when 18-25 years of age.
- 14 Students must maintain satisfactory academic progress while enrolled. Satisfactory academic progress requires a minimum grade point average (or its equivalent) and passing a minimum percentage of attempted credits or hours.
- Students must not be in default on a Title IV student loan, or have failed to repay or make an arrangement to repay an overpayment on a Title IV grant or loan, or be subject to a judgment lien for a debt owed to the United States. Students must have repaid any Title IV funds obtained fraudulently.
- Students may be disqualified for an unusual enrollment history—receiving HEA Title IV aid at multiple schools in the same semester, or receiving aid and withdrawing before earning any credit.
- Students may be disqualified for a period of time for a federal or state conviction for possession or sale of drugs while receiving HEA Title IV student aid.15
Specific eligibility requirements for the Pell Grant program include the following:
- Students must not have already completed the curriculum requirements of a bachelor's or higher degree.16
- Students must be enrolled in non-foreign institutions.
Students must be financially needy students as determined under the program'sSpecific eligibility requirements for the Pel Grant program include the following: Students must not have already completed the curriculum requirements of a bachelor’s or higher degree.15 Students must be enrolled in non-foreign institutions. 12 For purposes of the Pell Grant program, an eligible program requires at least 16 semester hours (or the equivalent) offered during a minimum of 15 weeks. Alternatively, an eligible program may be at least 8 semester hours (or the equivalent) offered during a minimum of 10 weeks, if an associate’s degree is required for admissions. One semester hour is an amount of student work defined by an institution and approved by the institution’s accrediting agency that is consistent with commonly accepted practice in postsecondary education and that approximates one hour of classroom or direct faculty instruction and at least two hours of out -of-class work each week for approximately 15 weeks. For information on HEA T itle IV eligible programs and eligible institutions, see CRS Report R43159, Institutional Eligibility for Participation in Title IV Student Financial Aid Program s. 13 T he equivalent of a high school diploma may include a general educational development (GED) certificate; the completion of an eligible homeschool program; or the completion of one of the ability to benefit alternatives and either being enrolled in an eligible career pathway program or being first enrolled in an eligible postsecondary program prior to July 1, 2012. T he ability to benefit may be demonstrated by passing an examination approved by ED to be eligible for federal student aid, or by successfully completing six credits or 225 clock hours of college work applicable to a certificate or degree offered by a postsecondary institution. A career pathway program is designed to combine occupational skills training, counseling, workforce preparation, high school completion, and postsecondary credential attainment. 14 In general, students must be U.S. citizens or permanent U.S. residents. Individuals with several other entrance statuses can qualify for aid. Individuals in the United States on a temporary basis, such as those with a student visa or an exchange visitor visa, are not eligible for federal student aid. Students with Deferred Action for Childhood Arrivals (DACA) status, conferred by the U.S. Citizenship & Immigration Services (USCIS) office in the Department of Homeland Security, are not eligible for HEA T itle IV aid. 15 Students with a bachelor’s degree may be enrolled at least half-time in a postbaccalaureate teacher education program . Half-time enrollment is at least 6 credit hours in a standard semester. A postbaccalaureate teacher education program does not lead to a graduate degree; is offered by a school that does not also offer a bachelor’s degree in education; and leads to certification or licensure necessary for employment as an elementary or secondary school teacher in the state. T o be eligible for a Pell Grant, the student enrolled in the postbaccalaureate teacher education program must be pursuing an initial teacher certification or licensing credential within the state. Congressional Research Service 3 Federal Pell Grant Program of the Higher Education Act: Primer Students must be financial y needy students as determined under the program’s award rules (see below). award rules (see below).- Students must not be incarcerated in a federal or state penal institution.
- Students must not be subject to an involuntary civil commitment following
incarceration for a sexual offense (as determined under the FBI
'’s Uniform Crime Reporting Program). -
Students with a significant
intellectual disabilityintel ectual disability must be accepted for enrollment or enrolled in a comprehensive transition and postsecondary program.17
16 Underlying Concepts and Award Rules
The amount of an eligible student's Pell student’s Pel Grant award is determined on the basis of a set of award rules. In general, these award rules are designed to ensure that the neediest students (as determined by their EFC) receive the highest Pell Pel Grant awards in each award year.1817 As need decreases or EFC increases, Pell Pel Grant awards decrease until they phase out completely. Students who demonstrate a level of need that falls between these two extremes are awarded Pell Grant aid on a sliding scale. Additionally, Pell Additional y, Pel Grant awards are prorated for students who attend on a less-than-full-time, full-
year basis. An important feature of the Pell Pel Grant award rules is that the grant is determined without consideration of any other financial assistance a student may be eligible to receive or may be receiving. This reflects the intention to make the Pell Pel Grant the foundation of federal need-based aid in a financial aid package. The Pell Grant award level is calculated without regard to other aid that may be awarded. Other HEA federal aid is added to the aid package after the Pell
Pel Grant is awarded.
Some of the underlying concepts associated with the Pell Pel Grant program, as well wel as the program's ’s award rules, are discussed below. In general, provisions are discussed as in effect for AY2018-2019.
the discussion reflects provisions in effect for
AY2021-2022.
Award Year
The HEA Award Year
The HEA Title IV award year begins the first day of July in a given year and ends the last day of June the following year. For example, award year (AY) 2018-20192021-2022 begins July 1, 20182021, and ends
June 30, 2019.
2022. Academic Year
The HEA Title IV academic year is an IHE-determined instructional unit. For credit hour programs, the academic year requires a minimum of 30 weeks of instructional time. For a clock hour program, the academic year requires a minimum of 26 weeks of instructional time. A full-
16 A student with a significant intellectual disability has a cognitive impairment, characterized by significant limitations in intellectual and cognitive functioning and significant limitations in adaptive behavior as expressed in conceptual, social, and practical adaptive skills; and is or was eligible for a free appropriate public education under the Individuals with Disabilities Education Act. For a description of the Individuals wit h Disabilities Education Act, see CRS Report R41833, The Individuals with Disabilities Education Act (IDEA), Part B: Key Statutory and Regulatory Provisions . Comprehensive transition and postsecondary (CT P) programs are not required to lead to a recognized credential (e.g., bachelor’s degree) or adhere to the same durational requirements that regular postsecondary programs must meet (e.g., a certain number of credit -bearing clock hours). Instead, CT P programs require students with intellectual disabilities to receive curriculum advising, participate at least part -time in courses or training with students who do not have intellectual disabilities, and prepare for gainful employment. A student with a significant intellectual disability in a CTP program does not require a high school diploma (or equivalent) and does not have to be enrolled for the purpose of obtaining a certificate or degree. A student with a significant intellectual disability in a CT P program must maintain satisfactory academic progress as determined by the school for the CT P program. 17 HEA §401.
Congressional Research Service
4
link to page 9 link to page 32 link to page 32 Federal Pell Grant Program of the Higher Education Act: Primer
hour program, the academic year requires a minimum of 26 weeks of instructional time. A full-time, full-academic-year student is expected to complete at least 24 semester hours, 36 quarter credit hours, or 900 clock hours. Each IHE establishes an academic year for each educational
program. There may be more than one academic year within an award year.
Payment Period
The payment period is an academic period or period of enrollment for which Pell Pel Grant aid is
disbursed. Each academic year must have at least two payment periods. For example, an IHE on a standard semester calendar may disburse Pell Pel Grant funds two times, once for each of two
semesters: fall fal and spring.
Cost of Attendance (COA)
For Pel Grant award purposes, the cost of attendance (COA) is an IHE-determined measure of
educational expenses for a student enrolled full-time for a full academic year. In general, it is the sum of (1) tuition and fees; (2) an al owance for books, supplies, transportation, and miscel aneous personal expenses; (3) an al owance for room and board; and (4) for a student with dependents, an al owance for costs expected to be incurred for dependent care.18 Institutions may use average costs for students at their school, rather than calculating actual expenses for each student. Average COA amounts must be based on the same category of students. For example,
institutions may establish separate averages by residency: in-state or out-of-state, or housing: on-
campus or off-campus.
Discretionary Base Maximum Award
Discretionary Base Maximum Award
The discretionary base maximum award is the amount specified in annual appropriations laws. For AY2018-2019
For AY2021-2022, the discretionary base maximum award is $5,035435. The annual appropriations laws also establish the amount of discretionary funding available to fund the discretionary base maximum award for the program for the corresponding award year. Table 1 presents the discretionary base maximum award for the last five years, andand Table A-1 provides a history of
discretionary base maximum award amounts since AY1973-1974.
Table 1. Pell Grant Award Amounts, AY2017-2018 through AY2021-2022
Discretionary
Award Year
Base Maximum
Mandatory Add-On
Total Maximum
(AY)
Award
Award
Award
2017-2018
$4,860
$1,060
$5,920
2018-2019
5,035
1,060
6,095
2019-2020
5,135
1,060
6,195
2020-2021
5,285
1,060
6,345
2021-2022
5,435
1,060
6,495
Sources: U.S. Department of Education, Department of Education Budget Tables, Congressional Action tables for FY2018-FY2021Table 1. Pell Grant Award Amounts, AY2014-2015 through AY2018-2019
|
Discretionary Base Maximum Award |
Mandatory Add-On Award |
Total Maximum Award |
|
2014-2015 |
$4,860 |
$870 |
$5,730 |
|
2015-2016 |
4,860 |
915 |
5,775 |
|
2016-2017 |
4,860 |
955 |
5,815 |
|
2017-2018 |
4,860 |
1,060 |
5,920 |
|
2018-2019 |
5,035 |
1,060 |
6,095 |
Sources: U.S. Department of Education, Department of Education Budget Tables, Congressional Action tables for FY2015-FY2018, downloaded from https://www2.ed.gov/about/overview/budget/tables.html?src=ct.
src=ct. Notes: For a history of Pell Pel Grant award amounts since AY1973-1974, seesee Table A-1.
Mandatory Add-On Award
18 T here are exceptions and allowable additions depending on the program of study, the student’s enrollment rate, whether the student has a disability, and the student’s living situation. See HEA §472.
Congressional Research Service
5
link to page 9 link to page 32 link to page 9 link to page 32 Federal Pell Grant Program of the Higher Education Act: Primer
Mandatory Add-On Award
The mandatory add-on award is an amount established by the HEA. ForSince AY2018-2019, the mandatory add-on award ishas been $1,060. The HEA provides permanent and indefinite mandatory appropriations to fund the mandatory add-on award. From AY2013-2014 through AY2017-2018, statutory provisions established a formula to annuallyannual y modify the mandatory add-
on amount to account for inflation. For AY2017-2018 and all al subsequent award years, the mandatory add-on amount remains the same in accordance with statutory provisions. Table 1 presents the mandatory add-on award for the most recent five years, andand Table A-1 provides a
history of mandatory add-on award amounts when provided since AY1973-1974.
Total Maximum Award
The total maximum award amount is the maximum Pell Pel Grant amount that a student may receive in an academic year. The total maximum award is the sum of the discretionary base maximum award and the mandatory add-on award. For AY2018-2019AY2021-2022, the total maximum award is $6,095495. Table 1 presents the total maximum award for the last five years, andand Table A-1 provides a
history of total maximum award amounts since AY1973-1974.
Expected Family Contribution (EFC)
The EFC is a numberdollar amount calculated in accordance with an HEA-defined methodology that is used to establish how much the student'’s family is expected to contribute to the student's ’s educational costs. The EFC is used in conjunction with COA to determine whether a student is eligible eligible for Title IV need-based aid (aid based on the student'’s and the student'’s family's ’s
financial need).19 Generally19 General y, a student with an EFC greater than the maximum Pell Grant will 90% of the maximum Pel Grant wil not be eligible for a Pell Grant for a Pel Grant, and a student with an EFC higher than their COA will wil not qualify for any federal need-based aid. The EFC calculation methodology differs for dependent students, independent students with no dependents other than a spouse, and independent students with one or more dependents other than a spouse. GenerallyGeneral y speaking, an independent student is an individual who is 24 years oldage 24 or over or meets another criterion specified in the HEA.2020 A student
under the age of 24 cannot qualify as independent on the basis of being financiallyfinancial y independent of his or her parents or not being claimed on the parents'’ tax return. The lowest EFC is $0, and there is no maximum EFC. The EFC is determined utilizing family and financial (income and asset)
information submitted by the aid applicant on the FAFSA.
Automatic (Auto) Zero EFC
Students who apply for federal student aid and meet certain qualifications automaticallyautomatical y receive a zero EFC ($0).2121 The qualifications are based on either the family'’s reporting income being below
a specified threshold or meeting other criteria.
Dependent students and independent students with dependents other than a spouse can qualify for an automatic zero EFC based on an AGI below a specified level and meeting other criteria.
19 For more information on the federal needs analysis methodology and calculation of EFC, see CRS Report R44503, Federal Student Aid: Need Analysis Form ulas and Expected Fam ily Contribution .
20 For HEA T itle IV aid purposes, an independent student is an individual who is at least 24 years of age by December 31 of the award year; is married; is a graduate or professional student; is a veteran of the U.S. Armed Forces or is currently serving on active duty in the military; has dependents other than a spouse; has been in foster care, an orphan, or a ward of the court (anytime since the age of 13); is an emancipated minor or in legal guardianship as determined by a court; is an unaccompanied, homeless youth or self-supporting, at risk of being homeless; or is deemed independent by a financial aid officer for other unusual circum stances. See HEA §480(d). 21 One of the benefits of qualifying for an automatic zero EFC is that it may reduce the number of questions the student
Congressional Research Service
6
Federal Pell Grant Program of the Higher Education Act: Primer
To qualify for an auto zero, the parents of the dependent student or the independent student (and spouse, as appropriate) must have an adjusted gross income (AGI) below a specific threshold and meet one of three additional criteria. The AGI threshold is $2527,000 for AY2018-2019.22AY2021-2022.22 The additional criteria are receipt of means-tested benefits from other federal programs, eligibility to file or having filed certain federal income tax returns, andor having been a dislocated worker. Independent students without dependents other than a spouse are not eligible for an automatic
zero based on their financial situation.
Zero EFC
An otherwise Pell Pel Grant-eligible student whose parent or guardian was a member of the U.S. Armed Forces and died as a result of performing military service in Iraq or Afghanistan after September 11, 2001, receives an automaticdies under specified circumstances receives a zero EFC provided the student was under 24 years old or was enrolled at an IHE at the time of the parent’s or guardian'’s death.23 The specified circumstances occur when
the parent or guardian was
a member of the U.S. Armed Forces and died as a result of performing military
service in Iraq or Afghanistan after September 11, 2001,24 or
actively serving as a public safety officer and died in the line of duty while
performing as a public safety officer.25
The zero EFC is used to award al HEA Title IV aid. A Pel Grant so awarded to the child of a
public safety officer is referred to as the Fallen Heroes Scholarship.
In cases where a student does not qualify for an automatic zero or zero EFC, the student may stil qualify for a calculated zero EFC on the basis of the full EFC formula and information provided
on the FAFSA.
s death.23
In cases where a student does not qualify for an automatic zero, the student may still qualify for a calculated zero EFC on the basis of the full EFC formula and information provided on the FAFSA.
Cost of Attendance (COA)
For Pell Grant award purposes, the cost of attendance (COA) is an IHE-determined measure of educational expenses for a student enrolled full-time for a full academic year. In general, it is the sum of (1) tuition and fees; (2) an allowance for books, supplies, transportation, and miscellaneous personal expenses; (3) an allowance for room and board; and (4) for a student with dependents, an allowance for costs expected to be incurred for dependent care.24 Institutions may use average costs for students at their school, rather than calculating actual expenses for each student. Average COA amounts must be based on the same category of students. For example, institutions may establish separate averages by residency: in-state or out-of-state, or housing: on-campus or off-campus.
Scheduled Award Rule
Scheduled Award Rule
The scheduled award is the maximum Pell Pel Grant aid a full-time, full-academic-year student can receive. In accordance with the HEA, the scheduled award is the least of (1) the total maximum Pell Pel Grant minus the student'’s EFC, or (2) Cost of Attendance (COA) minus EFC.2526 Most students are awarded Pell Pel Grant aid based on the first condition of this rule (i.e., Pell Pel Grant Award = Total Maximum Pell Pel Grant – EFC), since the total maximum Pell Pel Grant award available to a
student in an award year is typicallytypical y less than the student'’s COA at the attending institution. For example, a student with a zero EFC would be eligible for a scheduled Pell Pel Grant award that is
equivalent to the total maximum award, as long as the amount did not exceed the student'’s COA.
must answer when completing the FAFSA. HEA §479(c). 22 U.S. Department of Education, 2021-2022 Federal Student Aid Handbook, p. AVG-48. 23 See HEA §473(b). 24 For students who are not eligible for Pell Grants due to their EFC and who had a parent or guardian die as a result of military service in Iraq or Afghanistan after September 11, 2001, non -need-based grants called Iraq and Afghanistan Service Grants (IASG) are available. T he amount of the IASG is the same as the Pell Grant the student would be eligible for if he or she had a zero EFC. IASG payments are adjusted like Pell Grants for students who are enrolled less than full time, but unlike Pell Grants, these non -need-based grants do not count as estimated financial assistance. In addition, IASG is subject to sequestration.
25 A public safety officer is as defined in 42 U.S.C. §3796b or an eligible fire police officer. See HEA §473(b)(5). 26 T he HEA prohibits the Pell Grant from exceeding the difference between the COA and the EFC. T his precludes the awarding of a Pell Grant in excess of what a student might need to cover the COA after taking the EFC into account.
Congressional Research Service
7
link to page 13 Federal Pell Grant Program of the Higher Education Act: Primer
Annual Award Rule
Annual Award Rule
The annual award is the maximum Pell Pel Grant aid a full-academic-year student can receive at the student'student’s enrollment rate.2627 The HEA requires ED to annuallyannual y publish a schedule of annual award amounts that are proportionallyproportional y reduced scheduled awards for students who are not enrolled full-time for the full academic year.2728 In practice, ED publishes four disbursement schedules: full-
time; less than full-time, but at least ¾ -time; less than ¾-time, but at least ½-time; and less than ½-time. Each schedule provides a table of annual award amounts by COA increments and EFC increments. The annual award for a student enrolledenrol ed at least ½-time in a clock-hour or non-term
credit-hour program is taken from the full-time disbursement schedule.
Minimum Award
The minimum Pell Pel Grant award is the smallestsmal est annual award amount for which a student must qualify to receive a Pell Pel Grant award. In other words, a student must qualify for at least this minimum amount to be eligible for the program. The minimum award is 10% of the total
maximum award. For AY2018-2019AY2021-2022, the minimum Pell Pel Grant award is $610650, or 10% of $6,095.28
495.29
Alternatively, the minimum Pell Pel Grant award may be conceptualized as a maximum EFC. To qualify for a Pell Pel Grant award, a student'’s EFC must be no more than 90% of the total maximum award. In AY2018-2019AY2021-2022, a student with an EFC above $5,486846, or 90% of $6,095495 rounded to the
nearest whole number, would not be eligible for a Pell Grant.
for a Pel Grant. Pell Grant Award Disbursements
Pell
Pel Grant aid awards are disbursed in each payment period for which a student is eligible. Pell Pel Grants must be paid out in installmentsinstal ments over the academic year. In general, the annual award amount is proportionallyproportional y divided among each payment period in the academic year.2930 Each academic year must have at least two payment periods. For example at an IHE on a traditional
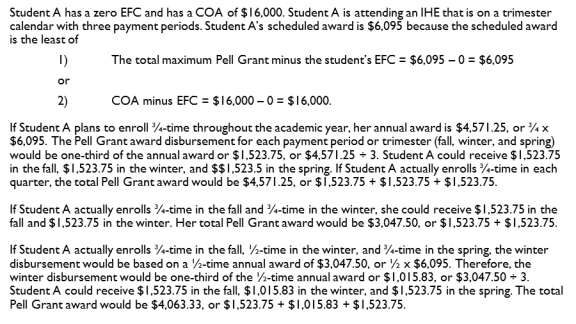
semester calendar in AY2018-2019AY2021-2022, a full-time, full-academic-year student with a zero EFC could receive $3,047247.50 in the fall fal semester and $3,047247.50 in the spring semester. SeeSee Figure 1 for an
example of Pell Pel Grant award disbursements.
27 T he annual award for a student in a clock-hour or nonterm credit -hour program is always the scheduled award even if the student is attending less than full time. 28 In recent years, ED has published the Federal Pell Grant Payment and Disbursement Schedules as a Dear Colleague Letter (DCL). For the 2021-2022 Federal Pell Grant Payment and Disbursement Schedules, see https://fsapartners.ed.gov/knowledge-center/library/dear-colleague-letters/2021-01-22/2021-2022-federal-pell-grant-payment -and-disbursement -schedules.
29 T he actual minimum award differs because ED uses midpoints for both the expected family contribution (EFC) and the cost of attendance (COA) in the scheduled award rule. ED’s Federal Pell Grant Payment and Disbursement Schedules group COA and EFC in approximately $100 increments and calculate the award levels for each increment based on the increment midpoints. 30 T he proportional division takes into consideration the number of weeks of each payment period and the number of full-time credit or clock hours in each payment period in comparison to the academic year definition.
Congressional Research Service
8
link to page 14
Federal Pell Grant Program of the Higher Education Act: Primer
Figure 1. Example of Pell Grant Award Disbursement
Grant award disbursements.
her enrol ment rate. Year-Round (Summer ) Pell Grants
Since award year 2017-2018,3031 qualified students may receive up to 1½ scheduled Pell Pel Grants, or up to 150% of the scheduled award, in each award year.3132 To qualify for the additional funds, a Pell Pel Grant-eligible student must be enrolled at least ½-time in a payment period after receiving
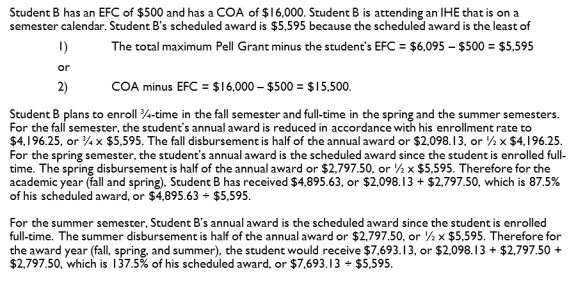
most or all al of the student'’s scheduled award in previous payment periods of the award year. For example at an IHE on a traditional semester calendar in award year 2018-20192021-2022, a full-time, full-academic-year student with a zero EFC could receive $3,047247.50 in the fall fal semester, $3,047247.50 in the spring semester, and $3,047247.50 in the summer semestersemester. Figure 2 provides an additional example.
her enrol ment rate. Maximum Pell Grant Lifetime Eligibility
The HEA establishes a maximum cumulative lifetime eligibility cap on Pell Pel Grant aid.3233 Over her
lifetime, a student may receive the value of no more than 12 full-time semesters (or the equivalent) of Pell Pel Grant awards or six scheduled awards.33 Pell 34 Pel Grant lifetime eligibility used (LEU) at a closed school from which the student did not graduate does not count toward the
lifetime cap—the eligibility used is restored.34
35
33 T he HEOA amendments introduced lifetime eligibility limitations for Pell Grants. Effective for students who received their first Pell Grant on or after July 1, 2008, cumulative Pell Grant lifetime eligibility was limited to 18 full-time semesters (or the equivalent). T he Consolidated Appropriations Act, 2012 (P.L. 112-74) reduced the cumulative lifetime eligibility for Pell Grant aid from 18 semesters to 12 semesters starting in AY2012-2013. Any Pell Grant aid received prior to AY2012-2013 is included in a student’s lifetime limit. 34 For example, students who consistently enroll half-time in standard terms throughout their progression to a bachelor’s degree could receive Pell Grant aid for 24 semesters, or 12 years. Students who consistently enroll full-time in standard terms throughout their degree progression to a bachelor’s degree could receive Pell Grant aid for 12 semesters, or six years. T his change does not affect the measurement of full-time enrollment for the purposes of federal student aid, which is currently 12 semester hours (or the equivalent for non -standard terms).
35 HEA §437(c)(3).
Congressional Research Service
10
link to page 16 link to page 34 Federal Pell Grant Program of the Higher Education Act: Primer
Institutional Role Institutional Role
To be eligible for the HEA Title IV programs, including the Pell Pel Grant program, an IHE must
meet several statutory and regulatory eligibility criteria. For a description of institutional eligibility eligibility requirements, see CRS Report R43159, Institutional Eligibility for Participation in Title IV Student Financial Aid Programs.3536 The IHE may be a public or private nonprofit IHE, a private for-profit (sometimes referred to as proprietary) postsecondary institution, or a
postsecondary vocational institution.
An eligible institution'
An eligible institution’s role in administering the Pell Pel Grant program primarily involves reviewing and verifying information submitted by students on the FAFSA, calculating awards, disbursing awards, adjusting awards to ensure students do not receive more assistance than they
are eligible for, record keeping, and reporting to ED.
An eligible institution calculates a student's Pell ’s Pel Grant disbursement using the award rules. GenerallyGeneral y, institutions credit a student'’s account with the Pell Pel Grant disbursement payment to
meet unpaid tuition, fees, room, and board; any remaining Pell Pel Grant funds are paid directly to
the student to cover other living expenses.
ED makes funds available to schools so that they can disburse Pell Pel Grant awards. In addition, the Pell Pel Grant program pays participating institutions an administrative cost allowanceal owance of $5 per
enrolled recipient.
Description of Pell Grant Recipients and Participation
Participation This section provides descriptive statistics of Pell Pel Grant recipients (numbers and characteristics) and the institutions that they attend. The data may inform discussion regarding the extent to which the program achieves the policy goal of improving access to higher education for financially
financial y needy individuals.
Number of Recipients
The Pell Pel Grant program reaches a significant portion of undergraduates each year. In AY2015-2016, the latest year for which data are available, 39% of all al undergraduates were estimated to have received Pell Pel Grants.3637 Table 2 shows the number of Pell Pel Grant recipients over the most recent five years, from AY2011-2012 to AY2015-2016, as well AY2015-2016 to AY2019-2020, as wel as the annual change and annual percentage change during this time. The number of Pell Pel Grant recipients has declined from almost 9.5 million in AY2011-2012 to over 7.5 million in AY2015-2016. Table B-1 displays Pell Grant over 7.6 mil ion in AY2015-2016 to over 6.7 mil ion in AY2019-2020. Table B-1 displays Pel Grant
36 See also HEA T itles I and IV. 37 CRS analysis of AY2015-2016 data from the National Postsecondary Student Aid Study (NPSAS). A CRS analysis of AY2003-2004, AY2007-2008, and AY2011-2012 NPSAS data shows that the percentage of all undergraduates estimated to have received Pell Grants in each of these academic years was 27%, 28%, and 41%, respectively.
Congressional Research Service
11
link to page 34 Federal Pell Grant Program of the Higher Education Act: Primer
recipients since AY1973-1974. It is important to note that myriad factors,38recipients since AY1973-1974. It is important to note that myriad factors,37 including the labor
market, can affect the number of Pell Pel Grant recipients in any given award year.
|
Award Year |
Pell Grant Recipients |
|
% Change |
|
2011-2012 |
9,444,000 |
136,000 |
1.46% |
|
2012-2013 |
8,959,000 |
(486,000) |
(5.14%) |
|
2013-2014 |
8,663,000 |
(296,000) |
(3.30%) |
|
2014-2015 |
8,316,000 |
(347,000) |
(4.0%) |
|
2015-2016 |
7,660,000 |
(655,000) |
(7.9%) |
Source: U.S. Department of Education, AY2015-2016 Pell Grant End-of-Year Report.
Note: Recipient figures rounded to the nearest thousand. Numbers in parentheses are negative numbers. For a history of Pell Grant award amounts since AY1973-1974, see Table B-1.
Income of Recipients
Since Pell Income of Recipients Since Pel Grant awards are heavily dependent on EFC levels and the complex EFC formula can yield different EFCs for students with similar incomes, there is no absolute income threshold that determines who is eligible or ineligible for a Pell Pel Grant award. Nevertheless, Pell Pel Grant recipients are primarily low-income. In AY2016-2017AY2017-2018, an estimated 95% of Pell Pel Grant recipients had a total family income38income39 at or below $60,000.3940 Independent Pell Pel Grant recipients'’ income is generally general y
lower than their dependent counterparts. As a point of reference, median household income for all al
U.S. households with or without students was $57,230 in 2015 and $59,039 in 2016.40
62,626 in 2017 and $63,179 in 2018.41
It is important to note, however, that a small smal percentage of Pell Pel Grant awards go to mid- and high-
income families. For the most part, these awards are smallersmal er than the average Pell Pel Grant award for all al students and are typicallytypical y provided to dependent students from families whow ho have multiple
students enrolled in postsecondary education at the same time.41
Distribution of Pell Grant Recipients and Funds by Institutional Type
The types of institutions in which Pell Grant recipients enroll may not reflect the overall enrollment patterns of undergraduate students who do not receive Pell 42
38 Such factors include, but are not limited to, (1) amendments to the HEA that affect the federal need analysis calculation and Pell Grant award rules; (2) changes in the maximum grant level specified in annual appropriations bills; (3) trends in enrollment at postsecondary institutions; (4) demographic factors; and (5) macroeconomic and microeconomic variables.
39 T otal family income is defined here as the adjusted gross income (if a tax filer), any taxable income (if not a tax filer), and any non-taxable income.
40 T able 003 of the AY2017-2018 Pell Grant End-of-Year Report. 41 Semega, Jessica, Melissa Kollar, John Creamer, and Abinash Mohanty, U.S. Census Bureau, Current Population Reports, P60-266(RV), Incom e and Poverty in the United States: 2018 , U.S. Government Printing Office, Washington, DC, 2020.
42 According to T able 003 of the AY2017-2018 Pell Grant End-of-Year Report, 4,701 Pell Grant recipients, or 0.1% of the total recipient population, had a family income of $100,000 or more. In cases where the family has more t han one student enrolled in or accepted to college for the award year, the EFC is reduced to account for the number of students expected to be enrolled in the upcoming year.
Congressional Research Service
12
link to page 17 link to page 17 link to page 17 Federal Pell Grant Program of the Higher Education Act: Primer
Distribution of Pell Grant Recipients and Funds by Institutional Type The types of institutions in which Pel Grant recipients enroll may not reflect the overal enrollment patterns of undergraduate students who do not receive Pel Grants. For example, a larger proportion of Pell Pel Grant recipients attend private for-profit institutions than do students not receiving Pell GrantsPel Grants. Table 3 shows the AY2015-2016 enrollment distribution by institutional
sector of undergraduates who do not receive a Pell Pel Grant and undergraduates who do receive Pell Pel Grants. Each group is disaggregated for dependent and independent students. For both independent and dependent students, the share of Pell Pel Grant recipients attending private-for profit institutions was more than double the share of undergraduate students who do not receive Pell Pel Grants attending such institutions. One possible explanation for this disparity is that for-profit institutions may target marketing to low-income students.4243 Most undergraduates, whether receiving Pell
receiving Pel Grants or not, attend public four-year or public two-year institutions. For example, over half of independent Pell Pel Grant recipients attend either public four-year (22.0%) or public
two-year (32.5%) institutions.
Table 3. Estimated Distribution of Pell Grant Recipients and Undergraduates not
Receiving Pell Grants by Sector of Enrolling Institution, AY2015-2016
Dependent Undergraduates
Independent Undergraduates
% Not
% Not
Type and Control of
% Pell Grant
Receiving Pell
% Pell Grant
Receiving Pell
Institution
Recipients
Grant
Recipients
Grant
Public four-year
40.5
40.2
22.0
22.9
Private nonprofit four-year
14.1
17.6
11.8
11.0
Public two-year
27.7
29.0
32.5
49.2
Private for-profita
6.4
2.4
21.6
8.3
Other or more than one institutionb
11.2
10.9
12.1
8.6
Total
100.0
100.0
100.0
100.0
Source: CRS estimates from 2015-2016 NPSAS. Notes: Due to rounding, sum of column entries Receiving Pell Grants by Sector of Enrolling Institution, AY2015-2016
|
Dependent Undergraduates |
Independent Undergraduates |
|||
|
Type and Control of Institution |
% Pell Grant Recipients |
% Not Receiving Pell Grant |
% Pell Grant Recipients |
% Not Receiving Pell Grant |
|
Public four-year |
40.5 |
40.2 |
22.0 |
22.9 |
|
Private nonprofit four-year |
14.1 |
17.6 |
11.8 |
11.0 |
|
Public two-year |
27.7 |
29.0 |
32.5 |
49.2 |
|
6.4 |
2.4 |
21.6 |
8.3 |
|
11.2 |
10.9 |
12.1 |
8.6 |
|
Total |
100.0 |
100.0 |
100.0 |
100.0 |
Source: CRS estimates from 2015-2016 NPSAS.
Notes: Due to rounding, sum of column entries may not equal column totals.
a. may not equal column totals. a. Private for-profit institutions are sometimes referred referred to as proprietary institutions.
b. b. The other or more than one institution category is for students who attended an institution that is not a
public four-year, private nonprofit four-year, public two-year, or private for-profit institution and for students who attended more than one eligible institution during the year.
Role of the Pell Grant
The Pell Pel Grant is intended to function as the foundation of federal need-based aid for financially financial y needy undergraduates. As described earlier, other financial aid received by a student is not taken
43 “How For-Profit Colleges Sell ‘Risky Education’ T o T he Most Vulnerable,” NPR, March 27, 2017; Elizabeth A. Harris, “New York City Consumer Agency Investigating Four For-Profit Colleges,” The New York Times, April 2, 2015; and Caroline Simon, “For-Profit Colleges’ T eachable Moment: ‘T errible Outcomes Are Very Profitable’,” Forbes, March 19, 2018.
Congressional Research Service
13
link to page 19 Federal Pell Grant Program of the Higher Education Act: Primer
into account in determining a student’s Pel into account in determining a student's Pell Grant. This section explores the role Pell Pel Grants and
other sources of aid play in helping students meet postsecondary costs.
Purchasing Power
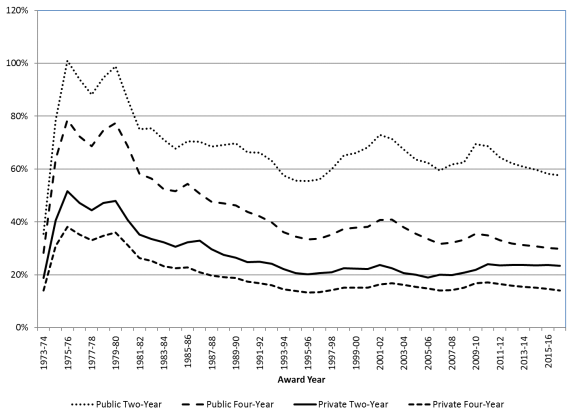
The total maximum Pell Pel Grant, available to students with a zero EFC who enroll on a full-time, full-year basis, is often used as a gauge of the Pell Pel Grant program'’s level of support in each year. Figure 3 compares the total maximum grant to average undergraduate tuition, fees, room, and board charges (base educational costs) at public two-year, public four-year, private two-year, and
private four-year institutions between AY1973-1974 and AY2016-2017AY2019-2020. It is evident that the maximum was at its peak relative to these average charges during the 1970s. Since the 1990s, the extent to which the total maximum Pell Pel Grant covers average base educational costs has been variable; however, despite some increases, the total maximum Pell Pel Grant has lost ground relative to average base educational costs at public four-year institutions. In AY2016-2017AY2019-2020, the total maximum grant ($5,8156,195) covered approximately 5856% of the average base educational costs at
public two-year institutions, 3029% at public four-year institutions, 23% at private two-year
institutions, and 14% at private four-year institutions.43
It is also important to note that in all al sectors of higher education, published tuition, fees, and room and board have consistently risen more rapidly than average prices in the economy for a number of years. An analysis of the purchasing power of the Pell Pel Grant maximum award, therefore, could also include an examination of why published prices at institutions of higher education have risen
at such a rapid rate and what is the role of federal student aid, including Pell Pel Grants, in
contributing to rising published prices.44
45
45 For more information on college prices and potential explanations for escalating college prices, see CRS Report R43692, Overview of the Relationship between Federal Student Aid and Increases in College Prices.
Congressional Research Service
15
link to page 20 link to page 20 link to page 21 link to page 21 link to page 21 link to page 21 Federal Pell Grant Program of the Higher Education Act: Primer
Receipt of Pell Grants and Other Aid The Pel Receipt of Pell Grants and Other Aid
The Pell Grant is intended to be the foundation of federal need-based student aid from Title IV of
the HEA.4546 In AY2015-2016, an estimated 16% of Pell Pel Grant recipients relied on a Pell Pel Grant as their only source of aid from all al sources, and 34% of Pell Pel Grant recipients did not receive other HEA
HEA Title IV aid funds.46
Most Pell 47
Most Pel Grant recipients (84%) participate in other student aid programs. For those Pell Pel Grant recipients with a zero EFC, Table 4 shows estimates of the average percentage of cost of attendance (COA) covered by their Pell Pel Grant award, their loans from all al sources, and their total aid package in AY2015-2016, by total family income. This table allowsal ows for examination of the extent to which Pell Grants and other aid helped Pell Pel Grant recipients with a zero EFC meet their
COA.4748 Table 4 shows, for example, that among all Pell al Pel Grant recipients, Pell Pel Grant aid covered, on average, 27.1% of the COA and all al loan sources covered, on average, an additional 20.3% of the COA for these recipients. For Pell Pel Grant recipients, total aid from all al sources supplies less
than two-thirds (62.9%) of the COA, on average.
Table 4. Pell Grant Aid, Student Loans, and Total Aid from All Sources as Average
Percentages of Cost of Attendance for Undergraduate Students Who Have a Zero
EFC and Received a Pell Grant, by Total Family Family Income (2014)
(AY2015-2016)
Pell Grant
All Loansa as
Total Aidb
Aid as a
a
as a
Percentage
Percentage
Percentage
of COA
of COA
of COA
Al Zero EFC Pel (AY2015-2016)
|
Pell Grant Aid as a Percentage of COA |
All Loansa as a Percentage of COA |
Total Aidb as a Percentage of COA |
|
|
All Zero EFC Pell Grant Recipients |
27.1% |
20.3% |
62.9% |
|
Total Family Income (Dependent)c |
|||
|
Less than $20,000 |
29.7% |
15.0% |
63.8% |
|
$20,000 to $29,999 |
29.6% |
15.9% |
66.6% |
|
$30,000 to $49,999 |
27.7% |
14.7% |
67.3% |
|
$50,000 or more |
NR |
NR |
NR |
|
Total Family Income (Independent)d |
|||
|
Less than $20,000 |
25.6% |
23.6% |
61.7% |
|
$20,000 to $29,999 |
25.9% |
24.6% |
62.2% |
|
$30,000 to $49,999 |
25.8% |
22.1% |
61.8% |
|
$50,000 or more |
25.5% |
24.8% |
62.2% |
Source: CRS estimates Grant Recipients
27.1%
20.3%
62.9%
Total Family Income (Dependent)c
Less than $20,000
29.7%
15.0%
63.8%
$20,000 to $29,999
29.6%
15.9%
66.6%
$30,000 to $49,999
27.7%
14.7%
67.3%
$50,000 or more
NR
NR
NR
Total Family Income (Independent)d
Less than $20,000
25.6%
23.6%
61.7%
$20,000 to $29,999
25.9%
24.6%
62.2%
$30,000 to $49,999
25.8%
22.1%
61.8%
$50,000 or more
25.5%
24.8%
62.2%
Source: CRS estimates from 2015-2016 NPSAS. from 2015-2016 NPSAS.
Notes: NR means reporting standards were not met. COA means cost of attendance.
a. All loans column includes federal loans to students, state loans, institutional loans, Direct
46 Federal need-based student aid from the HEA is defined here as Pell Grants, Federal Supplemental Educational Opportunity Grants (FSEOG), Federal Work -Study earnings, and Direct Subsidized Loans.
47 CRS estimates from 2015-2016 NPSAS. 48 T he cost of attendance is the sum of tuition and fees and non-tuition expenses for students who attended only one institution. T he cost is adjusted to accommodate private alternative loans that may exceed total aid ( federal, state, institutional, and private financial aid received by the student in the form of grants, loans, work-study assistance, or other types of aid).
Congressional Research Service
16
link to page 9 link to page 32 link to page 36 Federal Pell Grant Program of the Higher Education Act: Primer
a. Al loans column includes federal loans to students, state loans, institutional loans, Direct PLUS loans to
PLUS loans to parents, and other private commercial or alternative loans. Data include loan amounts for Pell Grant recipients Pel Grant recipients who did not borrow as well as wel as those who did borrow.
b.
b. Total aid includes all al federal, state, institutional, and private financial aid received by the student in theth e form
of grants, loans, work-study assistance, or other types of aid.
c.
c. Includes income of dependent student and parents.
d. d. Includes income of independent student and spouse when applicable.
Program Funding
This section of the report reviews the latest Pell Pel Grant program funding trends and reviews Pell Pel Grant funding sources and procedures. As a quasi entitlement that makes grant payments to eligible students who apply for aid and enroll in eligible programs notwithstanding the appropriation level available in any one year, the program may operate with a surplus or shortfall of discretionary funding. Funding provided for the Pell Grant program is exempt from sequestration, pursuant to provisions included in Section 255(h) of the Balanced Budget and Emergency Deficit Control Act of 1985 (BBEDCA, Title II of P.L. 99-177, as amended). Given the somewhat unique funding characteristics of this program, this section of the report explores funding concepts, funding levels, and insight into how shortfalls and surpluses of discretionary funding in the program have been addressed.
The Pell The program has somewhat unique funding characteristics because of the mix of discretionary and mandatory funding, the 2006 budget scoring rule, and its
ability to carry over a surplus or shortfal of discretionary funding to subsequent fiscal years. This
section explores these concepts and the effect that they have on appropriations acts.
The Pel Grant program since approximately FY2008 has been funded through three funding streams. A discretionary appropriation is the primary source of funds for the discretionary award amounts. There are two mandatory funding streams. The smallersmal er mandatory funding stream augments the discretionary appropriations to fund the discretionary award level. Therefore, a portion of the discretionary award level is funded through mandatory appropriations. A larger mandatory appropriation funds the mandatory add-on award amounts. Recent and historical
discretionary maximum award levels and mandatory add-on award levels are shown inin Table 1 and and Appendix A, respectively. Appendix C presents the three distinct funding streams and
enacting legislation since FY2008.
Funding provided for the Pel Grant program is exempt from sequestration, pursuant to provisions included in Section 255(h) of the Balanced Budget and Emergency Deficit Control Act of 1985
(BBEDCA, Title II of P.L. 99-177, as amended).
Role of Discretionary Funding Role of Discretionary Funding
Annual discretionary appropriation billsappropriations bil s provide the largest portion of funding for the Pell Pel Grant program, and this funding typicallytypical y remains available for use for two fiscal years. An annual appropriation is usuallyusual y available for obligation on October 1 of the fiscal year for which the appropriation is made and remains available for obligation through September 30 of the following fiscal year.4849 Thus, while FY2018FY2021 funds are provided withfor the purpose of supporting awards made
from July 1, 20182021, to June 30, 20192022, these funds are available for obligation from October 1, 20172020, to September 30, 20192022, and may support multiple award years. This multiyear availability allowsal ows the discretionary appropriation to operate at a surplus or shortfall shortfal in any given year. In addition, this multiyear availability al ows the program to operate as a quasi entitlement, making grant payments to eligible students who apply for aid and enroll in eligible programs
notwithstanding the appropriation level available in any onein any given year. As mentioned earlier, annual discretionary appropriation billsbil s also establish the base discretionary maximum grant for each eac h applicable award year.
49 T he annual appropriation for the Pell Grant program is available immediately upon enactment at any point on or after October 1. In the event the annual appropriation is not enacted at the beginning of the fiscal year, a continuing resolution typically provides prorated funding for the program until an appropriation measure is enacted.
Congressional Research Service
17
link to page 23 link to page 23 link to page 39 Federal Pell Grant Program of the Higher Education Act: Primer
Role of Mandatory Funding
Specified Role of Mandatory Funding
Specified Mandatory Appropriations to Augment Discretionary Funding
The SAFRA Act (enacted as part of the Health Care and Education Reconciliation Act of 2010; P.L. 111-152), the FY2011 Continuing Appropriations Act (P.L. 112-10), the Budget Control Act
of FY2011 (P.L. 112-25), and most recently ), the FY2012 Consolidated Appropriations Act (P.L. 112-74), and most recently the FUTURE Act (P.L. 116-91) amended the HEA to provide specified mandatory appropriations for the Pell Pel Grant program to augment current and future discretionary appropriations. That is, these funds, while mandatory from a budgetary perspective, can be used to pay for costs in the program for which annual discretionary appropriations are typically typical y provided. The concept of providing advance mandatory funding to augment or supplant
discretionary funding in the program is relatively new. Prior to FY2007, mandatory funding had been infrequently provided for the Pell Pel Grant program, but usuallyusual y to supplement discretionary
funding to pay for accumulated funding shortfalls.49
shortfal s.50
Permanent, Indefinite Mandatory Appropriations for the Add-On Award
The SAFRA Act also established permanent, indefinite mandatory appropriations for the program to provide for the mandatory add-on award amount in FY2010 and beyond.5051 Although the mandatory appropriations that fund add-on award amounts are available permanently for such
sums as necessary, the amount provided for each year will wil be determined based on actual costs associated with the applicable add-on amount.
Summary of Recent and Projected Funding
Table 5 provides a summary of recent and projected Pell Pel Grant program funding from FY2012 through FY2021.51FY2017
through FY2026.52 A distinction is made between discretionary appropriations, mandatory appropriations provided to augment discretionary appropriations, and mandatory appropriations provided to fund add-on award amounts. Table 5 also displays the mandatory appropriations that have been provided through FY2021.
FY2026. From a budgetary perspective, these recent mandatory appropriations have been offset largely by enacted provisions that were estimated to have resulted in savings from the federal student loan
programs, which are classified as mandatory programs. AdditionallyAdditional y, some of the mandatory appropriations provided for the program in the FY2011 Continuing Appropriations Act and FY2012 Consolidated Appropriations Act were offset by enacted provisions that resulted in mandatory savings in other aspects of the Pel Grant program.53
50 For example, mandatory funding in the amount of $4.3 billion was provided in P.L. 109-149 to pay exclusively for the accumulated funding shortfall through AY2005 -2006. 51 Prior to the SAFRA Act, the College Cost Reduction and Access Act of 2007 (CCRAA) provided annual specified mandatory appropriation levels from FY2008 to FY2017 to fund annual add-on award amounts. T he SAFRA Act eliminated the specified mandatory appropriation levels for FY2010 and all subsequent years and replaced these levels with indefinite mandatory appropriations, while revising the add-on award amounts.
52 Table D-1 in this report provides a more comprehensive history of the discretionary funding levels in the program since FY1973.
53 Since the enactment of the SAFRA Act, legislative changes that affect t he eligibility and award rulesmandatory savings in other aspects of the Pell Grant program.52
Mandatory appropriations that will be necessary to fully fund the add-on award amount are available are measured separately on the budget ledger between discretionary and mandatory funding. T hat is, a distinction is made between savings or additional costs associated with funding the discretionary base maximum award and the mandatory add-on award when changes to the program are enacted. For example, eliminating eligibility for a
Congressional Research Service
18
link to page 23 link to page 23 link to page 23 link to page 23 link to page 36 Federal Pell Grant Program of the Higher Education Act: Primer
Mandatory appropriations that wil be necessary to fully fund the add-on award amount are available permanently, but the specific amount required in each year cannot be reported until the add-on amount is determined and all al funds are disbursed to eligible students. ED does, however, estimate the amount of mandatory appropriations provided required to fund add-on award
amounts for the current and subsequent fiscal years.
|
Funds Supporting Discretionary Award Amounts |
Funds Supporting Mandatory Add-On Award Amounts |
Total Funding |
|||
|
Discretionary Appropriation |
Mandatory Appropriation |
Subtotal |
Mandatory Appropriation |
|
|
2012 |
22,824 |
13,795 |
36,619 |
|
41,569 |
|
2013 |
22,778 |
7,587 |
30,365 |
|
35,219 |
|
2014 |
22,778 |
588 |
23,366 |
|
28,201 |
|
2015 |
22,475 |
0 |
22,475 |
|
27,628 |
|
2016 |
22,475 |
0 |
22,475 |
|
27,316 |
|
2017 |
|
|
23,796 |
|
29,476 |
|
2018 |
22,475 |
|
23,809 |
|
29,682 |
|
2019 |
|
|
23,845 |
SSAN |
TBD |
|
2020 |
TBD |
1,430 |
TBD |
SSAN |
TBD |
|
2021 |
TBD |
|
TBD |
SSAN |
TBD |
Source: CRS analysis of the HEA, as amended, President's budget FY2016-FY2019, and respective FY2017 to FY2026)
(dol ars in mil ions)
Funds Supporting
Funds Supporting Discretionary
Mandatory Add-On
Award Amounts
Award Amounts
Fiscal
Discretionary
Mandatory
Mandatory
Total
Yeara
Appropriationb
Appropriation
Subtotal
Appropriationc
Funding
2017
22,475
1,320
23,795
5,680
29,475
2018
22,475
1,334
23,809
5,997
29,806
2019
22,475
1,370
23,845
5,388
29,233
2020
22,475
1,405
23,880
5,571
29,451
2021
22,475
1,142
23,617
5,412
29,029
2022
TBD
1,170
TBD
SSAN
TBD
2023
TBD
1,170
TBD
SSAN
TBD
2024
TBD
1,170
TBD
SSAN
TBD
2025
TBD
1,170
TBD
SSAN
TBD
2026
TBD
1,170d
TBD
SSAN
TBD
Source: CRS analysis of the HEA, as amended, President’s budget FY2022, and respective appropriations measures.
Notes: Totals may not add due to rounding;
TBD = to be determined;
SSAN = Such sums as necessary. In effect, this means the amount of mandatory appropriations that will wil be necessary to fullyful y fund the add-on award amount specified in the HEA for a given year. In other words, mandatory funding has been available to support the add-on amount beginning in FY2010 onward permanently, but the amount required in each year is indefinite and cannot be reported until the add-on amount is determined and all al funds are disbursed to eligible students.
For the specific amounts provided and rescinded by enacting legislation since FY2008, see Table C-1.
a. The fiscal year in this table represents the first year the funds appropriated in each column are available for
use. Most funds are available for two fiscal years.
b. This is the amount of mandatory appropriations required to increase the discretionary base maximum grant by $690 in AY2012-2013, as estimated in the President's FY2016 budget.
c. This is the
b. This amount reflects the annual discretionary appropriation level and excludes any rescission of the Pel
Grant program cumulative surplus.
c. This is the estimated amount of mandatory appropriations required to increase the discretionary base maximum grant by $785 in AY2013-2014, as estimated in the President's FY2016 budget.
d. This is the amount of mandatory appropriations required to increase the discretionary base maximum grant by $870 in AY2014-2015, as estimated in the President's FY2019 budget.
e. This is the amount of mandatory appropriations required to increase the discretionary base maximum grant by $915 in AY2015-2016, as estimated in the President's FY2019 budget.
f. This is the amount of mandatory appropriations required to increase the discretionary base maximum grant by $965 in AY2016-2017, as estimated in the President's FY2019 budget.
g. This amount reflects the annual discretionary appropriation level and excludes any rescission of the Pell Grant program cumulative surplus.
h. This amount reflects a $254 million rescission enacted by the Consolidated Appropriations Act, 2017 (P.L. 115-31).
i. This is the amount of mandatory appropriations required to increase the discretionary base maximum grant by $1,060 in AY2017-2018, as estimated in the President's FY2019 budget.
j. This amount reflects a $48 million rescission enacted by the Consolidated Appropriations Act, 2018 (P.L. 115-141).
k. This is the amount of mandatory appropriations required to increase the discretionary base maximum grant by $1,060 in AY2018-2019, as estimated in the President's FY2019 budget.
l. This amount reflects a $39 million rescission enacted by the Department of Defense and Labor, Health and Human Services, and Education Appropriations Act, 2019 and Continuing Appropriations Act, 2019 (P.L. 115-245).
m. Additional annual mandatory appropriations in the amount of $1,145,000,000 are also provided for each succeeding year beyond FY2021.
base
maximum grant by $1,060 in the fiscal year, as estimated in the President’s FY2022 budget.
d. Additional annual mandatory appropriations in the amount of $1,170,000,000 are also provided for each
succeeding year beyond FY2026.
student to receive two scheduled Pell Grant awards in one award year resulted in savings associated with both the discretionary base maximum award and the mandatory add-on award. In general, savings associated with the mandatory award was redirected back to the program as specified mandatory appropriations for future use in specified years.
Congressional Research Service
19
link to page 25 Federal Pell Grant Program of the Higher Education Act: Primer
Discretionary Funding Shortfalls and Surpluses The Pel Discretionary Funding Shortfalls and Surpluses
The Pell Grant program is often referred to as a quasi-entitlement and has for the most partin some respects been
been operated as an appropriated entitlement. An appropriated entitlement is a program that receives mandatory funding in the annual appropriations acts, but the level of spending is not controlled through the annual appropriations process.5354 Instead, the level of mandatory spending for appropriated entitlements, like other entitlements, is based on the benefit and eligibility criteria established in law, and the amount provided in appropriations acts is based on meeting this
projected level. The Pell Pel Grant program is not an entitlement because the program is primarily funded through discretionary appropriations. In addition in the past, statutory benefit and eligibility eligibility criteria were adjusted so that spending would not exceed appropriations. FinallyFinal y, annual Pell Pel Grant discretionary appropriations are determined on the basis of estimates of program costs
and other policy considerations.
To the extent that the annual appropriation may be higher or lower than actual program costs, the program may operate at a surplus or shortfallshortfal . The surplus or shortfall shortfal may accumulate over more than one year. The HEA requires that the Secretary of Education, when shehe has determined that the
appropriated funds are insufficient to satisfy all Pell al Pel Grant entitlements,5455 notify each chamber of Congress of the funding shortfallshortfal , identifying how much more funding is needed to meet those entitlements. The Secretary can respond to a shortfall in Pell shortfal in Pel Grant funding by allocatingal ocating funds from the most recently enacted appropriation to pay for obligations incurred in previous award years.5556 For example, although the FY2019 appropriation is expected to fund award year 2019-2020 program costs, the appropriation may fund award year 2018-2019 costs since obligations for
these costs occur in FY2019. This permits ED to use funds from multiple fiscal years' ’
appropriations to meet one award year'’s cost.
The misalignment between estimated program costs (appropriations) and actual expenditures is often related to economic and statutory changes. When the general economy weakens,
postsecondary enrollment often increases and thus Pell Pel Grant participation and cost increases.
Table 6 provides a 105-year history of funding of estimated shortfall estimated shortfal or surplus levels, funding for the discretionary award amounts, and estimated expenditures (Appendix D provides data from FY1973 to FY2018FY2021). Although discretionary award amounts are funded by discretionary and mandatory appropriations, the surplus or shortfall shortfal is accounted for using only discretionary funding. The annual funding shortfall shortfal or surplus differs from the cumulative shortfall shortfal or surplus,
which may accumulate over multiple award years.5657 It is also important to note that Congress may have provided a reduced appropriation level in a given year when a funding surplus was available for use from the previous year. Conversely, Congress may have provided additional appropriations in a given year to pay for an estimated funding shortfall from the previous year.
Table 6 shows a high cumulative shortfall of $9.569 billion at the end of FY2010 and high cumulative surplus of $11.082 billion at the end of FY2013. The FY2010 cumulative shortfall was transformed into a surplus by a complicated mix of increased funding levels that exceeded $30 billion annually and declining expenditures. The FY2013 cumulative surplus of $11.082 billion has decreased to an estimated $7.410 billion surplus at the end of FY2018. Since FY2014, the annual funding has hovered near $23 billion despite generally higher expenditures. The two subsequent sections of the report describe the policy implications of shortfalls
54 For more information about appropriated entitlements, see CRS Report RS20129, Entitlements and Appropriated Entitlem ents in the Federal Budget Process. 55 T he authorizing statue speaks of entitlements when it describes the award determined for a student based on the published award schedule.
56 T his response to the shortfall is only feasible if ED determines enough funds are available from the most recently enacted appropriation to meet obligations from multiple award years. A series of le gal opinions at ED and other agencies in the 1990s provides the basis for the authority to use funds in an annual appropriation for multiple award years. In general, absent specific language in an annual appropriations measure limiting funds to a specific award year or purpose, the Secretary may use such funds for any award year during the period of availability specified in an appropriations measure. 57 In general, the annual surplus or shortfall is a measure of the difference between one year’s appropriation, which is typically provided for a particular award year, and the estimated expenditures for that particular award year. T he cumulative surplus is a measure that, in addition to including the annual surplus or shortfall, takes into account the prior years’ surplus or shortfall amount.
Congressional Research Service
20
link to page 25 link to page 25 link to page 25 link to page 25 link to page 25 link to page 25 link to page 25 link to page 39 Federal Pell Grant Program of the Higher Education Act: Primer
appropriations in a given year to pay for an estimated cumulative funding shortfal from the
previous years.
Table 6 shows that the cumulative surplus over the last five years has exceeded $9.0 bil ion,
which is approximately 40% of the annual funding made available for the discretionary award. The two subsequent sections of the report describe the policy implications of and surpluses and
shortfal s and surpluses and the measures to address them.
Table 6. Estimated Annual and Cumulative Discretionary Funding Shortfalls in the Pell Grant Program, FY2009-FY2018
(dollars in millions)
|
Fiscal Year |
Award Year |
|
Estimated Total Expendituresb |
Annual Surplus or (Shortfall) |
Cumulative Surplus or (Shortfall) |
|
2009 |
2009-2010 |
|
26,844 |
6,084 |
3,427 |
|
2010 |
2010-2011 |
17,495 |
30,491 |
(12,996) |
(9,569) |
|
2011 |
2011-2012 |
|
28,796 |
7,660 |
(1,909) |
|
2012 |
2012-2013 |
|
27,512 |
9,107 |
7,198 |
|
2013 |
2013-2014 |
|
26,481 |
3,884 |
11,082 |
|
2014 |
2014-2015 |
|
25,320 |
(1,954) |
9,128 |
|
2015 |
2015-2016 |
22,475 |
23,361 |
(886) |
8,242 |
|
2016 |
2016-2017 |
22,475 |
21,788 |
687 |
8,929 |
|
2017 |
2017-2018 |
|
23,377 |
(892) |
8,037 |
|
2018 |
2018-2019 |
|
24,436 |
(627) |
7,410 |
Sources: Congressional Budget Office, Pell Grant Program—CBO'S April 2018
the Pell Grant Program, FY2017-FY2021
(dol ars in mil ions)
Annual
Funding for
Discretionary
Estimated
Cumulative
Award
Total
Annual Surplus
Surplus or
Fiscal Year
Award Year
Amountsa
Expendituresb
or (Shortfall)
(Shortfall)
2017
2017-2018
23,795
22,773
1,022
9,007c
2018
2018-2019
23,809
22,692
1,117
10,124
2019
2019-2020
23,845
22,746
1,099
10,623d
2020
2020-2021
23,880
21,483
2,397
12,520e
2021
2021-2022
23,618
23,654
(36)
11,983f
Sources: Congressional Budget Office, Pel Grant Program—CBO’S February 2021 Baseline. Baseline.
Notes: Numbers in parentheses are negative numbers. For a history of surpluses and shortfalls in the Pell and shortfal s in the Pel Grant program since AY1973-1974, seesee Table D-1.
a. This number includes annual discretionary appropriations and may include additional mandatory and discretionary funding.
b. All estimates of expenditures are subject to change.
c. Includes approximately $15.6 billion in supplemental discretionary appropriations provided in the American Recovery and Reinvestment Act (ARRA; P.L. 111-5).
d. Includes $13.5 billion in mandatory appropriations that were provided in the SAFRA Act for general use in the program through FY2012 and $22,956 million in discretionary appropriations provided in the FY2011 Continuing Appropriations Act.
e. The funding sources are the FY2011 Continuing Appropriations Act that provided $3,183 million in mandatory appropriations for general use in the program for FY2012; the Budget Control Act of 2011 (P.L. 112-25) that provided $10 billion in mandatory appropriations for general use in the program for FY2012; and the FY2012 Consolidated Appropriations Act (P.L. 112-74) that provided $22,824 million in discretionary appropriations for FY2012 and $612 million in mandatory appropriations for general use in the program for FY2012.
f. The funding sources are the Budget Control Act of 2011 (P.L. 112-25) that provided $7 billion in mandatory appropriations for general use in the program for FY2013; and the FY2012 Consolidated Appropriations Act (P.L. 112-74) that provided $587 million in mandatory appropriations for general use in the program for FY2013.
g. The funding sources are the FY2012 Consolidated Appropriations Act (P.L. 112-74) that provided $588 million in mandatory appropriations for general use in the program for FY2014; and the Consolidated Appropriations Act, 2014 (P.L. 113-76) that provided $22,778 million in discretionary appropriations for FY2014.
h. The funding sources are the FY2011 Continuing Appropriations Act that provided $1.060 million in mandatory appropriations; the FY2012 Consolidated Appropriations Act (P.L. 112-74) that provided $514 million in mandatory appropriations; and the Consolidated Appropriations Act, 2017 (P.L. 115-31) that provided $22.475 million in discretionary appropriations, rescinded $1.310 million of the surplus, and reduced the cumulative mandatory appropriation of $1.574 million from the FY2011 Continuing Appropriations Act and the FY2012 Consolidated Appropriations Act to $1.320 million.
i. The funding sources are the FY2011 Continuing Appropriations Act that provided $1.125 million in mandatory appropriations; the FY2012 Consolidated Appropriations Act (P.L. 112-74) that provided $257 million in mandatory appropriations; and the Consolidated Appropriations Act, 2018 (P.L. 115-141) that provided $22.475 million in discretionary appropriations and reduced the cumulative mandatory appropriation of $1.382 million from the FY2011 Continuing Appropriations Act and the FY2012 Consolidated Appropriations Act to $1.334 million.
Policy Implications and Measures to Address Funding Shortfalls
For the most part, funding shortfalls in the Pell Grant program have been recognized as common occurrences. Persistent or high funding shortfalls, as in FY2010, may be viewed as fiscally irresponsible. In essence when there is a shortfall, the program is in debt, and eventually the debt must be paid. The higher the debt level, the more difficult it is to resolve.
Generally speaking, with input from the Administration and other stakeholders, Congress adopts legislation that controls spending across the federal government and for specific programs.57 Through the budget resolution process, a 302(b) allocation
discretionary funding. For a list of the applicable legislation and amounts, see Table C-1.
b. Al estimates of expenditures are subject to change. c. The Consolidated Appropriations Act, 2017 (P.L. 115-31) rescinded $1.310 bil ion of the cumulative surplus. d. The Department of Defense and Labor, Health and Human Services, and Education Appropriations Act,
2019 and Continuing Appropriations Act, 2019 (P.L. 115-245) rescinded $600 mil ion of the cumulative surplus.
e. The Further Consolidated Appropriations Act, 2020 (P.L. 116-94) rescinded $500 mil ion from the
cumulative surplus.
f.
The Consolidated Appropriations Act, 2021 rescinded $500 mil ion from the cumulative surplus.
Policy Implications and Measures to Address Funding Surpluses The policy implications of a funding surplus are very different from those of a shortfal . An increasing or high cumulative surplus may be viewed as presenting a potential opportunity. The surplus may be viewed as representing a pot of available funding. The surplus may be invested back into the Pel Grant program or it may be used to pursue other policy priorities. General y
speaking, spending across the federal government and for specific programs is controlled by
legislation adopted by Congress with input from the Administration and other stakeholders.58
58 For more information on the budget and appropriations process, see CRS Report R40472, The Budget Resolution and Spending Legislation.
Congressional Research Service
21
Federal Pell Grant Program of the Higher Education Act: Primer
Pursuing Other Policy Priorities
The surplus may be used to fund or increase funding for other programs or to reduce a budget deficit. Al or a portion of the surplus may be rescinded in an appropriations act. For example, the Consolidated Appropriations Act, 2017 (P.L. 115-31) included a rescission of $1.3 bil ion from
the Pel Grant program surplus. The rescission offsets the cost of appropriations in the act.
Expanding the Pell Grant Program
Alternatively, there are several approaches for investing the surplus into the program or
expanding the program.
Appropriations levels and statutory provisions may be maintained under the
assumption that Pel Grant program costs would eventual y use the surplus. For example as the U.S. population grows, postsecondary enrollment and Pel Grant participation may grow.
Award levels for Pel Grant recipients may be increased in order to increase the
size of a Pel Grant. For example, the discretionary base maximum award was increased from $4,860 in FY2009-FY2017 to $5,035 in FY2018.
Student eligibility for Pel Grants may be expanded. For example, increasing the
discretionary base maximum award from $4,860 in FY2009-FY2017 to $5,035 in FY2018 also increases the number of students who are eligible.
Statutory provisions that establish Pel Grant award rules may be modified to
increase the amount of funds that some students may receive. For example, year-round Pel Grants were reauthorized beginning in AY2017-2018.
Statutory provisions that establish the calculation of EFC may be modified to
increase the numbers of students eligible for Pel Grants and other HEA Title IV need-based financial aid.
Statutory provisions that establish student eligibility for any HEA Title IV aid
programs may be amended to increase eligibility.
Enacted legislation that expands the Pel Grant program results in increased program costs. Because of the combination of discretionary appropriations for the discretionary award and mandatory appropriations for the mandatory add-on award, a program expansion is likely to increase both the discretionary and mandatory (direct) spending requirements. Such expansions
may be enacted through authorizing or appropriations acts.
Program Reauthorization
The Pel Grant program may be expanded in a reauthorization of the Higher Education Act such that the mandatory spending for the program is increased. The Statutory Pay-As-You-Go Act of 2010 (PAYGO; P.L. 111-139) establishes a process that is intended to prevent new direct spending
and revenue laws from increasing the deficit.59 In effect, PAYGO requires that any legislation projected to increase direct spending or reduce revenues must be offset by equivalent amounts of direct spending cuts, revenue increases, or a combination of the two, over a 5-year and 10-year
59 For more information on PAYGO, see CRS Report R41157, The Statutory Pay-As-You-Go Act of 2010: Summary and Legislative History; CBO, The Statutory Pay-As-You Go Act and the Role of the Congress, August 18, 2020, https://www.cbo.gov/system/files/2020-08/56506-S-PAYGO.pdf
Congressional Research Service
22
Federal Pell Grant Program of the Higher Education Act: Primer
budget period.60 Therefore, it is general y expected that any increase in Pel Grant direct spending for each of the applicable budget periods in a reauthorization would be offset. The offset may but
need not necessarily occur in the same law as the increase.61
Annual Appropriations Act Measures
In recent years, several Pel Grant program expansions have been enacted in annual
appropriations acts. Through the budget resolution process, a 302(b) al ocation is established for each of the 12 appropriations billsbil s. These allocationsal ocations, referred to as 302(b) subdivisions, establish the maximum discretionary amount that can be spent through each billbil . Therefore generallygeneral y but with exceptions, individual program-level discretionary appropriations within the annual Departments of Labor, Health and Human Services, and Education, and Related Agencies appropriations bill bil must be balanced within its established 302(b) allocational ocation. In other words,
increased discretionary appropriations for one program may coincide with decreased
discretionary appropriations for one or more other programs. Resolving a Pell Grant program shortfall
In accordance with budget enforcement mechanisms, substantive changes to or restrictions on mandatory spending in appropriations laws are scored against the 302(b) discretionary al ocations that apply to the budget year in appropriations bil s. Provisions that make substantive changes to mandatory spending programs are cal ed changes in mandatory program spending (CHIMPS). In other words, CHIMPS are scored as discretionary spending that along with al of the other discretionary spending in the appropriations bil must not exceed the 302(b) al ocations. (Those
provisions also might be under the purview of statutory PAYGO if they made substantive changes
or modifications to mandatory spending in the years beyond the budget year.)
In response to these budget enforcement mechanisms for appropriations laws, recent substantive Pel Grant program changes that increased the estimated mandatory spending for the add-on award have been offset by a decrease in the Pel Grant mandatory appropriations to augment discretionary funding in the budget year of the appropriations law.62 For example, the Consolidated Appropriations Act, 2017 (P.L. 115-31) enacted year-round Pel Grants, increasing estimated direct spending for the mandatory add-on award in FY2017 and every year thereafter.
As a consequence, P.L. 115-31 rescinded $254 mil ion of the FY2017 specified mandatory appropriations to augment discretionary funding in order to offset the estimated increase in the FY2017 mandatory spending for the add-on award. Also for example, each of the FY2018-FY2021 appropriations acts increased the discretionary base maximum award level. General y speaking, an increase in the discretionary base maximum award level increases program
eligibility and results in an increase in direct spending for the mandatory add-on award. As a result, each of the FY2018-FY2021 appropriations acts rescinded a portion of the specified mandatory appropriations to augment discretionary funding in order to offset estimated increases
in the mandatory spending for the add-on award.
60 Both the House and Senate have their own internal PAYGO rules that differ somewhat from Statutory PAYGO, but that also may have the effect of requiring that certain increases to mandatory spending or decreases to revenue be offset. For more information, see CRS Report RL31943, Budget Enforcem ent Procedures: The Sen ate Pay-As-You-Go (PAYGO) Rule and CRS Report R41510, Budget Enforcem ent Procedures: House Pay-As-You-Go (PAYGO) Rule.
61 T he Pell Grant program has not been amended by authorizing laws subject to PAYGO since enactment of PAYGO. T he SAFRA Act, which amended the program, was subject to reconciliation instructions. The FAFSA Simplification Act (Division FF-VII of the Consolidated Appropriations Act, 2021 [P.L. 116-260]), which amended the program, was excluded from PAYGO under the terms of the act. 62 T he decrease in the Pell Grant mandatory appropriations to augment discretionary funding may be larger or smaller than the estimated increase in mandatory spending for the add-on award since changes to other programs may contribute to the offset.
Congressional Research Service
23
Federal Pell Grant Program of the Higher Education Act: Primer
Policy Implications and Measures to Address Funding Shortfalls For the most part, funding shortfal s in the Pel Grant program have been recognized as common
occurrences. Persistent or high funding shortfal s, as in FY2010, may be viewed as fiscal y irresponsible. In essence when there is a shortfal , the program is in debt, and eventual y the debt must be paid. The higher the debt level, the more difficult it is to resolve. As a result of the 302(b) al ocations, resolving a Pel Grant program shortfal may lead to a difficult decision about which
may lead to a difficult decision about which program(s) to reduce discretionary funding.
for.
Over the years, federal policymakers and Congress have taken a variety of measures to address the vexing issues associated with funding shortfallsshortfal s in the Pell Pel Grant program. The measures have included modified budget scoring, reductions in students'’ awards, recipient caps, reductions in
program costs, and supplemental appropriations.
Reductions in Students'’ Awards and Recipient Caps Before 1992
From the inception of the program in 1972 until the enactment of the Higher Education Amendments of 1992 (P.L. 102-325), the Secretary of Education had statutory authority under the HEA HEA to reduce awards to respond to a shortfall shortfal in appropriated funds.5863 Reductions were made in
awards in eight years using this authority (the last in AY1990-AY1991). After this HEA authority was repealed, appropriations legislation for FY1994-FY2001 continued to provide the Secretary with reduction authority, but that authority was not used.5964 FY2002 and subsequent appropriations legislation
legislation have not included such language.
CBO Scoring Rule
Congress took steps in FY2006 to limit the possibility of large accumulated funding shortfallsshortfal s in the future. H.Con.Res. 95 (109th (109th Congress) established a permanent rule that applies to the scoring60scoring65 of the Pell Pel Grant program by the Congressional Budget Office (CBO). The rule provides that if the appropriation of new discretionary budget authority61authority66 enacted for the program is insufficient to cover the full estimated costs in the upcoming year—including any funding surplus or shortfall
or shortfal from prior years—the budget authority counted against the bill bil for the program will wil be equal to the adjusted full cost (i.e., total need). The full estimated costs must be based on the maximum discretionary award amount and any changes to the eligibility criteria. For most
63 Some form of authority to reduce awards was available to the Secretary between the inception of the program in 1972 and the 1992 amendments. Immediately prior to its repeal in 1992, the HEA provision permitted reducti on in awards only within certain limits. No award could be reduced for students whose expected family contribution (EFC) was $200 or less (i.e., the awards for the neediest students would be protected). A schedule of reductions for other awards had to use a single linear reduction form ula that applied uniformly. No award could be made to a student whose initial award was reduced to less than $100 under the reduction formula. T he original language creating the Basic Educational Opportunity Grants (BEOG), the predecessor to Pell Grants, in the Education Amendments of 1972 allowed for payments on a pro rata reduced basis and specified a minimum grant of $50 whenever the program was less than fully funded. 64 T he appropriations legislation during this time period required the Secretary to reduce awards using fixed or variable percentages, or using a fixed dollar reduction, if, prior to issuing the payment schedules, he or she determined that appropriated funds could not fully fund the appropriated maximum grant. A schedule of reduced grants would then be published.
65 CBO keeps score for Congress by monitoring the results of congressional action on individual authorization, appropriation, and revenue bills against budget authority and outlay targets that are specified in the concurrent resolutions. 66 Budget authority is defined as the broad responsibility conferred by Congress that empowers government agencies to spend federal funds.
Congressional Research Service
24
Federal Pell Grant Program of the Higher Education Act: Primer
criteria. For most discretionary programs, CBO equates the budget authority to the level provided in each appropriation bill.
appropriation bil .
As a result of the scoring rule, Congress cannot fund new programs or increase the funding of
existing programs subject to discretionary appropriations while providing less funding than required for the Pell Pel Grant program. The scoring rule, however, cannot fully account for the challengeschal enges of estimating the cost of the program. Discretionary program costs are estimated in advance of the award year they are intended to support, and based on the chosen discretionary base maximum award level and estimated program participation. The scoring rule does constrain
the accumulation of the funding shortfall shortfal by requiring Congress to annuallyannual y reconcile previous years'
years’ appropriation levels with updated estimates of previous years'’ program obligations.
Reductions in Program Costs
Given the CBO scoring rule, there are several levers that have been used to reduce or prevent an
increase in Pell Pel Grant program costs and thus reduce or eliminate a shortfall.
- shortfal . The discretionary maximum award level has been reduced or not increased.
- Statutory provisions that establish
PellPel Grant award rules have been modified to reduce the amount of funds that some students may receive. For example, year-roundPellPel Grants were eliminated beginning in AY2011-2012. -
Statutory provisions that establish
PellPel Grant eligibility -
Statutory provisions that establish the calculation of EFC have been modified to
reduce the numbers of students eligible for
PellPel Grants and other HEA Title IV need-based financial aid. For example, the income threshold for an automatic zero EFC was increased beginning in AY2012-2013 in order to reduce the number of students receiving an automatic zero EFC. -
Statutory provision that establish student eligibility
Supplementary Appropriations
In addition to reducing program costs or in lieu of reducing program costs to reduce or eliminate a funding shortfallshortfal , legislation has provided supplementary appropriations to address the CBO
scoring rule.
- Supplementary mandatory appropriations have been provided for general use in the program, often by generating savings in the Direct Loan program that is funded by mandatory budget authority.
-
Supplementary discretionary appropriations have been provided during periods
of expansionary fiscal policy such as through the American Recovery and Reinvestment Act (ARRA; P.L. 111-5
).
).
In addition to supplementary appropriations, the regular discretionary appropriations amount may
be increased.
Congressional Research Service
25
link to page 30 link to page 30 link to page 16 link to page 32 link to page 30 Federal Pell Grant Program of the Higher Education Act: Primer
Estimated Program Costs for Recent and Future Years Grant payments are made to eligible students who apply for aid and enroll in eligible programs be increased.
Policy Implications and Measures to Address Funding Surpluses
The policy implications of a funding surplus are very different from those of a shortfall. An increasing or high cumulative surplus may be viewed as presenting a potential opportunity. The surplus may be viewed as representing a pot of available funding. The surplus may be invested back into the Pell Grant program or it may be used to pursue other policy priorities.
There are several approaches for investing the surplus into the program.
- Appropriations levels and statutory provisions may be maintained under the assumption that Pell Grant program costs would eventually use the surplus. For example as the U.S. population grows, postsecondary enrollment and Pell Grant participation may grow.
- Award levels for Pell Grant recipients may be increased in order to increase the size of a Pell Grant. For example, the discretionary base maximum award was increased from $4,860 in FY2009-FY2017 to $5,035 in FY2018.
- Student eligibility for Pell Grants may be expanded. For example, increasing the discretionary base maximum award from $4,860 in FY2009-FY2017 to $5,035 in FY2018 also increases the number of students who are eligible.
- Statutory provisions that establish Pell Grant award rules may be modified to increase the amount of funds that some students may receive. For example, year-round Pell Grants were reauthorized beginning in AY2017-2018.
- Statutory provisions that establish the calculation of EFC may be modified to increase the numbers of students eligible for Pell Grants and other HEA Title IV need-based financial aid.
- Statutory provision that establish student eligibility for any HEA Title IV aid programs may be amended to increase eligibility.
Alternatively, the surplus may be used to fund or increase funding for other programs or to reduce a budget deficit. All or a portion of the surplus may be rescinded in an appropriations act. For example, the Consolidated Appropriations Act, 2017 (P.L. 115-31) included a rescission of $1.3 billion from the Pell Grant program surplus. The rescission offsets the cost of appropriations in the act.
Estimated Program Costs for Recent and Future Years
Grant payments are made to eligible students who apply for aid and enroll in eligible programs notwithstanding the prescribed appropriation levels in any one year in such a way that some liken notwithstanding the prescribed appropriation levels in any one year in such a way that some liken
the program to a quasi entitlement. Costs for the Pell Pel Grant program are award year-specific and are primarily affected by the number of eligible students who apply for aid and enroll in eligible programs, the total maximum award amount, and award rules. The number of eligible students may be affected by economic conditions and legislative changes to the federal need analysis methodology and award rules. As discussed earlier, the total maximum award amount is
determined by both the annual appropriations act and the HEA. Other factors that contribute to
changes in program costs include the cost of higher education.
The Congressional Budget Office reports and estimates program costs at least annually.annual y. Table 7
provides a summary of current and future estimated Pell Pel Grant program costs from AY2012-2013 through AY2021-2022, as of April 2018AY2017-2018 through AY2026-2027, as of February 2021. Costs associated with the discretionary base maximum award and costs associated with the mandatory add-on award are specifiedspecified. Table 7 shows a dip in costs in AY2020-2021 that followed fairly level but higher costs during the AY2017-2018 to AY2019-2020 period and that precedes an estimated period of ever increasing
costs thereafter.
From AY2017-2018 to AY2019-2020, the number of Pel Grant recipients decreased annual y
shows that the total program cost has declined from AY2012-2013 to AY2016-2017 and is estimated to increase thereafter.
From AY2012-2013 to AY2015-2016, the number of Pell Grant recipients decreased annually (Table 2) although the total maximum award amount increased annually since AY2013-2014 annual y since AY2017-2018 (Table A-1). Declining undergraduate enrollment in degree-granting postsecondary institutions from 16.8 mil ion in 2017 to 16.6 mil ion in 2019 is reflected in a reduction of Pel Grant
recipients.67
Program costs after AY2020-2021from 28.2 million in AY2011-2012 to 26.3 million in AY2015-2016 is reflected in a reduction of Pell Grant recipients.62 The decrease in the number of Pell Grant recipients from AY2012-2013 to AY2015-2016, which is particularly evident in the decrease in costs related to the discretionary award level, outweighs the increase in the total maximum award, which is demonstrated in increased costs associated with mandatory award levels.
Program costs after AY2016-2017 are estimated to increase (Table 7). The increase would primarily be a result of an estimated increase in the number of Pell Pel Grant recipients and the awarding of year-round Pell Grants. The CBO baseline does not account for any potential a change in the total maximum Pell Pel Grant award after the AY2021-2022the AY2018-2019 discretionary maximum award increase included in the Consolidated
Appropriations Act, 2018 (P.L. 115-141).
2021 (P.L. 116-260).
Table 7. Estimated Pell Grant Program Costs, AY2012-2013 to AY2021-2022
(dollars in billions)
|
Award Year (AY) |
AY2017-2018 to AY2026-2027
(dol ars in bil ions)
Cost Associated with
Cost Associated with
Discretionary Award
Mandatory Award
Award Year (AY)
Levels
Levels
Total Program Cost
AY2017-2018
22.8
5.9
28.6
AY2018-2019
22.7
6.1
28.8
AY2019-2020
22.7
5.9
28.7
AY2020-2021
21.5
5.5
27.0
AY2021-2022
23.7
5.6
29.2
AY2022-2023
24.5
5.9
30.5
AY2023-2024
27.9
6.3
34.2
67 National Center for Education Statistics (NCES), Digest of Education Statistics 2020, T able 303.70.
Congressional Research Service
26
Federal Pell Grant Program of the Higher Education Act: Primer
Cost Associated with
Cost Associated with
Discretionary Award
Mandatory Award
Award Year (AY)
Levels
Levels
Total Program Cost
AY2024-2025
28.4
6.4
34.8
AY2025-2026
28.8
6.5
35.3
AY2026-2027
29.2
6.6
35.8
Source: Congressional Budget Office (CBO), Baseline of the Federal Pel Grant Program dated June 2017, April 2018, May 2019, March 2020, and February 2021. Notes: Estimates of program costs are not adjusted for inflation and are subject to change. Costs for AY2022-2023 and subsequent years assume the discretionary base maximum award and mandatory add -on award remain at the FY2021 levels.
Congressional Research Service
27
link to page 33 link to page 33 Federal Pell Grant Program of the Higher Education Act: Primer
Appendix A. |
Cost Associated with Mandatory Award Levels |
Total Program Cost |
|
AY2012-2013 |
27.5 |
5.0 |
32.5 |
|
AY2013-2014 |
26.5 |
5.1 |
31.6 |
|
AY2014-2015 |
25.3 |
5.5 |
30.8 |
|
AY2015-2016 |
23.4 |
5.7 |
29.0 |
|
AY2016-2017 |
21.8 |
5.4 |
27.2 |
|
AY2017-2018 |
23.4 |
5.9 |
29.2 |
|
AY2018-2019 |
24.4 |
6.1 |
30.6 |
|
AY2019-2020 |
24.6 |
6.2 |
30.8 |
|
AY2020-2021 |
25.0 |
6.3 |
31.3 |
|
AY2021-2022 |
25.5 |
6.4 |
31.9 |
Source: Congressional Budget Office (CBO), Discretionary Baseline, Cumulative Surplus/Shortfall, and Funding Gap of the Federal Pell Grant Program—Baseline dated March 2012, May 2013, April 2014, March 2015, March 2016, June 2017, and April 2018.
Notes: Estimates of program costs are not adjusted for inflation and are subject to change.
Appendix A.
Historical Pell Grant Award Amounts
Historical Pell Grant Award Amounts
Table A-1. Pell Grant Award Amounts, AY1973-1974 and Subsequent Years
Discretionary
Authorized
Base
Mandatory
Total
Effective
Award Year
Maximum
Maximum
Add-On
Maximum
Minimum
(AY)
Awarda
Award
Award
Award
Awardb
1973-1974
$1,400
$452
N/A
$452
$50
1974-1975
1,400
1,050
N/A
1,050
50
1975-1976
1,400
1,400
N/A
1,400
200
1976-1977
1,400
1,400
N/A
1,400
200
1977-1978
1,800
1,400
N/A
1,400
200
1978-1979
1,800
1,600
N/A
1,600
50
1979-1980
1,800
1,800
N/A
1,800
200
1980-1981
1,800
1,750
N/A
1,750
150
1981-1982
1,900
1,670
N/A
1,670
120
1982-1983
2,100
1,800
N/A
1,800
50
1983-1984
2,300
1,800
N/A
1,800
200
1984-1985
2,500
1,900
N/A
1,900
200
1985-1986
2,600
2,100
N/A
2,100
200
1986-1987
2,600
2,100
N/A
2,100
100
1987-1988
2,300
2,100
N/A
2,100
200
1988-1989
2,500
2,200
N/A
2,200
200
1989-1990
2,700
2,300
N/A
2,300
200
1990-1991
2,900
2,300
N/A
2,300
100
1991-1992
3,100
2,400
N/A
2,400
200
1992-1993
3,100
2,400
N/A
2,400
200
1993-1994
3,700
2,300
N/A
2,300
400
1994-1995
3,900
2,300
N/A
2,300
400
1995-1996
4,100
2,340
N/A
2,340
400
1996-1997
4,300
2,470
N/A
2,470
400
1997-1998
4,500
2,700
N/A
2,700
400
1998-1999
4,500
3,000
N/A
3,000
400
1999-2000
4,500
3,125
N/A
3,125
400
2000-2001
4,800
3,300
N/A
3,300
400
2001-2002
5,100
3,750
N/A
3,750
400
2002-2003
5,400
4,000
N/A
4,000
400
2003-2004
5,800
4,050
N/A
4,050
400
2004-2005
5,800
4,050
N/A
4,050
400
Congressional Research Service
28
link to page 33 link to page 33 link to page 33 link to page 33 link to page 33 link to page 33 link to page 33 link to page 33 link to page 33 link to page 33 link to page 33 link to page 33 link to page 33 link to page 33 link to page 33 link to page 33 link to page 33 link to page 33 link to page 33 link to page 33 link to page 33 link to page 33 Federal Pell Grant Program of the Higher Education Act: Primer
Discretionary
Authorized
Base
Mandatory
Total
Effective
Award Year
Maximum
Maximum
Add-On
Maximum
Minimum
(AY)
Awarda
Award
Award
Award
Awardb
2005-2006
5,800c
4,050
N/A
4,050
400
2006-2007
5,800c
4,050
N/A
4,050
400
2007-2008
5,800c
4,310
N/A
4,310
400
2008-2009
5,800c
4,241
$490
4,731
523d
2009-2010
6,000
4,860
490
5,350
609d
2010-2011
None Specified
4,860
690
5,550
555
2011-2012
None Specified
4,860
690
5,550
555
2012-2013
None Specified
4,860
690
5,550
577e
2013-2014
None Specified
4,860
758
5,645
582e
2014-2015
None Specified
4,860
870
5,730
587e
2015-2016
None Specified
4,860
915
5,775
581e
2016-2017
None Specified
4,860
955
5,815
591e
2017-2018
None Specified
4,860
1,060
5,920
593e
2018-2019
None Specified
5,035
1,060f
6,095
650e
2019-2020
None Specified
5,135
1,060f
6,195
650e
2020-2021
None Specified
5,285
1,060f
6,345
639e
2021-2022
None Specified
5,435
1,060f
6,495
650e
Source: HEA; appropriations acts, FY2010-FY2021Table A-1. Pell Grant Award Amounts, AY1973-1974 and Subsequent Years
|
|
Discretionary Base Maximum Award |
Mandatory Add-On Award |
Total Maximum Award |
|
|
1973-1974 |
$1,400 |
$452 |
N/A |
$452 |
$50 |
|
1974-1975 |
1,400 |
1,050 |
N/A |
1,050 |
50 |
|
1975-1976 |
1,400 |
1,400 |
N/A |
1,400 |
200 |
|
1976-1977 |
1,400 |
1,400 |
N/A |
1,400 |
200 |
|
1977-1978 |
1,800 |
1,400 |
N/A |
1,400 |
200 |
|
1978-1979 |
1,800 |
1,600 |
N/A |
1,600 |
50 |
|
1979-1980 |
1,800 |
1,800 |
N/A |
1,800 |
200 |
|
1980-1981 |
1,800 |
1,750 |
N/A |
1,750 |
150 |
|
1981-1982 |
1,900 |
1,670 |
N/A |
1,670 |
120 |
|
1982-1983 |
2,100 |
1,800 |
N/A |
1,800 |
50 |
|
1983-1984 |
2,300 |
1,800 |
N/A |
1,800 |
200 |
|
1984-1985 |
2,500 |
1,900 |
N/A |
1,900 |
200 |
|
1985-1986 |
2,600 |
2,100 |
N/A |
2,100 |
200 |
|
1986-1987 |
2,600 |
2,100 |
N/A |
2,100 |
100 |
|
1987-1988 |
2,300 |
2,100 |
N/A |
2,100 |
200 |
|
1988-1989 |
2,500 |
2,200 |
N/A |
2,200 |
200 |
|
1989-1990 |
2,700 |
2,300 |
N/A |
2,300 |
200 |
|
1990-1991 |
2,900 |
2,300 |
N/A |
2,300 |
100 |
|
1991-1992 |
3,100 |
2,400 |
N/A |
2,400 |
200 |
|
1992-1993 |
3,100 |
2,400 |
N/A |
2,400 |
200 |
|
1993-1994 |
3,700 |
2,300 |
N/A |
2,300 |
400 |
|
1994-1995 |
3,900 |
2,300 |
N/A |
2,300 |
400 |
|
1995-1996 |
4,100 |
2,340 |
N/A |
2,340 |
400 |
|
1996-1997 |
4,300 |
2,470 |
N/A |
2,470 |
400 |
|
1997-1998 |
4,500 |
2,700 |
N/A |
2,700 |
400 |
|
1998-1999 |
4,500 |
3,000 |
N/A |
3,000 |
400 |
|
1999-2000 |
4,500 |
3,125 |
N/A |
3,125 |
400 |
|
2000-2001 |
4,800 |
3,300 |
N/A |
3,300 |
400 |
|
2001-2002 |
5,100 |
3,750 |
N/A |
3,750 |
400 |
|
2002-2003 |
5,400 |
4,000 |
N/A |
4,000 |
400 |
|
2003-2004 |
5,800 |
4,050 |
N/A |
4,050 |
400 |
|
2004-2005 |
5,800 |
4,050 |
N/A |
4,050 |
400 |
|
2005-2006 |
|
4,050 |
N/A |
4,050 |
400 |
|
2006-2007 |
|
4,050 |
N/A |
4,050 |
400 |
|
2007-2008 |
|
4,310 |
N/A |
4,310 |
400 |
|
2008-2009 |
|
4,241 |
$490 |
4,731 |
|
|
2009-2010 |
6,000 |
4,860 |
490 |
5,350 |
|
|
2010-2011 |
None Specified |
4,860 |
690 |
5,550 |
555 |
|
2011-2012 |
None Specified |
4,860 |
690 |
5,550 |
555 |
|
2012-2013 |
None Specified |
4,860 |
690 |
5,550 |
|
|
2013-2014 |
None Specified |
4,860 |
758 |
5,645 |
|
|
2014-2015 |
None Specified |
4,860 |
870 |
5,730 |
|
|
2015-2016 |
None Specified |
4,860 |
915 |
5,775 |
|
|
2016-2017 |
None Specified |
4,860 |
955 |
5,815 |
|
|
2017-2018 |
None Specified |
4,860 |
1,060 |
5,920 |
|
|
2018-2019 |
None Specified |
5,035 |
|
6,095 |
|
|
2019-2020 |
None Specified |
5,135 |
|
6,195 |
TBD |
Source: HEA; appropriations acts, FY2010-FY2016; U.S. Department of Education, Department of Education Budget Tables, Congressional Action FY2013-FY2016FY2021; and U.S. Department of Education, Federal Pell Pel Grant Payment and Disbursement and Disbursement Schedules, 2009-2010 to 2014-2015.
2021-2022. Notes: TBD = to be determined; N/A = not applicable.
a. The authorized maximum award was the annual maximum Pell Pel Grant specified for each award year in the
HEA. The authorization is intended to provide guidance regarding the appropriate amount of funds to carry out the policy objectives of a program. The SAFRA Act eliminated the authorized maximum award levels from the HEA.
b.
b. The effective minimum award is the minimum amount of Pell Pel Grant aid available to a student in any given
year as determined by law. The effective minimum award for AY2010-2011 and all al future years is equal to 10% of the total maximum award amount. Since the FY2012 Consolidated Appropriations Act eliminated the bump award beginning on July 1, 2012, the qualifying minimum award and effective minimum award are now the same.
c.
c. Prior to the reauthorization of the HEA by the HEOA in 2008, Congress passed measures to extend the HEA allowing
HEA al owing for the continuation of the Pell Pel Grant program. The last authorized maximum award specified in law prior to the HEOA was $5,800 for AY2003-2004; therefore, the authorized maximum award is listed as $5,800 from AY2004-2005 through AY2008-2009 in this table.
d.
d. This amount is the minimum amount of aid awarded to a student attending on a less-than-half-time basis.
e. e. Although the statutory effective minimum is 10% of the total maximum, the actual minimum award differs
because ED uses midpoints for both the EFC and COA. ED' ED’s Federal Pell Pel Grant Payment and Disbursement Schedules group COA and EFC in approximately $100 increments and calculate the award levels for each increment based on the increment midpoints. For example, the full-time, full the ful -time, ful -academic-year minimum scheduled award is based on an EFC increment of $5,401-$5,486 with a midpoint of $5,443 such that the minimum minimum award is maximum COA COA – minimum EFC or $652 ($6,095 - $5,443).
f.
Under current statutory provisions, the mandatory add-on award will remain wil remain at $1,060 permanently.
Appendix B.
Congressional Research Service
29
Federal Pell Grant Program of the Higher Education Act: Primer
Appendix B. Federal Pell Grant Recipients, AY1973-1974 and Subsequent Years
1974 to AY2015-2016
|
Award Year |
Pell Grant Recipients |
Annual Change |
% Change |
|
1973-1974 |
176,000 |
N/A |
N/A |
|
1974-1975 |
567,000 |
391,000 |
222.2% |
|
1975-1976 |
1,217,000 |
650,000 |
114.6% |
|
1976-1977 |
1,944,000 |
727,000 |
59.7% |
|
1977-1978 |
2,011,000 |
67,000 |
3.4% |
|
1978-1979 |
1,893,000 |
(118,000) |
(5.9%) |
|
1979-1980 |
2,538,000 |
645,000 |
34.1% |
|
1980-1981 |
2,708,000 |
170,000 |
6.7% |
|
1981-1982 |
2,709,000 |
1,000 |
0.0% |
|
1982-1983 |
2,523,000 |
(186,000) |
(6.9%) |
|
1983-1984 |
2,759,000 |
236,000 |
9.4% |
|
1984-1985 |
2,747,000 |
(12,000) |
(0.4%) |
|
1985-1986 |
2,813,000 |
66,000 |
2.4% |
|
1986-1987 |
2,660,000 |
(153,000) |
(5.4%) |
|
1987-1988 |
2,882,000 |
222,000 |
8.3% |
|
1988-1989 |
3,198,000 |
316,000 |
11.0% |
|
1989-1990 |
3,322,000 |
124,000 |
3.9% |
|
1990-1991 |
3,405,000 |
83,000 |
2.5% |
|
1991-1992 |
3,786,000 |
381,000 |
11.2% |
|
1992-1993 |
4,002,000 |
216,000 |
5.7% |
|
1993-1994 |
3,756,000 |
(246,000) |
(6.1%) |
|
1994-1995 |
3,675,000 |
(81,000) |
(2.2%) |
|
1995-1996 |
3,612,000 |
(63,000) |
(1.7%) |
|
1996-1997 |
3,666,000 |
54,000 |
1.5% |
|
1997-1998 |
3,733,000 |
67,000 |
1.8% |
|
1998-1999 |
3,855,000 |
122,000 |
3.27% |
|
1999-2000 |
3,764,000 |
(91,000) |
(2.36%) |
|
2000-2001 |
3,899,000 |
135,000 |
3.59% |
|
2001-2002 |
4,341,000 |
442,000 |
11.34% |
|
2002-2003 |
4,779,000 |
438,000 |
10.09% |
|
2003-2004 |
5,140,000 |
361,000 |
7.55% |
|
2004-2005 |
5,308,000 |
168,000 |
3.27% |
|
2005-2006 |
5,168,000 |
(140,000) |
(2.64%) |
|
2006-2007 |
5,165,000 |
(3,000) |
(0.06%) |
|
2007-2008 |
5,543,000 |
378,000 |
7.32% |
|
2008-2009 |
6,157,000 |
614,000 |
11.08% |
|
2009-2010 |
8,094,000 |
1,937,000 |
31.46% |
|
2010-2011 |
9,308,000 |
1,214,000 |
15.00% |
|
2011-2012 |
9,444,000 |
136,000 |
1.46% |
|
2012-2013 |
8,959,000 |
(486,000) |
(5.14%) |
|
2013-2014 |
8,663,000 |
(296,000) |
(3.30%) |
|
2014-2015 |
8,316,000 |
(347,000) |
(4.01%) |
|
2015-2016 |
7,660,000 |
(655,000) |
(7.88%) |
Source: U.S. Department of Education, AY2015-16 Pell Grant End-of-Year Report.
Note:Table B-1. Federal Pell Grant Recipients, AY1973-1974 and Subsequent Years
Award Year
Pell Grant Recipients
Annual Change
% Change
1973-1974
176,000
N/A
N/A
1974-1975
567,000
391,000
222.2%
1975-1976
1,217,000
650,000
114.6%
1976-1977
1,944,000
727,000
59.7%
1977-1978
2,011,000
67,000
3.4%
1978-1979
1,893,000
(118,000)
(5.9%)
1979-1980
2,538,000
645,000
34.1%
1980-1981
2,708,000
170,000
6.7%
1981-1982
2,709,000
1,000
0.0%
1982-1983
2,523,000
(186,000)
(6.9%)
1983-1984
2,759,000
236,000
9.4%
1984-1985
2,747,000
(12,000)
(0.4%)
1985-1986
2,813,000
66,000
2.4%
1986-1987
2,660,000
(153,000)
(5.4%)
1987-1988
2,882,000
222,000
8.3%
1988-1989
3,198,000
316,000
11.0%
1989-1990
3,322,000
124,000
3.9%
1990-1991
3,405,000
83,000
2.5%
1991-1992
3,786,000
381,000
11.2%
1992-1993
4,002,000
216,000
5.7%
1993-1994
3,756,000
(246,000)
(6.1%)
1994-1995
3,675,000
(81,000)
(2.2%)
1995-1996
3,612,000
(63,000)
(1.7%)
1996-1997
3,666,000
54,000
1.5%
1997-1998
3,733,000
67,000
1.8%
1998-1999
3,855,000
122,000
3.27%
1999-2000
3,764,000
(91,000)
(2.36%)
2000-2001
3,899,000
135,000
3.59%
2001-2002
4,341,000
442,000
11.34%
2002-2003
4,779,000
438,000
10.09%
2003-2004
5,140,000
361,000
7.55%
Congressional Research Service
30
Federal Pell Grant Program of the Higher Education Act: Primer
Award Year
Pell Grant Recipients
Annual Change
% Change
2004-2005
5,308,000
168,000
3.27%
2005-2006
5,168,000
(140,000)
(2.64%)
2006-2007
5,165,000
(3,000)
(0.06%)
2007-2008
5,543,000
378,000
7.32%
2008-2009
6,157,000
614,000
11.08%
2009-2010
8,094,000
1,937,000
31.46%
2010-2011
9,308,000
1,214,000
15.00%
2011-2012
9,444,000
136,000
1.46%
2012-2013
8,959,000
(486,000)
(5.14%)
2013-2014
8,663,000
(296,000)
(3.30%)
2014-2015
8,316,000
(347,000)
(4.01%)
2015-2016
7,660,000
(655,000)
(7.88%)
2016-2017
7,195,000
(465,000)
(6.07%)
2017-2018
7,111,000
(84,000)
(1.16%)
2018-2019
6,863,000
(248,000)
(3.49%)
2019-2020
6,746,000
(117,000)
(1.71%)
Source: U.S. Department of Education, AY2017-18 Pel Grant End-of-Year Report; and President’s budget FY2022. Note: Recipient figures rounded to the nearest thousand. Numbers in parentheses are negative numbers.
Congressional Research Service
31
link to page 37 link to page 37 link to page 37
Appendix C. Recipient figures rounded to the nearest thousand. Numbers in parentheses are negative numbers.
Appendix C.
Program Funding: FY2008-FY2021
Program Funding: FY2008-FY2021
Table C-1. Pell Grant Annual Funding: FY2008-FY2021
(dol ars in mil ions)
Fiscal Yeara
FY2008 FY2009 FY2010 FY2011 FY2012 FY2013 FY2014 FY2015 FY2016 FY2017 FY2018 FY2019 FY2020 FY2021
Legislation
Discretionary Appropriations
Annual Appropriations
14,215 17,288 17,495 22,956 22,824 22,778 22,778 22,475 22,475 22,475 22,475 22,475 22,475 22,475
ARRA
— 15,640
—
—
—
—
—
—
—
—
—
—
—
—
Total Discretionary
14,215 32,928 17,495 22,956 22,824 22,778 22,778 22,475 22,475 21,165 22,475 22,475 22,475 22,475
Mandatory Appropriations Provided to Augment Table C-1. Pell Grant Annual Funding: FY2008-FY2021
(dollars in millions)
|
FY2008 |
FY2009 |
FY2010 |
FY2011 |
FY2012 |
FY2013 |
FY2014 |
FY2015 |
FY2016 |
FY2017 |
FY2018 |
FY2019 |
FY2020 |
FY2021 |
|
Legislation |
||||||||||||||
|
Discretionary Appropriations |
||||||||||||||
|
Annual Appropriations |
14,215 |
17,288 |
17,495 |
22,956 |
22,824 |
22,778 |
22,778 |
22,475 |
22,475 |
22,475 |
22,475 |
22,475 |
TBD |
TBD |
|
ARRA |
— |
15,640 |
— |
— |
— |
— |
— |
— |
— |
— |
— |
— |
— |
— |
|
Consolidated Appropriations Act, 2017 |
— |
— |
— |
— |
— |
— |
— |
— |
— |
(1,310) |
— |
— |
— |
— |
|
Department of Defense and Labor, Health and Human Services, and Education Appropriations Act, 2019 and Continuing Appropriations Act, 2019 |
— |
— |
— |
— |
— |
— |
— |
— |
— |
— |
— |
(600) |
— |
— |
|
Total Discretionary |
14,215 |
32,928 |
17,495 |
22,956 |
22,824 |
22,778 |
22,778 |
22,475 |
22,475 |
21,165 |
22,475 |
21,875 |
TBD |
TBD |
|
Mandatory Appropriations Provided to Augment Discretionary Appropriations |
||||||||||||||
|
SAFRA Act |
— |
— |
— |
13,500 |
— |
— |
— |
— |
— |
— |
— |
— |
— |
— |
Discretionary Appropriations
SAFRA Act
—
—
— 13,500
—
—
—
—
—
—
—
—
—
—
FY2011 Continuing Appropriations Act
—
—
—
—
3,183
0
0
0
0
1,060
1,125
1,125
1,140
1,145b
Budget Control Act of 2011
—
—
—
— 10,000
7,000
—
—
—
—
—
—
—
—
|
— |
— |
— |
— |
3,183 |
0 |
0 |
0 |
0 |
1,060 |
1,125 |
1,125 |
1,140 |
|
|
Budget Control Act of 2011 |
— |
— |
— |
— |
10,000 |
7,000 |
— |
— |
— |
— |
— |
— |
— |
— |
FY2012 Consolidated Appropriations Act
—
—
—
—
612
587
588
0
0
514
257
284
290
0
|
— |
— |
— |
— |
612 |
587 |
588 |
0 |
0 |
514 |
257 |
284 |
290 |
0 |
Consolidated Appropriations Act, 2017
—
—
—
—
—
—
—
—
—
(254)
—
—
—
—
|
— |
— |
— |
— |
— |
— |
— |
— |
— |
(254) |
— |
— |
— |
— |
Consolidated Appropriations Act, 2018
—
—
—
—
—
—
—
—
—
—
(48)
—
—
—
Department of Defense and |
— |
— |
— |
— |
— |
— |
— |
— |
— |
— |
(48) |
— |
— |
— |
|
— |
— |
— |
— |
— |
— |
— |
— |
— |
— |
— |
(39) |
— |
— |
|
Total Mandatory to Augment Discretionary |
— |
— |
— |
13,500 |
13,795 |
7,587 |
588 |
0 |
0 |
1,574 |
1,382 |
1,370 |
1,430 |
1,145c |
|
Mandatory Appropriations Provided to Fund Add-On Award Amounts |
||||||||||||||
|
CCRAA |
|
2,090 |
3,030 |
3,090 |
5,050 |
105 |
4,305 |
4,400 |
4,600 |
4,900 |
— |
— |
— |
— |
|
ARRA |
— |
643 |
831 |
— |
— |
— |
— |
— |
— |
— |
— |
— |
— |
— |
|
— |
— |
— |
— |
— |
153 |
— |
152 |
— |
— |
— |
— |
— |
— |
|
— |
— |
(3,861) |
(3,090) |
(5,050) |
(258) |
(4,305) |
(4,452) |
(4,600) |
(4,900) |
— |
— |
— |
— |
|
— |
— |
|
|
|
|
|
|
|
|
|
|
SSAN |
SSAN |
|
Total Mandatory for Add-On Awards |
2,041 |
2,733 |
5,300 |
5,560 |
4,950 |
4,854 |
4,835 |
5,153 |
4,840 |
5,680 |
5,977 |
6,103 |
SSAN |
SSAN |
|
Total Pell Grant Funding Excluding Surplus (Discretionary and Mandatory) |
||||||||||||||
|
Total Funding |
16,256 |
35,661 |
22,795 |
42,016 |
41,569 |
35,219 |
28,202 |
27,628 |
27,316 |
29,476 |
29,834 |
29,348 |
TBD |
TBD |
Source: CRS analysis of the HEA and respective legislation.
Notes: TBD=to be determined; "—" means that no appropriations were provided beyond the initial year(s) specified. Numbers in parentheses are negative numbers.
SSAN=Such sums as necessary. In effect, this means the amount of mandatory appropriations that will be necessary to fully fund the add-on award amount specified in the HEA for a given year. In other words, mandatory funding has been available to support the add-on amount beginning in FY2010 onward indefinitely, but the specific amount required in each year cannot be reported until the add-on amount is determined and all funds are disbursed to eligible students
a. The fiscal year in this table represents the first year the funds appropriated in each column are available for use. Most funds are available for two fiscal years.
b. Numbers in parentheses are negative numbers. a. The fiscal year in this table represents the first year the funds appropriated in each column are available for use. Most fun ds are available for two fiscal years. b. Additional annual mandatory appropriations in the amount of $25,000,000 are also provided for each succeeding year beyond FY2021 per the FY2011 Continuing
Appropriations Act.
c. Additional annual mandatory appropriations in the amount of $1,145,000,000 are also provided for each succeeding year beyond FY2021 per the FY2011 Continuing Appropriations Act.
c. Includes $11 million FUTURE Act (P.L.
116-91).
d. Includes $11 mil ion for the elimination of the tuition sensitivity rule in AY2007-2008.
d. e. The SAFRA Act rescinded advance appropriation provided in the CCRAA, ARRA, and FY2009 Technical Amendments T echnical Amendments to the HEA. The SAFRA Act provided
indefinite and permanent mandatory appropriations for the mandatory add-on award. The positive amounts shown are the actual amounts required for the mandatory add-on award.
e.
CRS-33
f.
This is the amount of mandatory appropriations required for a $690 mandatory add-on award in AY2010-2011, as reported in the President's ’s FY2015 budget.
f.
g. This is the amount of mandatory appropriations required for a $690 mandatory add-on award in AY2011-2012, as reported in the President's ’s FY2016 budget.
g. h. This is the amount of mandatory appropriations required for a $690 mandatory add-on award in AY2012-2013, as reported in the President's ’s FY2017 budget.
hi.
This is the amount of mandatory appropriations required for a $785 mandatory add-on award in AY2013-2014, as reported in the President's ’s FY2018 budget.
i.
j.
This is the amount of mandatory appropriations required for ana $870 mandatory add-on award in AY2014-2015, as reported in the President's ’s FY2019 budget.
j.
k. This is the amount of mandatory appropriations required for a $915 mandatory add-on award in AY2015-2016, as reported in the President's FY2019’s FY2020 budget.
kl.
This is the amount of mandatory appropriations required for a $965 mandatory add-on award in AY2016-2017, as reported in the President's FY2019 budget.
l. ’s FY2021 budget.
m. This is the amount of mandatory appropriations required for a $1,060 mandatory add-on award in AY2017-2018, as reported in the President's FY2019’s FY2022 budget.
CRS-34
link to page 40 link to page 40 Federal Pell Grant Program of the Higher Education Act: Primer
Appendix D. budget.
m. This is the amount of mandatory appropriations required for a $1,060 mandatory add-on award in AY2018-2019, as reported in the President's FY2019 budget.
n. This is the amount of mandatory appropriations required for a $1,060 mandatory add-on award in AY2019-2020, as reported in the President's FY2019 budget
Appendix D.
Annual and Cumulative Discretionary Funding Shortfalls and Surpluses in the Pell Grant Program, FY1973-FY2018
and Subsequent Years
Table D-1. Annual and Cumulative Discretionary Funding Shortfalls and Surpluses in
the Pell Grant Program, FY1973 and Subsequent Years
(dol ars in mil ions)
Funds Available for
Cumulative
Fiscal
the Discretionary Estimated Total Annual Surplus
Surplus or
Year
Award Year
Award Level
Expendituresa
or (Shortfall)b
(Shortfall)
1973
1973-1974
$122
$48
$74
N/A
1974
1974-1975
475
358
117
N/A
1975
1975-1976
840
926
(86)
N/A
1976
1976-1977
1,326
1,475
(149)
N/A
1977
1977-1978
1,904
1,524
380
N/A
1978
1978-1979
2,160
1,541
619
N/A
1979
1979-1980
2,431
2,357
74
N/A
1980
1980-1981
2,157
2,387
(230)
N/A
1981
1981-1982
2,604
2,300
304
N/A
1982
1982-1983
2,419
2,421
(2)
N/A
1983
1983-1984
2,419
2,797
(378)
N/A
1984
1984-1985
2,800
3,053
(253)
N/A
1985
1985-1986
3,862
3,597
265
N/A
1986
1986-1987
3,580
3,460
120
N/A
1987
1987-1988
4,187
3,754
433
N/A
1988
1988-1989
4,260
4,476
(216)
N/A
1989
1989-1990
4,484
4,770
(75)
($75)
1990
1990-1991
4,804
4,904
(231)
(306)
1991
1991-1992
5,376
5,772
(396)
(702)
1992
1992-1993
5,503
6,156
18
(684)
1993
1993-1994
6,462
5,621
460
(224)
1994
1994-1995
6,637
5,504
808
584
1995
1995-1996
6,147
5,466
716
1,300
1996
1996-1997
4,914
5,784
(870)
429
1997
1997-1998
5,919
6,315
(396)
33
1998
1998-1999
7,345
7,236
109
142
1999
1999-2000
7,704
7,233
471
613
Congressional Research Service
35
link to page 40 link to page 40 link to page 41 link to page 41 link to page 41 link to page 41 link to page 41 link to page 41 link to page 41 link to page 41 link to page 41 link to page 41 link to page 41 link to page 41 link to page 41 link to page 41 link to page 41 link to page 41 link to page 41 link to page 41 link to page 41 link to page 41 Federal Pell Grant Program of the Higher Education Act: Primer
Funds Available for
Cumulative
Fiscal
the Discretionary Estimated Total Annual Surplus
Surplus or
Year
Award Year
Award Level
Expendituresa
or (Shortfall)b
(Shortfall)
2000
2000-2001
7,640
7,996
(356)
256
2001
2001-2002
8,756
9,985
(1,229)
(908)
2002
2002-2003
10,314
11,653
(1,339)
(1,247)c
2003
2003-2004
11,365
12,713
(1,348)
(2,595)
2004
2004-2005
12,007
13,152
(1,145)
(3,740)
2005
2005-2006
12,365
12,695
(330)
(4,070)
2006
2006-2007
13,045
12,825
220
220d
2007
2007-2008
13,661
14,699
(1,038)
(818)
2008
2008-2009
14,215e
16,054
(1,839)
(2,657)
2009
2009-2010
32,928e
26,844
6,084
3,427
2010
2010-2011
17,495e
30,491
(12,996)
(9,569)
2011
2011-2012
36,456e
28,796
7,660
(1,909)
2012
2012-2013
36,619e
27,512
9,107
7,198
2013
2013-2014
30,365e
26,481
3,884
11,082
2014
2014-2015
23,366e
25,320
(1,954)
9,128
2015
2015-2016
22,475e
23,361
(886)
8,242
2016
2016-2017
22,475e
22,808
(333)
7,754
2017
2017-2018
23,795e
22,773
1,022
9,007f
2018
2018-2019
23,809e
22,692
1,117
10,124
2019
2019-2020
23,845e
22,746
1,099
10,623g
2020
2020-2021
23,880e
21,483
2,397
12,520h
2021
2021-2022
23,618e
23,654
(36)
11,983i
Table D-1. Annual and Cumulative Discretionary Funding Shortfalls and Surpluses in the Pell Grant Program, FY1973-FY2018
(dollars in millions)
|
Fiscal Year |
Award Year |
Funds Available for the Discretionary Award Level |
|
|
Cumulative Surplus or (Shortfall) |
|
1973 |
1973-1974 |
$122 |
$48 |
$74 |
N/A |
|
1974 |
1974-1975 |
475 |
358 |
117 |
N/A |
|
1975 |
1975-1976 |
840 |
926 |
(86) |
N/A |
|
1976 |
1976-1977 |
1,326 |
1,475 |
(149) |
N/A |
|
1977 |
1977-1978 |
1,904 |
1,524 |
380 |
N/A |
|
1978 |
1978-1979 |
2,160 |
1,541 |
619 |
N/A |
|
1979 |
1979-1980 |
2,431 |
2,357 |
74 |
N/A |
|
1980 |
1980-1981 |
2,157 |
2,387 |
(230) |
N/A |
|
1981 |
1981-1982 |
2,604 |
2,300 |
304 |
N/A |
|
1982 |
1982-1983 |
2,419 |
2,421 |
(2) |
N/A |
|
1983 |
1983-1984 |
2,419 |
2,797 |
(378) |
N/A |
|
1984 |
1984-1985 |
2,800 |
3,053 |
(253) |
N/A |
|
1985 |
1985-1986 |
3,862 |
3,597 |
265 |
N/A |
|
1986 |
1986-1987 |
3,580 |
3,460 |
120 |
N/A |
|
1987 |
1987-1988 |
4,187 |
3,754 |
433 |
N/A |
|
1988 |
1988-1989 |
4,260 |
4,476 |
(216) |
N/A |
|
1989 |
1989-1990 |
4,484 |
4,770 |
(75) |
($75) |
|
1990 |
1990-1991 |
4,804 |
4,904 |
(231) |
(306) |
|
1991 |
1991-1992 |
5,376 |
5,772 |
(396) |
(702) |
|
1992 |
1992-1993 |
5,503 |
6,156 |
18 |
(684) |
|
1993 |
1993-1994 |
6,462 |
5,621 |
460 |
(224) |
|
1994 |
1994-1995 |
6,637 |
5,504 |
808 |
584 |
|
1995 |
1995-1996 |
6,147 |
5,466 |
716 |
1,300 |
|
1996 |
1996-1997 |
4,914 |
5,784 |
(870) |
429 |
|
1997 |
1997-1998 |
5,919 |
6,315 |
(396) |
33 |
|
1998 |
1998-1999 |
7,345 |
7,236 |
109 |
142 |
|
1999 |
1999-2000 |
7,704 |
7,233 |
471 |
613 |
|
2000 |
2000-2001 |
7,640 |
7,996 |
(356) |
256 |
|
2001 |
2001-2002 |
8,756 |
9,985 |
(1,229) |
(908) |
|
2002 |
2002-2003 |
|
11,653 |
(339) |
(1,247) |
|
2003 |
2003-2004 |
11,365 |
12,713 |
(1,348) |
(2,595) |
|
2004 |
2004-2005 |
12,007 |
13,152 |
(1,145) |
(3,740) |
|
2005 |
2005-2006 |
12,365 |
12,695 |
(330) |
(4,070) |
|
2006 |
2006-2007 |
|
12,825 |
4,520 |
220 |
|
2007 |
2007-2008 |
13,661 |
14,699 |
(1,038) |
(818) |
|
2008 |
2008-2009 |
14,215 |
16,054 |
(1,839) |
(2,657) |
|
2009 |
2009-2010 |
|
26,844 |
6,084 |
3,427 |
|
2010 |
2010-2011 |
17,495 |
30,491 |
(12,996) |
(9,569) |
|
2011 |
2011-2012 |
|
28,796 |
7,660 |
(1,909) |
|
2012 |
2012-2013 |
|
27,512 |
9,107 |
7,198 |
|
2013 |
2013-2014 |
|
26,481 |
3,884 |
11,082 |
|
2014 |
2014-2015 |
|
25,320 |
(1,954) |
9,128 |
|
2015 |
2015-2016 |
22,475 |
23,361 |
(886) |
8,242 |
|
2016 |
2016-2017 |
22,475 |
21,788 |
687 |
8,929 |
|
2017 |
2017-2018 |
|
23,377 |
(892) |
8,037 |
|
2018 |
2018-2019 |
|
24,436 |
(627) |
7,410 |
Sources: (1) U.S. Department of Education (ED), AY2010-11 Federal Pell Pel Grant Program End-of-Year Report; (2) unpublished data provided by ED; (3) data provided by CBO in May 2013, April 2014, and March 2015 ; March 2016; June 2017, April 2018, May 2019, March 2020, and February 2021 ; and (4) respective appropriations measures.
Notes: TBD = to be determined. Notes: N/A = not available. Numbers in parentheses are negative numbers. Data on the cumulative shortfall or shortfal or surplus prior to AY1989-1990 could not be verified and therefore are not provided. Prior to 1980, the program was cal edwas called the Basic Educational Opportunity Grant (BEOG) Program.
a. a. The estimated total expenditure totals for AY1973-1974 through AY1988-1989 are taken from the U.S.
Department of Education, AY2009-10 Federal Pell Pel Grant Program End-of-Year Report and do not include administrative cost allowanceadministrative cost al owance payments to institutions. The expenditure totals for AY1989 -1990 to AY2005-2006 are taken from unpublished data provided by ED and reflect administrative cost allowance administrative cost al owance payments to institutions. Estimates of all of al data after AY2005-2006 are provided by CBO and also include administrative cost allowanceadministrative cost al owance payments to institutions. All estimates Al estimates of expenditures are subject to change. In years in which mandatory appropriations were available to fund the discretionary award levels, expenditures include discretionary and mandatory appropriations.
b.
b. The annual shortfall shortfal or surplus amount reflects account transfers and other adjustments and may not equal
the difference between the annual appropriation and estimated total expenditures in each year.
Congressional Research Service
36
Federal Pell Grant Program of the Higher Education Act: Primer
c. The 2002 Supplemental Appropriations Act for Further Recovery From and Response To Terrorist Attacks
on the United States (P.L. 107-206) provided $1.000 bil ion in supplemental discretionary funding to pay for the FY2001 Pel Grant cumulative shortfal .
d. The Departments of Labor, Health and Human Services, and Education, and Related Agencies
Appropriations Act, 2006 (P.L. 109-149) appropriated $4.300 bil ion in mandatory funding for a one-time elimination of the estimated funding shortfal through AY2005-2006 in accordance with §303 of H.Con.Res. 95, the FY2006 budget resolution. The mandatory funds that exceeded the actual cumulative funding shortfal were returned to the U.S. Department of the Treasury.
e. This number includes annual discretionary appropriations and may include additional mandatory and
discretionary funding. For a list of the applicable legislation and amounts, see Table C-1.
f.
Thethe difference between the annual appropriation and estimated total expenditures in each year.
c. Includes $1 billion in supplemental discretionary funding to pay for the FY2001 cumulative shortfall.
d. Includes $4.3 billion in mandatory funding provided in FY2006 to exclusively supplement the discretionary funding necessary to retire the cumulative funding shortfall through AY2005-2006, as originally estimated in the President's FY2006 budget. The mandatory funds that exceeded the actual cumulative funding shortfall were returned to the U.S. Department of the Treasury. The discretionary appropriation for FY2006 was $13,045 million.
e. Includes approximately $15.7 billion in supplemental discretionary appropriations provided in the American Recovery and Reinvestment Act (ARRA).
f. Includes $13.5 billion in mandatory appropriations that were provided in the SAFRA Act for general use in the program through FY2012 and $22,956 million in discretionary appropriations provided in the FY2011 Continuing Appropriations Act.
g. This number includes mandatory and discretionary funding from the following sources: The FY2011 Continuing Appropriations Act provided $3,183 million in mandatory appropriations for general use in the program for FY2012. The Budget Control Act of 2011 (P.L. 112-25) provided $10 billion in mandatory appropriations for general use in the program for FY2012. Finally, the FY2012 Consolidated Appropriations Act (P.L. 112-74) provided $22,824 million in discretionary appropriations for FY2012 and $612 million in mandatory appropriations for general use in the program for FY2012.
h. This number includes mandatory and discretionary funding from the following sources: The Budget Control Act of 2011 (P.L. 112-25) provided $7 billion in mandatory appropriations for general use in the program for FY2013. Additionally, the FY2012 Consolidated Appropriations Act (P.L. 112-74) provided $587 million in mandatory appropriations for general use in the program for FY2013.
i. This number includes mandatory and discretionary funding from the following sources: The FY2012 Consolidated Appropriations Act (P.L. 112-74) provided $588 million in mandatory appropriations for general use in the program for FY2014. The Consolidated Appropriations Act, 2014 (P.L. 113-76) provided $22,778 million in discretionary appropriations for FY2014.
j. This number includes mandatory and discretionary funding from the following sources: The FY2011 Continuing Appropriations Act provided $1.060 million in mandatory appropriations; the FY2012 Consolidated Appropriations Act (P.L. 112-74) provided $514 million in mandatory appropriations; and the Consolidated Appropriations Act, 2017 (P.L. 115-31) provided $22.475 million in discretionary appropriations, rescinded $1.310 million of the surplus, and reduced the cumulative mandatory appropriation of $1.574 million from the FY2011 Continuing Appropriations Act and the FY2012 Consolidated Appropriations Act to $1.320 million.
k. This number includes mandatory and discretionary funding from the following sources: The FY2011 Continuing Appropriations Act provided $1.125 million in mandatory appropriations; the FY2012 Consolidated Appropriations Act (P.L. 112-74) provided $257 million in mandatory appropriations; and the Consolidated Appropriations Act, 2018 (P.L. 115-141) provided $22.475 million in discretionary appropriations and reduced the cumulative mandatory appropriation of $1.382 million from the FY2011 Continuing Appropriations Act and the FY2012 Consolidated Appropriations Act to $1.334 million.
Appendix E.
) rescinded $1.310 bil ion of the cumulative surplus.
g. The Department of Defense and Labor, Health and Human Services, and Education Appropriations Act,
2019 and Continuing Appropriations Act, 2019 (P.L. 115-245) rescinded $600 mil ion of the cumulative surplus.
h. The Further Consolidated Appropriations Act, 2020 (P.L. 116-94) rescinded $500 mil ion from the
cumulative surplus.
i.
The Consolidated Appropriations Act, 2021 rescinded $500 mil ion from the cumulative surplus.
Congressional Research Service
37
Federal Pell Grant Program of the Higher Education Act: Primer
Appendix E. Glossary/Acronyms
ARRA
Glossary/Acronyms
|
ARRA |
American Recovery and Reinvestment Act ( |
|
CBO |
Congressional Budget Office |
|
CCRAA |
P.L. 111-5)
CBO
Congressional Budget Office
CCRAA
College Cost Reduction and Access Act of 2007 ( |
|
COA |
Cost of Attendance |
|
Direct Loan |
William D. Ford Direct Loan program |
|
ED |
U.S. Department of Education |
|
EFC |
Expected Family Contribution |
|
FAFSA |
Free Application for Federal Student Aid |
|
HEA |
P.L. 110-84) COA Cost of Attendance Direct Loan Wil iam D. Ford Direct Loan program ED U.S. Department of Education EFC Expected Family Contribution FAFSA Free Application for Federal Student Aid HEA Higher Education Act of 1965 (P.L. 89-329), as amended |
|
HEOA |
HEOA
Higher Education Opportunity Act of 2008 ( |
|
IHE |
Institution of Higher Education |
|
ISIR |
Institutional Student Information Record |
|
NPSAS |
U.S. Department of Education, National Postsecondary Student Aid Study |
|
Private for-profit |
Sometimes referred to as proprietary |
|
SAFRA Act |
P.L. 110-315)
IHE
Institution of Higher Education
ISIR
Institutional Student Information Record
NPSAS
U.S. Department of Education, National Postsecondary Student Aid Study
Private for-profit
Sometimes referred to as proprietary
SAFRA Act
Title II-A of the Health Care and Education Reconciliation Act of 2010 |
Author Contact Information
Footnotes
| 1. |
U.S. Department of Education, Fiscal Year 2019 Budget, pp. N-6–N-7. |
| 2. |
CRS analysis of AY2015-2016 data from the Department of Education, National Postsecondary Student Aid Study (NPSAS). This survey, which is conducted about every four or more years, was most recently conducted for award year 2015-2016. |
| 3. |
The statutory authority for the Pell Grant program was most recently reauthorized through FY2017 by the Higher Education Opportunity Act of 2008 (HEOA; P.L. 110-315). |
| 4. |
For more information on GEPA's Contingent Extension of Programs, see CRS Report R41119, General Education Provisions Act (GEPA): Overview and Issues. |
| 5. |
This CRS report supersedes CRS Report 422446, Federal Pell Grant Program of the Higher Education Act: How the Program Works and Recent Legislative Changes. The current report contains updated information. |
| 6. |
Title IV of HEA authorizes several student aid programs: Pell Grant program, Iraq and Afghanistan service grants, William D. Ford Federal Direct Loan (DL) Program, Federal Supplemental Educational Opportunity Grant (FSEOG) program, and Federal Work-Study (FWS) program. See CRS Report RL31618, Campus-Based Student Financial Aid Programs Under the Higher Education Act; and CRS Report R40122, Federal Student Loans Made Under the Federal Family Education Loan Program and the William D. Ford Federal Direct Loan Program: Terms and Conditions for Borrowers. |
| 7. |
There are two ways to complete and submit a FAFSA for consideration of federal student aid. For instance, students and families may use FAFSA on the Web, which is an interactive online process. Alternatively, they may obtain a paper FAFSA from their financial aid office or other locations and submit it to the address listed on the form, although most applications are submitted electronically. |
| 8. |
For more information on the FAFSA processes and calculation of EFC, see CRS Report R44503, Federal Student Aid: Need Analysis Formulas and Expected Family Contribution. |
| 9. |
Student awards have not been reduced nor recipient caps imposed since AY1990-AY1991. |
| 10. |
The Pell Grant award year begins the first day of July in a given year and ends the last day of June the following year. |
| 11. |
See Higher Education Act, as amended (hereinafter referred to as HEA), Section 484 (34 C.F.R. part 668, subpart C) for general requirements and Section 401 (34 C.F.R. part 690, subpart A) for Pell Grant specific requirements. |
| 12. |
An eligible program requires at least 16 semester hours (or the equivalent) offered during a minimum of 15 weeks. Alternatively, an eligible program may be at least 8 semester hours (or the equivalent) offered during a minimum of 10 weeks, if an associate's degree is required for admissions. One semester hour requires one hour of classroom or direct faculty instruction and at least two hours of out-of-class work each week for approximately 15 weeks. For information on HEA Title IV eligible programs and eligible institutions, see CRS Report R43159, Institutional Eligibility for Participation in Title IV Student Financial Aid Programs. |
| 13. |
The equivalent of a high school diploma may include a general educational development (GED) certificate; the completion of an eligible homeschool program; or the completion of one of the ability to benefit alternatives and either being enrolled in an eligible career pathway program or being first enrolled in an eligible postsecondary program prior to July 1, 2012. The ability to benefit may be demonstrated by passing an examination approved by ED to be eligible for federal student aid, or by successfully completing six credits or 225 clock hours of college work applicable to a certificate or degree offered by a postsecondary institution. A career pathway program combines occupational skills training, counseling, workforce preparation, high school completion, and postsecondary credential attainment. |
| 14. |
In general, students must be U.S. citizens or permanent U.S. residents. Individuals with several other entrance statuses can qualify for aid. Individuals in the United States on a temporary basis, such as those with a student visa or an exchange visitor visa, are not eligible for federal student aid. Students with Deferred Action for Childhood Arrivals (DACA) status, conferred by the U.S. Citizenship & Immigration Services (USCIS) office in the Department of Homeland Security, are not eligible for HEA Title IV aid. |
| 15. |
Periods of ineligibility for federal student aid funds are based on whether the conviction was for the sale or possession of drugs and whether the student had previous offenses. The period of ineligibility does not apply if the conviction was reversed, set aside, removed from the student's record, or received while a juvenile (unless tried as an adult), or once the student completes a qualified drug rehabilitation program. A conviction for the sale of drugs includes convictions for conspiring to sell drugs. |
| 16. |
Students with a bachelor's degree may be enrolled at least half-time in a postbaccalaureate teacher education program. Half-time enrollment is at least 6 credit hours in a standard semester. A postbaccalaureate teacher education program does not lead to a graduate degree; is offered by a school that does not also offer a bachelor's degree in education; and leads to certification or licensure necessary for employment as an elementary or secondary school teacher in the state. To be eligible for a Pell Grant, the student enrolled in the postbaccalaureate teacher education program must be pursuing an initial teacher certification or licensing credential within the state. |
| 17. |
A student with a significant intellectual disability has a cognitive impairment, characterized by significant limitations in intellectual and cognitive functioning and significant limitations in adaptive behavior as expressed in conceptual, social, and practical adaptive skills; and is or was eligible for a free appropriate public education under the Individuals with Disabilities Education Act. For a description of the Individuals with Disabilities Education Act, see CRS Report R41833, The Individuals with Disabilities Education Act (IDEA), Part B: Key Statutory and Regulatory Provisions. Comprehensive transition and postsecondary (CTP) programs are not required to lead to a recognized credential (e.g., bachelor's degree) or adhere to the same durational requirements that regular postsecondary programs must meet (e.g., a certain number of credit-bearing clock hours). Instead, CTP programs require students with intellectual disabilities to receive curriculum advising, participate at least part-time in courses or training with students who do not have intellectual disabilities, and prepare for gainful employment. A student with a significant intellectual disability in a CTP program does not require a high school diploma (or equivalent) and does not have to be enrolled for the purpose of obtaining a certificate or degree. A student with a significant intellectual disability in a CTP program must maintain satisfactory academic progress as determined by the school for the comprehensive transition and postsecondary program. |
| 18. |
HEA Section 401. |
| 19. |
For more information on the federal needs analysis methodology and calculation of EFC, see CRS Report R44503, Federal Student Aid: Need Analysis Formulas and Expected Family Contribution. See also HEA Title IV-F. |
| 20. |
For HEA Title IV aid purposes, an independent student is an individual who is at least 24 years of age by December 31 of the award year; is married; is a graduate or professional student; is a veteran of the U.S. Armed Forces or is currently serving on active duty in the military; has dependents other than a spouse; has been in foster care, an orphan, or a ward of the court (anytime since the age of 13); is an emancipated minor or in legal guardianship as determined by a court; is an unaccompanied, homeless youth or self-supporting, at risk of being homeless; or is deemed independent by a financial aid officer for other unusual circumstances. See HEA Section 480(d). |
| 21. |
One of the benefits of qualifying for an automatic zero EFC is that it may reduce the number of questions the student must answer when completing the FAFSA. HEA Section 479(c). |
| 22. |
U.S. Department of Education, 2018-2019 Federal Student Aid Handbook, p. AVG-40. |
| 23. |
For students who are not eligible for Pell Grants due to their EFC and who had a parent or guardian die as a result of military service in Iraq or Afghanistan after September 11, 2001, non-need-based grants called Iraq and Afghanistan Service Grants (IASG) are available. The amount of the IASG is the same as the Pell Grant the student would be eligible for if he or she had a zero EFC. IASG payments are adjusted like Pell Grants for students who are enrolled less than full time, but unlike Pell Grants, these non-need-based grants do not count as estimated financial assistance. |
| 24. |
There are exceptions and allowable additions depending on the program of study, the student's enrollment rate, whether the student has a disability, and the student's living situation. See HEA Section 472. |
| 25. |
The HEA prohibits the Pell Grant from exceeding the difference between the COA and the EFC. This precludes the awarding of a Pell Grant in excess of what a student might need to cover the COA after taking the EFC into account. |
| 26. |
The annual award for a student in a clock-hour or nonterm credit-hour program is always the scheduled award even if the student is attending less than full time. |
| 27. |
In recent years, ED has published the Federal Pell Grant Payment and Disbursement Schedules as a Dear Colleague Letter (DCL). For the 2018-2019 Federal Pell Grant Payment and Disbursement Schedules, see https://ifap.ed.gov/dpcletters/GEN1804.html. |
| 28. |
The actual minimum award differs because ED uses midpoints for both the expected family contribution (EFC) and the cost of attendance (COA) in the annual award rule. ED's Federal Pell Grant Payment and Disbursement Schedules group COA and EFC in approximately $100 increments and calculate the award levels for each increment based on the increment midpoints. For example, the full-time, full-academic-year minimum scheduled award is based on an EFC increment of $5,401-$5,486 with a midpoint of $5,443 such that the minimum award is maximum COA – minimum EFC or $652 ($6,095 - $5,443). |
| 29. |
The proportional division takes into consideration the number of weeks of each payment period and the number of full-time credit or clock hours in each payment period in comparison to the academic year definition. |
| 30. |
This provision was enacted by the Consolidated Appropriations Act, 2017 (P.L. 115-31). |
| 31. |
Eligible students enrolled from July 1, 2009, to June 30, 2011, were eligible to receive so-called year-round Pell Grants, or up to two scheduled awards in a single award year. |
| 32. |
The HEOA amendments introduced lifetime eligibility limitations for Pell Grants. Effective for students who received their first Pell Grant on or after July 1, 2008, cumulative Pell Grant lifetime eligibility was limited to 18 full-time semesters (or the equivalent). The Consolidated Appropriations Act, 2012 (P.L. 112-74) reduced the cumulative lifetime eligibility for Pell Grant aid from 18 semesters to 12 semesters starting in AY2012-2013. Any Pell Grant aid received prior to AY2012-2013 is included in a student's lifetime limit. |
| 33. |
For example, students who consistently enroll part-time in standard terms throughout their progression to a bachelor's degree could receive Pell Grant aid for 24 semesters, or 12 years. Students who consistently enroll full-time in standard terms throughout their degree progression to a bachelor's degree could receive Pell Grant aid for 12 semesters, or six years. This change does not affect the measurement of full-time enrollment for the purposes of federal student aid, which is currently 12 semester hours (or the equivalent for non-standard terms). |
| 34. |
HEA Section 437(c)(3). |
| 35. |
See also HEA Titles I and IV. |
| 36. |
CRS analysis of AY2015-2016 data from the National Postsecondary Student Aid Study (NPSAS). A CRS analysis of AY2003-2004, AY2007-2008, and AY2011-2012 NPSAS data shows that the percentage of all undergraduates estimated to have received Pell Grants in each of these academic years was 27%, 28%, and 41%, respectively. |
| 37. |
Such factors include, but are not limited to, (1) amendments to the HEA that affect the federal need analysis calculation and Pell Grant award rules; (2) changes in the maximum grant level specified in annual appropriations bills; (3) trends in enrollment at postsecondary institutions; (4) demographic factors; and (5) macroeconomic and microeconomic variables. |
| 38. |
Total family income is defined here as the adjusted gross income (if a tax filer), any taxable income (if not a tax filer), and any non-taxable income. |
| 39. |
Table 70 of the AY2016-2017 Pell Grant End-of-Year Report. |
| 40. |
Jessica L. Semega, Kayla R. Fontenot, and Melissa A. Kollar, U.S. Census Bureau, Current Population Reports, P60-259, Income and Poverty in the United States: 2016, U.S. Government Publishing Office, Washington, DC, 2017. |
| 41. |
According to Table 70 of the AY2016-2017 Pell Grant End-of-Year Report, approximately 5,907 Pell Grant recipients, or 0.1% of the total recipient population, had a family income of $100,000 or more. In cases where the family has more than one student enrolled in or accepted to college for the award year, the EFC is reduced to account for the number of students expected to be enrolled in the upcoming year. |
| 42. |
"How For-Profit Colleges Sell 'Risky Education' To The Most Vulnerable," NPR, March 27, 2017; Elizabeth A. Harris, "New York City Consumer Agency Investigating Four For-Profit Colleges," The New York Times, April 2, 2015; and Caroline Simon, "For-Profit Colleges' Teachable Moment: 'Terrible Outcomes Are Very Profitable'," Forbes, March 19, 2018. |
| 43. |
Under Section 472 of the HEA, other allowances for the cost of attendance for the purpose of awarding Pell Grant aid are provided, such as costs associated with transportation and dependent care expenses. These costs are not considered in this section of the report in order to maintain a comparable trend across institutional sectors. If these costs are included, the average amount of coverage by the Pell Grant maximum would be less for all types of institutions. |
| 44. |
For more information on college prices and potential explanations for escalating college prices, see CRS Report R43692, Overview of the Relationship between Federal Student Aid and Increases in College Prices. |
| 45. |
Federal need-based student aid from the HEA is defined here as Pell Grants, Federal Supplemental Educational Opportunity Grants (FSEOG), Federal Work-Study earnings, and Direct Subsidized Loans. |
| 46. |
CRS estimates from 2015-2016 NPSAS. |
| 47. |
The cost of attendance is the sum of tuition and fees and non-tuition expenses for students who attended only one institution. The cost is adjusted to accommodate private alternative loans that may exceed total aid (federal, state, institutional, and private financial aid received by the student in the form of grants, loans, work-study assistance, or other types of aid). |
| 48. |
The annual appropriation for the Pell Grant program is available immediately upon enactment at any point on or after October 1. In the event the annual appropriation is not enacted at the beginning of the fiscal year, a continuing resolution typically provides prorated funding for the program until an appropriation measure is enacted. |
| 49. |
For example, mandatory funding in the amount of $4.3 billion was provided in P.L. 109-149 to pay exclusively for the accumulated funding shortfall through AY2005-2006. |
| 50. |
Prior to the SAFRA Act, the College Cost Reduction and Access Act of 2007 (CCRAA) provided annual specified mandatory appropriation levels from FY2008 to FY2017 to fund annual add-on award amounts. The SAFRA Act eliminated the specified mandatory appropriation levels for FY2010 and all subsequent years and replaced these levels with indefinite mandatory appropriations, while revising the add-on award amounts. |
| 51. |
|
| 52. |
Since the enactment of the SAFRA Act, legislative changes that affect the eligibility and award rules of the Pell Grant program are measured separately on the budget ledger between discretionary and mandatory funding. That is, a distinction is made between savings or additional costs associated with funding the discretionary base maximum award and the mandatory add-on award when changes to the program are enacted. For example, eliminating eligibility for a student to receive two scheduled Pell Grant awards in one award year resulted in savings associated with both the discretionary base maximum award and the mandatory add-on award. In general, savings associated with the mandatory award was redirected back to the program as specified mandatory appropriations for future use in specified years. |
| 53. |
For more information about appropriated entitlements, see CRS Report RS20129, Entitlements and Appropriated Entitlements in the Federal Budget Process. |
| 54. |
The authorizing statue speaks of entitlements when it describes the award determined for a student based on the published award schedule. |
| 55. |
This response to the shortfall is only feasible if ED determines enough funds are available from the most recently enacted appropriation to meet obligations from multiple award years. A series of legal opinions at ED and other agencies in the 1990s provides the basis for the authority to use funds in an annual appropriation for multiple award years. In general, absent specific language in an annual appropriations measure limiting funds to a specific award year or purpose, the Secretary may use such funds for any award year during the period of availability specified in an appropriations measure. |
| 56. |
In general, the annual surplus or shortfall is a measure of the difference between one year's appropriation, which is typically provided for a particular award year, and the estimated expenditures for that particular award year. The cumulative surplus is a measure that, in addition to including the annual surplus or shortfall, takes into account the prior year's surplus or shortfall amount. |
| 57. |
For more information on the budget and appropriations process, see CRS Report R40472, The Budget Resolution and Spending Legislation. |
| 58. |
Some form of authority to reduce awards was available to the Secretary between the inception of the program in 1972 and the 1992 amendments. Immediately prior to its repeal in 1992, the HEA provision permitted reduction in awards only within certain limits. No award could be reduced for students whose expected family contribution (EFC) was $200 or less (i.e., the awards for the neediest students would be protected). A schedule of reductions for other awards had to use a single linear reduction formula that applied uniformly. No award could be made to a student whose initial award was reduced to less than $100 under the reduction formula. The original language creating the Basic Educational Opportunity Grants (BEOG), the predecessor to Pell Grants, in the Education Amendments of 1972 allowed for payments on a pro rata reduced basis and specified a minimum grant of $50 whenever the program was less than fully funded. |
| 59. |
The appropriations legislation during this time period required the Secretary to reduce awards using fixed or variable percentages, or using a fixed dollar reduction, if, prior to issuing the payment schedules, he or she determined that appropriated funds could not fully fund the appropriated maximum grant. A schedule of reduced grants would then be published. |
| 60. |
CBO keeps score for Congress by monitoring the results of congressional action on individual authorization, appropriation, and revenue bills against budget authority and outlay targets that are specified in the concurrent resolutions. |
| 61. |
Budget authority is defined as the broad responsibility conferred by Congress that empowers government agencies to spend federal funds. |
| 62. |
National Center for Education Statistics (NCES), Digest of Education Statistics 2017, Table 308.20. |