Trends in Mandatory Spending
Changes from September 14, 2018 to November 7, 2023
This page shows textual changes in the document between the two versions indicated in the dates above. Textual matter removed in the later version is indicated with red strikethrough and textual matter added in the later version is indicated with blue.
Trends in Mandatory Spending: In Brief
FTrends in Mandatory Spending
November 7, 2023
Federal spending is divided into three broad categories: discretionary spending, mandatory spending, and net interest. Those categories are procedural, determined in the way that Congress
D. Andrew Austin
provides spending authority. The Budget Enforcement Act of 1990 (BEA; P.L. 101-508)
Analyst in Economic Policy
provides a statutory definition for those terms, which are therefore referred to as BEA categories.
To a large extent, however, the type of spending differs across those categories.
Discretionary spending, by and large, funds operations of federal agencies. Discretionary spending is provided and controlled through appropriations acts. Net interest spending is the government’s interest payments on debt held by the public, offset by interest income that the government receives.
Mandatory spending is composed of budget outlays controlled by laws other than appropriations acts, including federal spending on entitlement programs.
In recent decades, mandatory spending has been the largest component of the federal budget. Major entitlement programs such as Social Security, Medicare, and Medicaid make up the bulk of mandatory spending. Other mandatory spending funds various income-support programs, including Supplemental Security Income (SSI), unemployment insurance, and the Supplemental Nutrition Assistance Program (SNAP; formerly Food Stamps), as well as federal employee and military retirement and some veterans’ benefits. In general, discretionary funding supports veteran health services and mandatory funding supports pensions, housing, and other benefits.
Most mandatory spending is administered by the Social Security Administration and the U.S. Department of Health and Human Services (DHHS). Mandatory spending administered by the Department of Labor and the Department of Energy typically rises during economic downturns. Mandatory spending tends to rise during economic downturns when the incomes of many households fall. That increased spending can help stabilize aggregate demand in the economy, thus promoting macroeconomic stability.
Mandatory spending typically is provided in permanent or multiyear appropriations contained in an authorizing law. Authorizing legislation establishes or continues the operation of a federal program or agency, either indefinitely or for a specified period. Such funding becomes available automatically each year, without further legislative action by Congress. Some entitlement spending, such as for Medicaid, SNAP, and certain veterans’ programs, is funded, but not controlled, in annual appropriations acts. Such entitlement spending is referred to as appropriated entitlements.
Although costs of federal health care and social insurance programs have shaped the longer trajectory of mandatory spending, two major fiscal shocks—the 2007-2009 financial crisis and the COVID-19 pandemic—also elevated mandatory spending.
Over the next decade, mandatory spending is projected to stabilize at about 14.1% of GDP before rising in the first years of the 2030s. Discretionary spending, an estimated 6.7% of GDP in FY2023, is projected to decline gradually to 6.0% of GDP in FY2033.
Over the long term, projections suggest that if current policies remain unchanged, the United States could face major fiscal imbalances. According to the Congressional Budget Office’s extended baseline projections, Social Security would grow from 5.1% of GDP in FY2023 to 6.0% of GDP by FY2023 and 6.2% by FY2043. Federal mandatory spending on major health care programs is projected to expand from about 5.8% of GDP in FY2023 to 6.6% in FY2033 and to 8.0% by FY2043. Fiscal imbalances can be addressed by increasing revenues, reducing spending, or a mix of those strategies.
Congressional Research Service
link to page 4 link to page 5 link to page 5 link to page 6 link to page 7 link to page 9 link to page 10 link to page 12 link to page 13 link to page 13 link to page 14 link to page 15 link to page 15 link to page 15 link to page 16 link to page 17 link to page 6 link to page 8 link to page 9 link to page 10 link to page 11 link to page 14 link to page 20 link to page 20 link to page 19 link to page 23 Trends in Mandatory Spending
Contents
What Is Mandatory Spending? .................................................................................................. 1
Funding for Mandatory Spending ....................................................................................... 2
Composition of Mandatory Spending ....................................................................................... 2
Mandatory Spending as Share of Total Federal Spending .................................................. 3 Mandatory Spending Concentrated in the Human Resources Budget Function ................. 4 Most Mandatory Spending Administered by SSA and DHHS ........................................... 6
Mandatory Trends and Legislative Changes ............................................................................. 7
Two Major Fiscal Shocks Elevated Mandatory Spending .................................................. 9 2007-2009 Financial Crisis and the Great Recession ....................................................... 10 The COVID-19 Pandemic ................................................................................................. 10 Legislation Affecting Mandatory Spending in 2022 .......................................................... 11
Mandatory Spending in Coming Decades ............................................................................... 12
Health Care Costs ............................................................................................................. 12 Social Security and Medicare Trust Funds ....................................................................... 12
Long-Term Challenges ............................................................................................................ 13 Policy Options ......................................................................................................................... 14
Figures Figure 1. Federal Outlays by Category Since FY1962 .................................................................... 3 Figure 2. Mandatory Outlays by Budget Superfunction, FY1962-FY2024 .................................... 5 Figure 3. Mandatory Spending Within Human Resources Budget Superfunction .......................... 6 Figure 4. Human Resources Mandatory Outlays by Agency, FY1977-FY2028 ............................. 7 Figure 5. Components of Mandatory Outlays Since FY1962 ......................................................... 8
Tables Table 1. Major Mandatory COVID-19 Responses ......................................................................... 11
Table A-1. Mandatory Outlays, FY2020-FY2033, CBO Current-Law Baseline
Projections .................................................................................................................................. 17
Appendixes Appendix. Baseline Projections of Mandatory Spending in the Next Decade .............................. 16
Contacts Author Information ........................................................................................................................ 20
Congressional Research Service
Trends in Mandatory Spending
ederal spending is divided into three broad categories: discretionary spending, mandatory spending, and net interest. In recent decades, mandatory spending has been the largest
F component of the federal budget.
Those categories are procedural—that is, how Congress provides or has provided spending authority differs among those categoriesthem. The Budget Enforcement Act of 1990 (BEA; P.L. 101-508) provides a statutory definition for ) defined those terms, which are therefore referred toknown as BEA categories. To a large extent, however, the type of spending differs across those categories.
Discretionary spending, by and large, funds operations of federal agencies. Net interest spending is the government's interest payments on debt held by the public, offset by interest income that the government receives.
Major entitlement programs such as Social Security, Medicare, and Medicaid
What Is Mandatory Spending? Discretionary spending is provided and controlled through appropriations acts. Mandatory spending is composed of budget outlays controlled by laws other than appropriations acts. Discretionary spending, by and large, funds operations of federal agencies. Mandatory spending, by and large, funds federal social insurance programs, health programs, and federal retirement systems.1
Interest paid on federal debt, according to that definition, is a type of mandatory spending because those payments are authorized by a permanent appropriation. Net interest spending—federal interest payments on debt held by the public, offset by interest income received by intergovernmental accounts—is always reported separately in budget documents, which distinguish programmatic costs from debt service costs.
Major entitlement programs, such as Social Security, Medicare, and Medicaid, make up the bulk of mandatory spending. Other mandatory spending funds various income -support programs, including Supplemental Security Income (SSI), unemployment insurance, and the Supplemental Nutrition Assistance Program (SNAP; formerly known as food stamps), as well as federal employee and military retirement and some veterans' benefits. In recent decades, mandatory spending has been the largest component of the federal budget.
What Is Mandatory Spending?
Mandatory spending is composed of budget outlays controlled by laws other than appropriations acts, including federal spending on entitlement programs.1 By contrast, discretionary spending is provided and controlled through appropriations acts.
’ benefits. In general, discretionary funding supports veteran health services and mandatory funding supports pensions, housing, and other benefits.
Mandatory spending typically is provided in permanent or multi-yearmultiyear appropriations contained in an authorizing law. Authorizing legislation establishes or continues the operation of a federal program or agency, either indefinitely or for a specified period. SuchThat funding becomes available automatically each year, without further legislative action by Congress. Some entitlement spending, such as for Medicaid, the Supplemental Nutrition Assistance Program (SNAP; formerly Food Stamps), and certain veterans' programs, is funded, but not controlled, in annual appropriations acts. Such entitlement spending is referred to as appropriated entitlements.
Mandatory spending tends to rise during economic downturns when incomes of many households fall. That increased spending canmandatory programs—notably Medicaid, SNAP, and certain veterans’ programs—receive their funding in annual appropriations acts and are referred to as appropriated entitlements.2 Appropriations committees have little, if any, discretion as to the amounts to be provided based on provisions of authorizing acts.
Mandatory spending tends to rise during economic downturns. In part, that rise is automatic because falling incomes increase the number of households eligible for unemployment benefits
1 In statutory text (2 U.S.C. §900(c)(4)(B)(8)), mandatory spending is called direct spending, which “means budget authority provided by law other than appropriation Acts; entitlement authority; and the food stamp program” (now known as the Supplemental Nutrition Assistance Program). In some recent instances, certain funding provided in nonappropriations laws was designated as discretionary (e.g., P.L. 117-58, Div. J, Title IX, §905(c)). Although the budgetary categories of discretionary and mandatory/direct spending were first defined in statute in 1990, the Office of Management and Budget retroactively conformed historical budget data to those categories.
2 See CRS Report RS20129, Entitlements and Appropriated Entitlements in the Federal Budget Process, by Bill Heniff Jr. Per 2 U.S.C. §622, “entitlement authority” means “(A) the authority to make payments (including loans and grants), the budget authority for which is not provided for in advance by appropriation Acts, to any person or government if, under the provisions of the law containing that authority, the United States is obligated to make such payments to persons or governments who meet the requirements established by that law; and (B) the food stamp program.”
Congressional Research Service
1
link to page 6 link to page 6 Trends in Mandatory Spending
and other income-support programs. In addition, falling incomes reduce tax collections. Those effects are known as automatic stabilizers because they help stabilize aggregate demand in the economy, thus promoting macroeconomic stability.
Also, Congress has typically responded to severe economic downturns with measures to bolster income-support programs and to reduce some taxes. The capacity to run deficits when the economy is in recession, however, ultimately rests on the federal government’s ability to reduce deficits when the economy is growing.
Funding for Mandatory Spending
Funding for Mandatory Spending
How mandatory programs are funded varies. Social Security is supported by payroll taxes paid by employers and employees, which are earmarked for trust funds from which benefits are paid. Medicare is funded by a combination of payroll taxes, beneficiary premiums, and general federal revenues.23 Medicaid is a joint federal-state program, in which the federal cost share is determined by a statutory formula.34 Retirement programs for those in federal serviceemployees are supported by payroll deductions and contributions, as well as general revenues.45 Some other mandatory programs, such as veterans'’ income security benefits and agricultural subsidies, are typically funded from general revenues. In some cases, Congress has used general revenues to bolster trust funds. Discretionary funding, in general, supports the administrative costs of federal benefits programsrevenues. Administrative costs of federal benefits programs are generally supported by discretionary funding, even if the benefits are paid out of mandatory funds.
Composition of Mandatory Spending
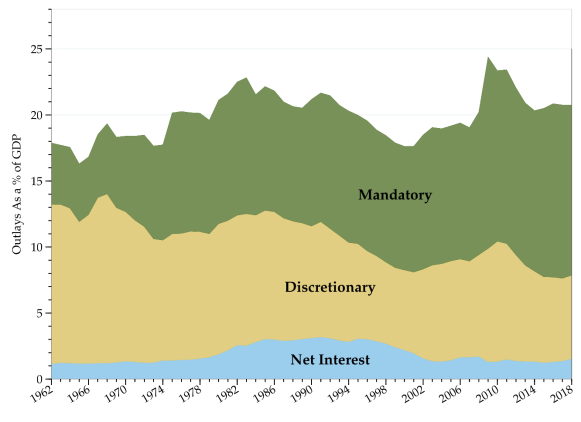
Figure 1 shows trends in mandatory, discretionary, and net interest spending since FY1962 as a share of gross domestic product (GDP). Spending trends are often shown as a share of GDP, which provides a simple way to adjust for inflation, population growth, and rising per capita income. In FY2018, mandatory spending was estimated to total $2,546 billion, which equaled 12.7% of gross domestic product (GDP). The estimated proportion for discretionary spending in FY2018 was 6.4%, or about half , which adjusts for inflation, population growth, and rising per capita income. Levels for FY2023 are estimated and those for later years reflect Biden Administration proposals and projections. The grey line shows total federal revenues as a share of GDP.
Figure 1 also indicates some key events that have shaped federal budget policy, starting with the establishment of Medicare and Medicaid in 19656 and ending with the declaration of COVID-19 as a pandemic in March 2020.
In FY2023, mandatory spending was estimated to total $3.980 trillion, which equaled 15.2% of GDP. The estimated proportion for discretionary spending in FY2023 was 6.5%, or less than half the level of mandatory spending. Net interest costs in FY2023 were 2.5% of GDP. In total, estimated FY2023 federal spending was 24.2% of GDP, while total federal revenues were 18.4% of GDP, resulting in an estimated deficit of 5.9% of GDP.7
3 See CRS In Focus IF10885, Medicare Overview, by Patricia A. Davis and Phoenix Voorhies. 4 See CRS In Focus IF10322, Medicaid Primer, by Alison Mitchell. 5 See CRS Report RL30023, Federal Employees’ Retirement System: Budget and Trust Fund Issues, by Katelin P. Isaacs.
6 Medicare and Medicaid Act of 1965 (P.L. 89-67, https://www.archives.gov/milestone-documents/medicare-and-medicaid-act).
7 U.S. Congressional Budget Office (CBO), An Update to the Budget Outlook: 2023 to 2033, May 12, 2023, http://www.cbo.gov/publication/59096.
Congressional Research Service
2
Trends in Mandatory Spending
Figure 1. Federal Outlays by Category Since FY1962
Source: CRS calculations based on OMB data from the FY2024 budget submission. Notes: Outlays for FY2023 are estimated. Levels for later years reflect Administration proposals and projections.
the level of mandatory spending.
As a Percentage of GDP |
 |
|
Source: CRS calculations based on OMB data from the FY2019 budget submission. Notes: Outlays for FY2018 are estimated. |
Figure 2 shows trends among major categories of mandatory spending. The growth in Social Security spending as a percentage of GDP reflects an expansion of the proportion of workers covered by the program, demographic changes, and changes in benefits. Medicare and Medicaid spending as a proportion of GDP has risen consistently since those programs were established in 1965. The Other Health category contains a variety of public health and related programs. Other mandatory spending includes costs of income security programs, such as the federal portion of unemployment insurance, along with certain veterans' programs, federal retirement, and several other smaller programs.
Mandatory Spending as Share of Total Federal Spending
In FY2018Mandatory Spending as Share of Total Federal Spending
In FY2023, mandatory spending accounts for an estimated 63% of total federal spending. Social Security alone accounts for about 2421% of federal spending. Medicare and the federal share of Medicaid together account for another 2625% of federal spending. Therefore, spending on Social Security, Medicare, and Medicaid now makes up aboutalmost half of total federal spending.
These figures do not reflect the implicit cost of tax expenditures, which are revenue losses attributable to provisions of the federal tax laws that allow a special exclusion, exemption, or deduction from gross income or provide a special credit, a preferential tax rate, or a deferral of tax liability.8 As with mandatory spending, tax policy is not controlled by annual appropriations acts, but by other types of legislation.
In previous decades, mandatory spending accounted for a smaller share of federal outlays. In 1962, before the creation of Medicare and Medicaid, mandatory spending was less than 30% of all federal spending. At that time, Social Security accounted for about 13% of total federal spending or about half of all mandatory spending.
Baseline Projections of Mandatory Spending in the Next Decade
The Congressional Budget Office (CBO) calculates a current-law baseline which projects federal spending and receipts over a 10-year window. Projected mandatory spending trends reflect eligibility requirements, benefit formulas, economic trends, and changes in demographics. Table 1 presents a breakdown of mandatory spending in recent years along with April 2018 CBO current-law baseline projections.
|
|
|
|
|
|
|
|
|
|
|
|
|
|
|
| ||||||||||||||||
|
|
|
|
|
|
|
|
|
|
|
|
|
|
|
| ||||||||||||||||
|
|
|
|
|
|
|
|
|
|
|
|
|
|
|
| ||||||||||||||||
|
|
|
|
|
|
|
|
|
|
|
|
|
|
|
| ||||||||||||||||
|
|
|
|
|
|
|
|
|
|
|
|
|
|
|
| ||||||||||||||||
|
|
|
|
|
|
|
|
|
|
|
|
|
|
|
| ||||||||||||||||
|
|
|
|
|
|
|
|
|
|
|
|
|
|
|
| ||||||||||||||||
|
|
|
|
|
|
|
|
|
|
|
|
|
|
|
| ||||||||||||||||
|
|
|
|
|
|
|
|
|
|
|
|
|
|
|
| ||||||||||||||||
|
|
|
|
|
|
|
|
|
|
|
|
|
|
|
| ||||||||||||||||
|
|
|
|
|
|
|
|
|
|
|
|
|
|
|
| ||||||||||||||||
|
|
|
|
|
|
|
|
|
|
|
|
|
|
|
| ||||||||||||||||
|
|
|
|
|
|
|
|
|
|
|
|
|
|
|
| ||||||||||||||||
|
|
|
|
|
|
|
|
|
|
|
|
|
|
|
| ||||||||||||||||
|
|
|
|
|
|
|
|
|
|
|
|
|
|
|
| ||||||||||||||||
|
|
|
|
|
|
|
|
|
|
|
|
|
|
|
| ||||||||||||||||
|
|
|
|
|
|
|
|
|
|
|
|
|
|
|
| ||||||||||||||||
|
|
|
|
|
|
|
|
|
|
|
|
|
|
|
| ||||||||||||||||
|
|
|
|
|
|
|
|
|
|
|
|
|
|
|
| ||||||||||||||||
|
|
|
|
|
|
|
|
|
|
|
|
|
|
|
| ||||||||||||||||
|
|
|
|
|
|
|
|
|
|
|
|
|
|
|
| ||||||||||||||||
|
|
|
|
|
|
|
|
|
|
|
|
|
|
|
| ||||||||||||||||
|
Other |
|
|
|
|
|
|
|
|
|
|
|
|
|
|
| ||||||||||||||||
|
|
|
|
|
|
|
|
|
|
|
|
|
|
|
| ||||||||||||||||
|
|
|
|
|
|
|
|
|
|
|
|
|
|
|
| ||||||||||||||||
|
|
|
|
|
|
|
|
|
|
|
|
|
|
|
| ||||||||||||||||
|
|
|
|
|
|
|
|
|
|
|
|
|
|
|
| ||||||||||||||||
|
|
|
|
|
|
|
|
|
|
|
|
|
|
|
| ||||||||||||||||
|
|
|
|
|
|
|
|
|
|
|
|
|
|
|
| ||||||||||||||||
|
|
|
|
|
|
|
|
|
|
|
|
|
|
|
| ||||||||||||||||
|
|
|
|
|
|
|
|
|
|
|
|
|
|
|
| ||||||||||||||||
|
|
|
|
|
|
|
|
|
|
|
|
|
|
|
| ||||||||||||||||
|
|
|
|
|
|
|
|
|
|
|
|
|
|
|
| ||||||||||||||||
|
|
|
|
|
|
|
|
|
|
|
|
|
|
|
| ||||||||||||||||
|
|
|
|
|
|
|
|
|
|
|
|
|
|
|
| ||||||||||||||||
|
|
|
|
|
|
|
|
|
|
|
|
|
|
|
| ||||||||||||||||
|
|
|
|
|
|
|
|
|
|
|
|
|
|
|
| ||||||||||||||||
|
|
|
|
|
|
|
|
|
|
|
|
|
|
|
|
Source: CBO, Budget and Economic Outlook: 2018 to 2028, April 2018, previous Budget and Economic Outlook editions, and Office of Management and Budget data.
Notes: Items may not sum to totals due to rounding. Figures for FY2013-FY2017 are actual; figures for FY2018 are estimated; figures for FY2019-FY2027 are projected.
a. Excludes offsetting receipts.
b. —not yet an actuarially mature program—
8 2 U.S.C. §622(3).
Congressional Research Service
3
link to page 8 Trends in Mandatory Spending
accounted for about 13% of total federal spending or about half of all mandatory spending.9 By 1962, employer-provided health insurance had expanded among much of the working-age population, but only about half of the elderly had any health insurance and few insurance plans available to them covered a majority of short-stay hospital expenses.10
Mandatory Spending Concentrated in the Human Resources Budget Function
One way of dividing up federal spending is by budget functions, which sum costs of similar activities across the government.11 Functions are grouped into superfunctions that mark broad categories of federal activities. The bulk of mandatory outlays are spent within the Human Resources superfunction, as shown in Figure 2.
The Physical Resources budget superfunction accounts for a much smaller amount of mandatory spending, peaking during recessions, such as in 1990-1991, in 2008-2010, and during the COVID-19 pandemic in 2020 and 2021, due to higher mandatory spending within the Energy budget function.
9 In the early years of a social insurance program largely financed on a pay-as-you-go basis, such as Social Security, the number of those paying into the program greatly exceeds the number of beneficiaries. As such a program matures, the imbalance between contributors and beneficiaries lessens.
10 U.S. Congress, Senate Committee on Aging, Developments in Aging: 1958-1963, 88th Cong., 1st sess., February 11, 1963, S.Rept. 88-8, pp. 12-24, https://www.aging.senate.gov/imo/media/doc/reports/rpt363.pdf.
11 See CRS Report 98-280, Functional Categories of the Federal Budget, by Bill Heniff Jr. Also see CRS Report R41726, Discretionary Budget Authority by Subfunction: An Overview, by D. Andrew Austin.
Congressional Research Service
4
link to page 9 link to page 9
Trends in Mandatory Spending
Figure 2. Mandatory Outlays by Budget Superfunction, FY1962-FY2024
Source: CRS calculations based on OMB data from FY2024 budget submission. Notes: FY2023 levels are estimated. FY2024 levels reflect Administration projections and proposals.
Figure 3 shows mandatory outlays within Human Resources budget functions. Social Security outlays, the largest category for all years excepting the pandemic years of 2020-2021, had been relatively steady at about 4.0%-4.5% of GDP until FY2009, when the youngest Baby Boomers were reaching retirement age.12 Mandatory outlays for Income Security strongly reflect the business cycle, rising sharply during recessions and especially in the 2020-2021 COVID-19 pandemic years. Mandatory outlays for Medicare and Health (mostly Medicaid and public health programs) have been trending upward over the whole period shown in Figure 3, as have Veterans Benefits and Services outlays since FY2001.
12 During the 2007-2009 Great Recession, the number of people enrolling in Social Security at age 62 increased, which may have altered the trajectory of Social Security outlays to some extent. See Jason J. Fichtner, John W.R. Phillips, and Barbara A. Smith, “Early Claiming of Social Security Retirement Benefits Increased During the Recession,” Social Security Administration, research note, April 2013, https://www.ssa.gov/policy/docs/research-summaries/early-claiming.html. The labor force participation rate (i.e., percentage of adults working or looking for work) for people aged 65 years or older, however, has continued to rise, even between 2007 and 2010. See Table 2, Evan Cunningham, “Great Recession, Great Recovery? Trends from the Current Population Survey,” Monthly Labor Review, April 2018, https://www.bls.gov/opub/mlr/2018/article/great-recession-great-recovery.htm.
Congressional Research Service
5
link to page 10
Trends in Mandatory Spending
Figure 3. Mandatory Spending Within Human Resources Budget Superfunction
FY1977-FY2024
Source: CRS calculations based on OMB data from FY2024 budget submission. Notes: FY2023 levels are estimated. FY2024-FY2028 levels reflect Administration projections and proposals.
Most Mandatory Spending Administered by SSA and DHHS
Another way to divide federal outlays is by agency. Figure 4 shows mandatory spending as a share of GDP for agencies with the largest operations within the human resources budget superfunction.13 Although all agencies make mandatory outlays for federal retirement programs, among other purposes, the Social Security Administration (SSA) and the Department of Health and Human Services (DHHS) administer the larger portions of mandatory spending. The Department of Labor (DOL), which administers federal unemployment programs, administers more mandatory spending when unemployment rates are high. Recent initiatives to reduce postsecondary education student debt would be scored as a substantial increase in mandatory spending by the Department of Education (ED).14 Mandatory spending by the Department of
13 The Office of Personnel Management (OPM), which administers federal pension funds, is not included in the figure. Its mandatory outlays have been about 0.5% of GDP in recent decades.
14 CBO, Monthly Budget Review: September 2023, https://www.cbo.gov/publication/59544/html. Also see text box “How Student Loan Forgiveness Affects Deficits and Debt,” in CBO, Budget and Economic Outlook 2023-2033, February 2023, https://www.cbo.gov/publication/58946#_idTextAnchor152.
Congressional Research Service
6
link to page 11
Trends in Mandatory Spending
Veterans Affairs has been increasing as a share of GDP since 2001, and after FY2023 it is projected to be the third-largest agency in terms of mandatory spending.
Figure 4. Human Resources Mandatory Outlays by Agency, FY1977-FY2028
Source: CRS calculations based on OMB data from FY2024 budget submission. Notes: FY2023 levels are estimated. FY2024-FY2028 levels reflect Administration projections and proposals.
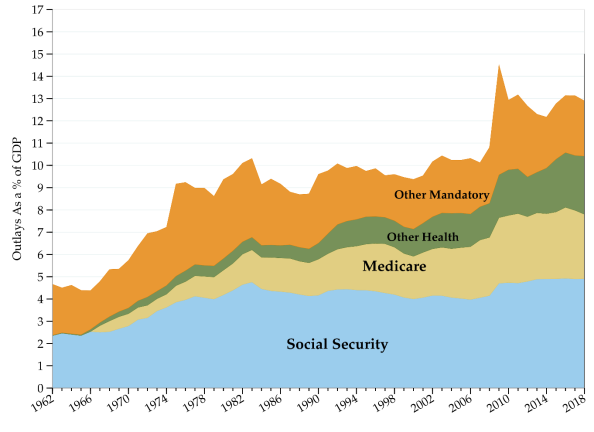
Mandatory Trends and Legislative Changes Figure 5 shows trends among major categories of mandatory spending as shares of GDP, as well as selected laws and events that have affected mandatory spending trends. Those categories are the Social Security program, Medicare program, Other Health, and Other Mandatory. The Other Health category contains a variety of public health and related programs, but does not include most veterans’ health care spending, which is supported by discretionary funding. Other mandatory spending includes costs of income-security programs, such as the federal portion of unemployment insurance, along with certain veterans’ programs, federal retirement, and several other smaller programs.
The growth in Social Security spending as a percentage of GDP reflects an expansion of the proportion of workers covered by the program, demographic changes, and changes in benefits. During the 1960s and 1970s, the Baby Boomer cohorts were entering their peak earning years, while retirees were chiefly from smaller cohorts born before World War II.
Medicare and Medicaid spending as a proportion of GDP has risen consistently since those programs were established in 1965. In its original form, Medicare comprised a mandatory hospital insurance program (Part A) and voluntary physician services insurance (Part B).
Congressional Research Service
7
Trends in Mandatory Spending
Medicaid replaced earlier federal-state programs for very low-income households.15 Rising costs for those programs reflected both expanded access to health care as well as rising prices.16
Figure 5. Components of Mandatory Outlays Since FY1962
Source: CRS calculations based on OMB data from FY2024 budget submission. Notes: Other Health includes Medicaid and other public health programs. Discretionary spending funds most veterans’ health programs. FY2023 data are estimated; levels for later years reflect Administration proposals and projections.
Some other key legislative actions include the changes made to Social Security in 1983 following recommendations of the Greenspan Commission to raise contributions and reduce certain benefits17 and the Budget Enforcement Act of 1990 (BEA; P.L. 101-508), which set statutory pay-as-you-go (PAYGO) limits that constrained spending increases and revenue reductions.18 Some
15 Paul Starr, The Social Transformation of American Medicine (New York: Basic Books, 1982). 16 Luca Lorenzoni, Annalisa Belloni, and Franco Sassi, “Health-Care Expenditure and Health Policy in the USA versus Other High-Spending OECD Countries,” Lancet, vol. 384 (July 2014), pp. 83-92. Also see Uwe E. Reinhardt, Priced Out: The Economic and Ethical Costs of American Health Care (Princeton, 2019).
17 John A. Svahn and Mary Ross, “Social Security Amendments of 1983: Legislative History and Summary of Provisions,” Social Security Bulletin, vol. 46, no. 7 (July 1983), https://www.ssa.gov/policy/docs/ssb/v46n7/v46n7p3.pdf.
18 Michael Kell, “Budget Enforcement Act and Options for Reform,” in U.S. Fiscal Policies and Priorities for Long-Run Sustainability: U.S. Fiscal Policies and Priorities for Long-Run Sustainability (ed. Martin Mühleisen and Christopher M. Towe), International Monetary Fund, January 2004, https://www.elibrary.imf.org/display/book/9781589062955/C6.xml?tabs=fulltext.
Congressional Research Service
8
link to page 6 link to page 11 Trends in Mandatory Spending
contend that those limits helped motivate policymakers to enact changes in certain income support and health care programs in the late 1990s.19 The BEA budgetary limits were extended through the end of the 1990s, when the federal government ran four years of budget surpluses, but lapsed shortly after the attacks of September 11, 2001.20
In 2003, the Medicare Modernization Act (P.L. 108-173) created a prescription drug benefit for Medicare beneficiaries (Part D)21 and expanded options for privately administered Medicare Advantage plans (Part C), in which beneficiaries could enroll in lieu of traditional Medicare.22
In 2010, enactment of the Patient Protection and Affordable Care Act (PPACA or ACA; P.L. 111-148) created subsidies to help low- and middle-income households afford health insurance, provided an option for the expansion of Medicaid benefits, and modified many federal regulations governing health insurance markets.
The Budget Control Act of 2011 (BCA; P.L. 112-25) established statutory caps on discretionary spending through FY2021 as well as an annual sequester of non-exempt mandatory spending, which has been extended multiple times. Sequestration of Medicare payments for patient care was initially limited to 2%. Mandatory sequestration totaled $17 billion in FY2013, the first sequester year, rising to $20 billion in FY2021. Medicare reductions accounted for roughly two-thirds of the mandatory sequester.23
Two Major Fiscal Shocks Elevated Mandatory Spending
Although costs of federal health care and social insurance programs have shaped the longer trajectory of mandatory spending, two major fiscal shocks—the 2007-2009 financial crisis and the COVID-19 pandemic—also elevated mandatory spending. Peaks in federal spending related to those shocks are visible in Figure 1 and Figure 5. Those shocks in turn helped lead to large deficits, both reducing federal revenues and increasing spending, which contributed to substantial increases in federal debt.
The federal government’s capacity to respond to major shocks through automatic stabilizer mechanisms that lead to lower tax collections and higher income-support payments when household incomes decline, as well as through legislative responses to shocks, mitigates the adverse consequences of those fiscal shocks. That capacity rests on the government’s ability to spread costs over long time periods by issuing debt. High levels of debt growing at rates exceeding the U.S. economy’s growth rate, however, would at some point impair the government’s ability to service those debts.24
19 Allan Schick and Felix Lostracco, The Federal Budget: Politics, Policy, Process, rev. ed. (Washington: Brookings Institution, 2000).
20 See archived CRS Report RS21378, Termination of the “Pay-As-You-Go” (PAYGO) Requirement for FY2003 and Later Years, by Robert Keith, available to congressional clients upon request.
21 Gretchen Jacobson and Gerard Anderson, “Medicare Part D: Ongoing Challenges for Doctors and Patients,” Annual Review of Medicine, vol. 61, no. 1 (2010), pp. 469-476.
22 Rajender Agarwal et al., “Comparing Medicare Advantage and Traditional Medicare: A Systematic Review,” Health Affairs, vol. 40, no. 6 (June 2021), https://www.healthaffairs.org/doi/full/10.1377/hlthaff.2020.02149.
23 CRS Memorandum, “The Evolution of Budget Control Act of 2011 Caps on Discretionary Spending,” September 5, 2019, available upon request to congressional clients. Also see CRS Report R44874, The Budget Control Act: Frequently Asked Questions, by Grant A. Driessen and Megan S. Lynch.
24 See CRS Report RL33657, Running Deficits: Positives and Pitfalls, by D. Andrew Austin.
Congressional Research Service
9
link to page 14 link to page 14 Trends in Mandatory Spending
2007-2009 Financial Crisis and the Great Recession
In summer 2007, problems with some securities backed by subprime mortgages emerged.25 Similar subprime mortgage securities led to the collapse of the investment banks Bear Stearns in February 2008 and Lehman Brothers in September 2008. In addition, in September 2008, the government-sponsored mortgage giants Fannie Mae and Freddie Mac were placed in federal conservatorships.26 Consequences of that financial crisis spread through the rest of the economy, leading to the Great Recession, perhaps the most severe economic downturn since the Great Depression of the 1930s. Elevated unemployment rates and other signs of economic distress prompted large fiscal policy responses,27 including spending increases and tax (revenue) reductions aimed at supporting economic activity, which led to a series of large federal deficits.
The COVID-19 Pandemic
The COVID-19 pandemic presented governments around the world, including the U.S. government, with extreme fiscal challenges beginning in 2020. The bulk of the fiscal responses to the Great Recession came through mandatory spending or automatic stabilizers, which result in high income-support outlays and lower tax revenues during economic downturns, as well as through tax reductions. Table 1 shows mandatory outlays for major programs set up to respond to the COVID-19 pandemic and its economic and health consequences. The COVID-19 pandemic affected many other federal programs as well.
For both the 2007-2009 financial crisis and the COVID-19 pandemic, most federal fiscal responses tapered off after a few years. For instance, spending on the mandatory programs shown in Table 1 in FY2023 (according to Congressional Budget Office [CBO] estimates) is less than one-seventh of the level of funding for FY2020, the first fiscal year of the pandemic.
The cost of those responses, along with reductions in tax collections and other COVID-19 related spending, resulted in a large increase in federal debt levels.
25 New York Times, “BNP Paribas Suspends Funds Because of Subprime Problems,” August 9, 2007, https://www.nytimes.com/2007/08/09/business/worldbusiness/09iht-09bnp.7054054.html.
26 Final Report of the National Commission on the Causes of the Financial and Economic Crisis in the United States, submitted pursuant to P.L. 111-21, January 2011, https://www.govinfo.gov/content/pkg/GPO-FCIC/pdf/GPO-FCIC.pdf.
27 Evan Cunningham, “Great Recession, Great Recovery? Trends from the Current Population Survey,” Monthly Labor Review, April 2018, https://www.bls.gov/opub/mlr/2018/article/great-recession-great-recovery.htm.
Congressional Research Service
10
Trends in Mandatory Spending
Table 1. Major Mandatory COVID-19 Responses
Outlays in $billions
Total
FY2020-
Program
FY2020 FY2021 FY2022 FY2023
FY2023
Small Business Administration
$552
$313
$6
$24
$896
Coronavirus State and Local Fiscal Recovery Funds
$149
$243
$106
$6
$505
/ Coronavirus Relief Fund
Air carrier worker support
$28
$31
$0
$0
$59
Education Stabilization Fund
$0
$9
$45
$53
$107
Public Health and Social Services Emergency Fund
$0
$5
$30
$18
$53
Emergency rental assistance
$0
$33
$10
$3
$46
Subtotal
$730
$635
$196
$104
$1,665
Sources: CRS analysis of OMB historical data and May 2023 CBO baseline estimates. Notes: Does not include all mandatory programs affected by COVID-19-related legislation. Some Small Business Administration mandatory outlays are related to non-COVID programs. In FY2019, that agency’s mandatory outlays totaled -$0.7 bil ion, mainly due to downward estimates of loan subsidy costs.
Legislation Affecting Mandatory Spending in 2022
Several measures enacted in 2022 have affected the trajectory of mandatory spending. Overall, CBO estimated that those measures would increase estimated mandatory spending over the FY2023-FY2033 period by about 2%.28 Those measures include an expansion of veterans’ benefits related to toxic exposures (P.L. 117-168);29 subsidies for semiconductor manufacture (division A of P.L. 117-167);30 and the FY2023 consolidated appropriations act (2023 CAA; P.L. 117-328) that included the Honoring Our PACT Act of 2022, which provided $5 billion in mandatory funding for the Cost of War Toxic Exposures Fund.31
The reconciliation measure known as the Inflation Reduction Act (IRA; P.L. 117-169) allowed Medicare to negotiate prices for a limited number of drugs, extended certain ACA subsidies, provided $80 billion in funding for Internal Revenue Service (IRS) operations, and funded various initiatives to address climate change.32 The IRA also included tax provisions to offset the costs of that funding.33 The Fiscal Responsibility Act of 2023 (P.L. 118-5), which resolved a debt
28 CBO, Budget and Economic Outlook 2023-2033, February 2023, https://www.cbo.gov/publication/58946#_idTextAnchor109.
29 See CRS Report R47542, Honoring Our PACT Act of 2022 (P.L. 117-168): Expansion of Health Care Eligibility and Toxic Exposure Screenings, by Sidath Viranga Panangala.
30 See CRS Report R47523, Frequently Asked Questions: CHIPS Act of 2022 Provisions and Implementation, by John F. Sargent Jr., Manpreet Singh, and Karen M. Sutter.
31 House Committee on Appropriations, Consolidated Appropriations Act, 2023 Summary of Appropriations Provisions by Subcommittee, December 20, 2022, https://appropriations.house.gov/sites/democrats.appropriations.house.gov/files/FY23%20Summary%20of%20Appropriations%20Provisions.pdf.
32 Justin Badlam et al., “The Inflation Reduction Act: Here’s What’s in it,” McKinsey & Co., October 24, 2022, https://www.mckinsey.com/industries/public-sector/our-insights/the-inflation-reduction-act-heres-whats-in-it.
33 See CRS Report R47202, Tax Provisions in the Inflation Reduction Act of 2022 (H.R. 5376), coordinated by Molly F. Sherlock.
Congressional Research Service
11
Trends in Mandatory Spending
limit episode, rescinded $20 billion of IRS mandatory funding and certain COVID-19 funding, among other provisions.34
Mandatory Spending in Coming Decades Over the next decade, mandatory spending is projected to stabilize at about 14.1% of GDP before rising in the first years of the 2030s.35 Discretionary spending, an estimated 6.7% of GDP in FY2023, is projected to decline gradually to 6.0% of GDP in FY2033. The two largest components of mandatory spending, as shown above, are Social Security and major federal health care programs, such as Medicare and Medicaid.
Health Care Costs
In the short term, health care costs are expected to moderate, as COVID-19-era programs and expanded eligibility provisions expire. Much of the projected medium-term increase in mandatory spending stems from rising per capita health care costs and the demographic effects of an aging population.36 Baby Boomers—those born after World War II and before the early 1960s—are now retiring in large numbers. For instance, the number of retired workers receiving Social Security (Old Age and Survivors Insurance) benefits is projected to increase from 57.2 million in 2022 (latest actual data) to 71.9 million in 2035.37 In addition, the proportion of retirees over age 85—whose health care needs are typically greater than younger retirees—has been rising steadily, thus increasing the expected flow of federal benefits.
In the decade preceding the COVID-19 pandemic, health care costs in both the public and private sectors rose more slowly relative to prior projections and average historical trends.38 Although the moderation in growth of health care costs per beneficiary improved the federal government’s fiscal situation, concerns remain about continued increases in health care costs. Projections from the DHHS Centers for Medicare and Medicaid Services (CMS) for 2025-2031 anticipate that national health spending will grow at an average rate of 5.6%, higher than the projected GDP growth rate of 4.2%, largely because medical prices are expected to grow faster, at a 2.8% pace, than expected economywide price growth, averaging 2.1% per year.39
Social Security and Medicare Trust Funds
Some federal trust funds, according to trustees’ projections, will be exhausted in the next two decades.40 The Social Security Old Age and Survivors Insurance (OASI) trust fund is projected to be exhausted by 2033. The Social Security Disability Insurance (DI) trust fund, however, would
34 CBO, “How the Fiscal Responsibility Act of 2023 Affects CBO’s Projections of Federal Debt,” June 2023, https://www.cbo.gov/publication/59260.
35 Baseline projections of mandatory spending rise to 14.6% of GDP in FY2028, largely due to year-end timing effects. 36 Sean P. Keehan et al., “National Health Expenditure Projections, 2022-2031: Growth to Stabilize Once The COVID-19 Public Health Emergency Ends,” Health Affairs, vol. 42, no. 7 (July 2023), https://www.healthaffairs.org/doi/full/10.1377/hlthaff.2023.00403 (hereinafter “Keehan et al. (2023)”).
37 Social Security Administration, 2023 Annual Report of the Board of Trustees of the Federal Old-Age and Survivors Insurance and Federal Disability Insurance Trust Funds, June 5, 2018, Table V.C.4, https://www.ssa.gov/OACT/TR/2023/V_C_prog.html#1060201.
38 Melinda Buntin et al., “Trends in and Factors Contributing to the Slowdown in Medicare Spending Growth, 2007-2018,” JAMA Health Forum, vol. 3, no. 12 (December 2, 2022), https://jamanetwork.com/journals/jama-health-forum/fullarticle/2799212.
39 Keehan et al. (2023). 40 See CRS In Focus IF10522, Social Security’s Funding Shortfall, by Barry F. Huston.
Congressional Research Service
12
Trends in Mandatory Spending
not be exhausted before 2097, the end of the 75-year projection window, under current policies according to those projections.41 The Medicare Health Insurance (HI) trust fund, which supports Part A benefits, is projected to be exhausted in 2031.42 After trust funds were exhausted, programs would pay reduced levels of benefits supported by current revenues.43 The Medicare Supplemental Medical Insurance (SMI; Part B) trust fund is not vulnerable to exhaustion because of the structure of its funding, although rising Part B premiums and costs to the general fund could present other challenges.
In some cases, Congress has chosen to use general fund resources to replenish trust funds that were exhausted due to the imbalance between revenues and outlays. For instance, the Infrastructure Investment and Jobs Act (IIJA; P.L. 117-58), enacted in November 2021, transferred $118 billion from the Treasury general fund to the Highway Trust Fund.44
Long-Term Challenges Over the long term, projections suggest that if current policies remain unchanged, the federal government could face major fiscal imbalances. According to CBO’s extended baseline projections, Social Security would grow from 5.1% of GDP in FY2023 to 6.0% of GDP by FY2023 and 6.2% by FY2043. Federal mandatory spending on major health care programs is projected to expand from about 5.8% of GDP in FY2023 to 6.6% in FY2033 and to 8.0% by FY2043.45
If the divergence between federal outlays and revenues is not narrowed, deficits will continue at high levels, leading to increases in federal debts. Interest rates in the past decade were low, which eased debt service burdens. Some economists have argued that a low-interest-rate environment lowers the costs of larger public debts and mitigates their effect on economic efficiency, although managing high debt levels requires heightened attention to uncertainty and risk.46
In recent years, interest rates have risen, which has pushed up federal debt service costs. Although trends that had previously pushed down interest rates may reassert themselves, higher debt levels increase risks that debt service costs could become a major burden to federal finances.47
While lower interest rates ease debt service burdens, lower real interest rates over longer time horizons are linked to slower rates of economic growth.48 The aging of the U.S. population and the increasing proportion of retirees is expected to reduce labor participation rates, which in turn lowers the rate of potential economic growth. Stabilizing a country’s ratio of public debt to GDP
41 Social Security Administration, A Summary of the 2023 Annual Reports, website, updated March 2023, https://www.ssa.gov/oact/TRSUM/, especially section C(5)(a). Also see CRS Report RL33028, Social Security: The Trust Funds, by Barry F. Huston. Although the 2015 Social Security Trustees Report had projected that the DI trust fund would be exhausted in 2016, since then its finances have strengthened. Disability applications increased during the 2007-2009 Great Recession, but fell below expected levels afterwards.
42 Ibid. 43 CBO’s long-term extended baseline projections presume that full Social Security and Medicare benefits would be paid after trust funds were exhausted. See CBO, The 2023 Long-Term Budget Outlook, June 28, 2023, https://www.cbo.gov/publication/59014.
44 See CRS Report R47573, Funding and Financing Highways and Public Transportation Under the Infrastructure Investment and Jobs Act (IIJA), by Robert S. Kirk and William J. Mallett.
45 CBO, The 2023 Long-Term Budget Outlook, June 28, 2023, https://www.cbo.gov/publication/59014. 46 Olivier Blanchard, Fiscal Policy under Low Interest Rates (Cambridge, Mass.: MIT, 2023). 47 Ibid. 48 In standard economic models, the rate of economic growth and the interest rate will be linked through the marginal return on capital.
Congressional Research Service
13
Trends in Mandatory Spending
becomes more challenging when economic growth slows. Thus, while lower interest rates ease debt burdens, slower economic growth increases them.
Policy Options The powers of the purse that the Constitution grants Congress charge it with “collect[ing] Taxes, Duties, Imposts, and Excises, [paying] the Debts and provid[ing] for the common Defense and general Welfare of the United States.” Addressing challenges posed by current trends in mandatory spending would require balancing what taxes are to be collected and what is provided to support the general welfare, while managing debts at a sustainable level.
The structure of mandatory programs, as with revenue policies, creates a system of automatic stabilizers that promotes macroeconomic stability by supporting households affected by economy-side shocks. Automatic stabilizers help preserve economic potential to some extent, but also postpone the burdens of those economic shocks to some extent. Rising public debt levels over time can lead to other fiscal shocks if markets lose confidence in the management of public finances. Other trends, such as climate change, may pose other risks to future fiscal policy.49
Because discretionary spending is a smaller proportion of total federal outlays compared to mandatory spending, some budget experts contend that significant reductions in federal spending would have to include cuts in mandatory spending programs. Some contend that further reductions in discretionary spending—now at historically low levels as a share of the economy—that would make a material difference in the federal government’s fiscal trajectory would hinder federal agencies’ ability to meet national priorities. In addition, some policymakers argue that higher taxes needed to finance projected future mandatory spending trajectories would slow economic growth.
Other budget and social policy experts contend that changes in social insurance programs should be considered on their own merits, and should not bear the burden of larger budgetary adjustments. Many mandatory programs—including Social Security, Medicare, and Medicaid—play key roles in individuals’ retirement and have reduced serious financial risks facing households. Sudden changes in such programs could disrupt many citizens’ retirement plans. Reflecting the long-term perspective inherent in retirement decisionmaking, Social Security finances were designed so that benefits are paid from federal trust funds derived from payroll taxes rather than general revenues. More generally, in that view, curtailing entitlement program eligibility or benefits would compromise program goals: the economic security of the elderly and the poor.
Some Members of Congress and former Members have called for establishment of a fiscal commission to address these challenges.50 Others have argued that Congress itself is the proper venue to consider fiscal challenges.
Several past policy initiatives may provide templates for future approaches to addressing fiscal policy. The Greenspan Commission, which in 1983 recommended some measures to limit outlays, such as raising retirement ages, as well as raising contribution rates, is an example of an
49 See CRS In Focus IF11827, Climate Change: Defining Adaptation and Resilience, with Implications for Policy, by Jane A. Leggett. For further information, congressional offices may contact Deputy Assistant Director Steven M. Lev.
50 U.S. Congress, House Committee on the Budget, Sounding the Alarm: Examining the Need for a Fiscal Commission, 118th Cong., 1st sess., October 19, 2023, https://budget.house.gov/hearing/sounding-the-alarm-examining-the-need-for-a-fiscal-commission.
Congressional Research Service
14
Trends in Mandatory Spending
approach to addressing Social Security’s financing challenges.51 The 1990 Budget Enforcement Act (P.L. 101-508) provides one model of addressing fiscal challenges by establishing a budget enforcement framework aimed at bolstering federal revenues and constraining outlays. The Base Realignment and Closure (BRAC) process to reduce the number of U.S. military installations, in which an independent commission put forth recommendations based on uniform criteria and enacted with the help of expedited procedures in Congress, might serve as another model.52 More recently, some have proposed revamping health care financing arrangements to enhance the efficiency of the health care system.53
51 Report of the National Commission on Social Security Reform, January 1983, https://www.ssa.gov/history/reports/gspan.html.
52 See archived CRS Report R45705, Base Closure and Realignment (BRAC): Background and Issues for Congress, by Christopher T. Mann. For further information, congressional offices may contact Section Research Manager Michael J. Vassalotti.
53 Uwe E. Reinhardt, Priced Out: The Economic and Ethical Costs of American Health Care (Princeton, 2019), pp. 99-139. Also see Liran Einav and Amy Finkelstein, We've Got You Covered: Rebooting American Health Care (New York: Penguin, 2023).
Congressional Research Service
15
link to page 20 link to page 20 Trends in Mandatory Spending
Appendix. Baseline Projections of Mandatory Spending in the Next Decade The Congressional Budget Office (CBO) calculates a current-law baseline that projects federal spending and receipts over a 10-year window. Projected mandatory spending trends reflect eligibility requirements, benefit formulas, economic trends, and changes in demographics. Table A-1 presents a breakdown of mandatory spending in recent years along with May 2023 CBO current-law baseline projections.
Congressional Research Service
16
link to page 21 link to page 21 link to page 21 link to page 22 link to page 22 link to page 22
Table A-1. Mandatory Outlays, FY2020-FY2033, CBO Current-Law Baseline Projections
Billions of current dollars; Actual (FY2020-FY2022), Estimated (FY2023), and Projected (FY2024-FY2033)
Program Category
2020
2021
2022
2023
2024
2025
2026
2027
2028
2029
2030
2031
2032
2033
Social Security
$1,090 $1,129 $1,212 $1,345 $1,457 $1,554 $1,644 $1,732 $1,826 $1,924 $2,028 $2,137 $2,250 $2,365
Old-Age & Survivors Insurance
$945
$988
$1,070 $1,195 $1,299 $1,387 $1,468 $1,545 $1,634 $1,725 $1,822 $1,923 $2,028 $2,134
Disability Insurance
$144
$141
$143
$149
$158
$166
$176
$186
$192
$199
$206
$214
$222
$232
Major Health Programs
$1,445 $1,476 $1,669 $1,708 $1,670 $1,792 $1,882 $2,013 $2,224 $2,212 $2,443 $2,607 $2,788 $3,103
Medicarea
$912
$868
$975
$1,008 $1,012 $1,128 $1,201 $1,290 $1,460 $1,402 $1,587 $1,702 $1,828 $2,088
Medicaid
$458
$521
$592
$594
$538
$537
$574
$613
$650
$690
$733
$777
$826
$879
Health insurance subsidies & relatedb
$57
$72
$86
$88
$103
$110
$89
$91
$95
$99
$103
$107
$114
$121
CHIP
$17
$16
$17
$17
$17
$18
$18
$19
$20
$20
$21
$22
$20
$15
Income Security
$1,051 $1,376
$581
$430
$404
$405
$407
$397
$408
$400
$411
$418
$428
$441
Earned income, child, & other tax creditsc
$380
$733
$252
$107
$95
$98
$99
$84
$85
$84
$84
$84
$84
$84
SNAP
$86
$135
$149
$145
$127
$123
$121
$122
$121
$120
$120
$121
$124
$125
Supplemental Security Income
$57
$56
$61
$60
$57
$63
$65
$67
$74
$65
$72
$74
$76
$85
Unemployment compensation
$472
$392
$33
$35
$49
$48
$48
$48
$49
$49
$51
$53
$55
$56
Family support & foster cared
$33
$35
$47
$49
$42
$35
$35
$36
$36
$36
$37
$37
$37
$38
Child nutrition
$24
$27
$39
$34
$35
$37
$39
$41
$43
$45
$47
$49
$51
$53
Federal Retirement
$171
$174
$187
$196
$202
$217
$225
$231
$243
$237
$249
$256
$264
$278
Civiliane
$109
$116
$116
$122
$128
$134
$139
$142
$146
$149
$153
$157
$163
$167
Military
$62
$63
$72
$74
$74
$83
$86
$89
$97
$87
$96
$99
$102
$111
Veteransf
$122
$125
$161
$172
$198
$227
$249
$267
$306
$286
$324
$342
$362
$404
Income security
$110
$116
$140
$150
$147
$172
$184
$196
$225
$199
$227
$237
$247
$279
Toxic exposures fund
$0
$0
$0
$5
$36
$41
$50
$57
$65
$72
$81
$89
$97
$104
Other
$12
$9
$21
$18
$15
$14
$15
$15
$16
$15
$16
$17
$18
$20
CRS-17
link to page 22 link to page 22 link to page 22 link to page 22 link to page 22
Program Category
2020
2021
2022
2023
2024
2025
2026
2027
2028
2029
2030
2031
2032
2033
Other Programs
$977
$873
$827
$480
$244
$209
$190
$184
$181
$172
$167
$160
$138
$145
Agriculture
$31
$37
$17
$27
$20
$18
$17
$21
$22
$22
$21
$19
$19
$19
MERHCFg
$11
$11
$11
$12
$12
$13
$14
$14
$15
$16
$17
$17
$18
$19
Deposit Insurance
-$7
-$9
-$12
$22
-$7
-$7
-$9
-$12
-$13
-$14
-$14
-$15
-$15
-$14
Fannie Mae and Freddie Mach
$0
$0
$0
$0
$8
$5
$3
$2
$2
$2
$3
$5
$7
$13
Higher education
$124
$143
$488
$109
$22
$23
$24
$25
$25
$25
$25
$25
$26
$26
COVID-19 responses
$730
$635
$196
$104
$47
$26
$7
$1
$0
$0
$0
$0
$0
$0
Other
$88
$56
$139
$163
$140
$135
$135
$138
$136
$125
$121
$113
$90
$89
Offsetting Receipts
-$277
-$333
-$505
-$351
-$346
-$380
-$392
-$424
-$449
-$469
-$503
-$534
-$555
-$594
Medicarei
-$143
-$179
-$227
-$182
-$185
-$211
-$218
-$238
-$258
-$280
-$303
-$328
-$357
-$391
Federal share: Federal employees’ retirement
-$84
-$92
-$99
-$104
-$103
-$108
-$112
-$116
-$120
-$124
-$128
-$132
-$136
-$140
Civil service retirement and other
-$43
-$47
-$53
-$54
-$56
-$59
-$62
-$64
-$67
-$69
-$71
-$74
-$76
-$79
Military retirement
-$22
-$25
-$26
-$28
-$24
-$25
-$26
-$27
-$27
-$28
-$29
-$30
-$30
-$31
Social Security
-$19
-$20
-$21
-$22
-$23
-$24
-$24
-$25
-$26
-$27
-$28
-$29
-$30
-$31
Fannie Mae and Freddie Mach
-$4
-$5
-$6
-$6
$0
$0
$0
$0
$0
$0
$0
$0
$0
$0
MERHCFg
-$8
-$9
-$10
-$10
-$11
-$12
-$12
-$13
-$13
-$14
-$15
-$15
-$16
-$17
Natural Resources
-$10
-$12
-$24
-$18
-$18
-$17
-$17
-$17
-$17
-$18
-$19
-$19
-$19
-$20
Other
-$29
-$37
-$138
-$30
-$29
-$32
-$32
-$40
-$41
-$33
-$39
-$39
-$26
-$26
Total Mandatory Outlays
$4,578 $4,820 $4,133 $3,980 $3,828 $4,023 $4,205 $4,400 $4,738 $4,760 $5,120 $5,386 $5,675 $6,141
Source: CRS analysis of CBO, An Update to the Budget Outlook: 2023 to 2033, May 2023; previous Budget and Economic Outlook editions; and Office of Management and Budget data from the FY2024 budget submission. Adjustments for fiscal year timing effects are not included. Notes: Items may not sum to totals due to rounding. Figures for FY2020-FY2022 are actual; figures for FY2023 are estimated; figures for FY2024-FY2033 are CBO current-law baseline projections. a. Excludes offsetting receipts. b. Includes cost of health insurance policy subsidies obtained through Affordable Care Act (P.L. 111-148) marketplaces. c. Includes outlays for the American Opportunity credit and other tax credits.
CRS-18
d. Includes outlays for the American Opportunity credit and other tax credits.
c. Includes Temporary Assistance for Needy Families (TANF), the Child Support Enforcement program, the Child Care Entitlement program, and other programs.
d. e. Includes Civil Service, Foreign Service, Coast Guard, and other, smaller retirement programs as well as annuitants'’ health benefits.
e. f.
Income security includes veterans'’ compensation, pensions, and life insurance programs. Other benefits are primarily education subsidies.
f.
g. MERHCF is the Department of Defense Medicare-Eligible Retiree Health Care Fund, including TRICARE For Life.
g. h. The Administration records cash payments from Fannie Mae and Freddie Mac to the Treasury as offsetting receipts, while Treasury'’s payments to those entities are
recorded as outlays (if any). CBO, however, treats the operations of these entities similar to other federal credit agencies and estimates their net lifetime cost (i.e., a subsidy cost adjusted for market risk) and records that as outlays for the program. The above table reflects the Administration's methodology for FY2014 and FY2015. Beginning in 2016, the table reflects CBO'shows CBO’s estimate of net lifetime costs of the guarantees that those entities will issuewil issue in a given fiscal year and of the loans that they will hold.
h. wil hold.
i.
Includes Medicare premiums and amounts paid by states from savings on Medicaid prescription drug costs.
CRS-19
Trends in Mandatory Spending
Author Information
D. Andrew Austin
Analyst in Economic Policy
Disclaimer
This document was prepared by the Congressional Research Service (CRS). CRS serves as nonpartisan shared staff to congressional committees and Members of Congress. It operates solely at the behest of and under the direction of Congress. Information in a CRS Report should not be relied upon for purposes other than public understanding of information that has been provided by CRS to Members of Congress in connection with CRS’s institutional role. CRS Reports, as a work of the United States Government, are not subject to copyright protection in the United States. Any CRS Report may be reproduced and distributed in its entirety without permission from CRS. However, as a CRS Report may include copyrighted images or material from a third party, you may need to obtain the permission of the copyright holder if you wish to copy or otherwise use copyrighted material.
Congressional Research Service
R44641 · VERSION 6 · UPDATED
20 Includes Medicare premiums and amounts paid by states from savings on Medicaid prescription drug costs.
Over the next decade, mandatory spending is projected to continue rising. By FY2022, if current trends continue, the sum of Medicare and Medicaid outlays would exceed all discretionary outlays.5 Moreover, Social Security outlays would also exceed discretionary outlays by FY2025, according to CBO baseline projections.6 By FY2028, mandatory spending is projected to reach 15% of GDP, while discretionary spending is projected to fall to 5.4% of GDP, its lowest level in modern history.
Much of the projected increase in mandatory spending stems from rising per capita health care costs and the demographic effects of an aging population.7 Baby Boomers—those born after World War II and before the early 1960s—are now retiring in large numbers. For instance, the number of retired workers receiving Social Security (Old Age and Survivors Insurance) benefits is projected to increase from 42.5 million in 2017 (latest actual data) to almost 55 million in 2025.8 In addition, the proportion of retirees over age 85—whose health care needs are typically greater than younger retirees—has been rising steadily, thus increasing the expected flow of federal benefits.
Health care costs per beneficiary have moderated in recent years. In both the public and private sectors, health care costs rose more slowly in the past decade relative to prior projections and average historical trends.9 While the moderation in growth of health care costs per beneficiary has improved the federal government's fiscal situation, concerns remain that health care cost growth could rebound.10
Mandatory Spending in Coming Decades
Over the long term, projections suggest that if current policies remain unchanged, the United States could face major fiscal imbalances. According to CBO's extended baseline projections, Social Security would grow from 4.9% of GDP in FY2018 to 6.0% of GDP by FY2028 and 6.3% by FY2048. Federal mandatory spending on health care is projected to expand from about 5.2% of GDP in FY2018 to 6.8% in FY2028 and to 9.2% by FY2048.11 CBO's extended baseline projections imply that the fiscal adjustment needed to stabilize the level of federal debt held by the public as a percentage of GDP at its current level (78%) would be about 1.9% of GDP for each future year. That adjustment in FY2019 would be equivalent to an 18% increase in federal revenues or a 14% cut in outlays, but could be made by a combination of revenue and spending policies.
Some federal trust funds, according to trustees' projections, would be exhausted in the next two decades. The Social Security Old Age and Survivors Insurance (OASI) trust fund would be exhausted in 2034 and the Social Security Disability Insurance (DI) trust fund would be exhausted by 2032 under current policies according to those projections.12 The Medicare Health Insurance (HI) trust fund, which supports Part A benefits, is projected to be exhausted in 2026.13 After trust funds were exhausted, programs would pay reduced levels of benefits supported by current revenues.14 The Medicare Supplemental Medical Insurance (SMI; Part B) trust fund is not vulnerable to exhaustion because of the structure of its funding, although rising Part B premiums and costs to the general fund could present other challenges.
Policy Options
Because discretionary spending is a smaller proportion of total federal outlays compared to mandatory spending, some budget experts contend that significant reductions in federal spending would have to include cuts in mandatory spending programs. Some contend that further reductions in discretionary spending—now at historically low levels as a share of the economy—would hinder federal agencies' ability to meet national priorities. In addition, some policymakers argue that higher taxes needed to finance projected future mandatory spending trajectories would slow economic growth.
Other budget and social policy experts contend that changes in social insurance programs should be considered on their own merits, and should not bear the burden of larger budgetary adjustments. Many mandatory programs—including Social Security, Medicare, and Medicaid—play key roles in individuals' retirement. Sudden changes in such programs could disrupt retirement plans of many citizens. Reflecting the long-term perspective inherent in retirement decisionmaking, Social Security finances were designed so that benefits are paid from federal trust funds derived from payroll taxes rather than general revenues. More generally, in that view, curtailing entitlement program eligibility or benefits would compromise program goals: the economic security of the elderly and the poor.
Author Contact Information
Footnotes
| 1. |
Following that definition, interest paid on federal debt might also be considered a type of mandatory spending because those payments are authorized by a permanent appropriation. Net interest, however, is always reported separately in budget documents, which distinguishes programmatic costs from debt service costs. |
| 2. |
See CRS Report R40425, Medicare Primer, coordinated by [author name scrubbed]. |
| 3. |
See CRS In Focus IF10322, Medicaid Primer, by [author name scrubbed]. |
| 4. |
See CRS Report RL30023, Federal Employees' Retirement System: Budget and Trust Fund Issues, by [author name scrubbed]. |
| 5. |
Baseline projections assume that discretionary spending is held constant in inflation-adjusted terms. |
| 6. |
CBO, Budget and Economic Outlook: 2018 to 2028, April 2018, https://www.cbo.gov/publication/53651. |
| 7. |
Gigi A. Cuckler et al., "National Health Expenditure Projections 2017–26: Despite Uncertainty, Fundamentals Primarily Drive Spending Growth," Health Affairs 37(3), February 2018. |
| 8. |
Social Security Administration, 2018 Annual Report of the Board of Trustees of the Federal Old-Age and Survivors Insurance and Federal Disability Insurance Trust Funds, June 5, 2018, Table V.C.4, https://www.ssa.gov/oact/TR/2018/tr2018.pdf. |
| 9. |
Cuckler (2018). |
| 10. |
PricewaterhouseCoopers Health Research Institute, Medical Cost Trend: Behind the Numbers 2016, June 2015, https://commissiononcare.sites.usa.gov/files/2016/01/20151116-05-Medical_Cost_Trend-Behind_the_Numbers_2016_PWC.pdf. |
| 11. |
CBO, 2018 Long-Term Budget Outlook, June 26, 2018, p. 12, https://www.cbo.gov/publication/53919. |
| 12. |
Social Security Administration, A Summary of the 2018 Annual Reports, website, updated June 5, 2018, https://www.ssa.gov/oact/TRSUM/. |
| 13. |
Ibid. |
| 14. |
CBO's long-term extended baseline projections presume that full Social Security and Medicare benefits would be paid after trust funds were exhausted. See CBO, The 2018 Long-Term Budget Outlook, June 2018. |