Carbon Capture and Sequestration (CCS) in the United States
Changes from August 9, 2018 to October 18, 2021
This page shows textual changes in the document between the two versions indicated in the dates above. Textual matter removed in the later version is indicated with red strikethrough and textual matter added in the later version is indicated with blue.
Contents
- CCS Primer
- CO2 Capture
- Post-combustion Capture
- Precombustion Capture
- Oxy-Fuel Combustion Capture
- CO2 Transport
- CO2 Sequestration
- Oil and Gas Reservoirs
- Deep Saline Reservoirs
- Unmineable Coal Seams
- Carbon Utilization
- Direct Air Capture
- Coal-Fired Power Plants with CCS
- Petra Nova: The First (and Only) Large U.S. Power Plant with CCS
- Boundary Dam: World's First Addition of CCS to a Large Power Plant
- The DOE CCS Program
- Coal CCS and Power Systems
- Other Fossil Energy Research and Development
- CCS-Related Legislation in the 115th Congress
- Discussion
Figures
- Figure 1. The CCS Process
- Figure 2. Diagram of Post-Combustion CO2 Capture in a Coal-Fired Power Plant Using an Amine Scrubber System
- Figure 3. Diagram of Precombustion CO2 Capture from an IGCC Power Plant
- Figure 4. Diagram of Oxy-Combustion CO2 Capture from a Coal-Fired Power Plant
- Figure 5. Schematic Illustration of Current and Potential Uses of CO2
Summary
Carbon capture and sequestration (or storageCarbon Capture and Sequestration (CCS) in the October 18, 2021
United States
Angela C. Jones
Carbon capture and storage (or sequestration)—known as CCS—is a process that involves
Analyst in Environmental
capturing man-made carbon dioxide (CO2CO2) at its source and storing it permanently underground. (CCS is sometimes referred to as CCUS—carbon capture, utilization, and storage.)
Policy
CCS could reduce the amount of CO2CO2—an important greenhouse gas—emitted to the atmosphere
from the burning of fossil fuels at power plants and other large industrial facilities. The concept
Ashley J. Lawson
of carbon utilization has also gained interest within Congress and in the private sector as a means for capturing CO2
Analyst in Energy Policy
for capturing CO2 and converting it into potentially commercially viable products, such as
chemicals, fuels, cements, and plastics, thereby reducing emissions to the atmosphere and helping offset the cost of CO2 capture. Direct air capture is also an emerging technology, with the promise to remove atmospheric CO2 directly and reduce its concentration.
CO2 capture (CCS is sometimes referred to as CCUS—carbon capture,
utilization, and storage). Direct air capture is a related and emerging technology designed to remove atmospheric CO2 directly.
The U.S. Department of Energy (DOE) has funded research and development (R&D) ofin aspects of CCS since at least 1997 within its Fossil Energy Research and Development (FER&Dand Carbon Management Research, Development, Demonstration, and Deployment program (FECM) portfolio. Since FY2010, Congress has provided more than $5$7.3 billion total in appropriations for DOE CCS-related activities. The Trump Administration proposed to reduce FER&D funding substantially in its FY2018 and FY2019 budget requests, but Congress has not agreed to the proposed reductions. In FY2018, Congress increased funding for DOE FER&D by nearly $59 million (9%) compared to FY2017, and the House- and Senate-passed appropriations bills for FY2019 would match or increase the appropriated amount compared to what Congress enacted for FY2018 ($727 million).
The Petra Nova plant in Texas is the only U.S. fossil-fueled power plant currently generating electricity and capturing CO2 in large quantities (over 1 million tons per year). Globally, the Boundary Dam plant in Canada is the only other large-scale fossil-fueled power plant with CCS. Both facilities retrofitted post-combustion capture technology to units of existing plants, and both offset a portion of the cost of CCS by selling captured CO2 for the purpose of enhanced oil recovery (EOR). Some CCS proponents point to the expanded Section 45Q of the Internal Revenue Code tax credits for CO2 capture and sequestration or its use as a tertiary injectant for EOR or natural gas production that were enacted as part of P.L. 115-123 as a significant step toward incentivizing more development of large-scale CCS deployment like Petra Nova and Boundary Dam.
A number of bills introduced in the 115th Congress potentially would affect CCS in the United States. Several bills or provisions of bills address the Section 45Q tax credits (S. 1535, S. 1663, S. 2256, H.R. 1892, H.R. 2010, H.R. 3761, H.R. 4857). H.R. 1892, the Bipartisan Budget Act of 2018, enacted into law as P.L. 115-123, amended Section 45Q and increased the amount of the tax credit from $20 to $50 per ton of CO2 for permanent sequestration, increased it from $10 to $35 for EOR purposes, and effectively removed the 75 million ton cap on the total amount of CO2 injected underground, among other changes. Some proponents suggest that enactment of this provision could be a "game changer" for CCS, leading to more widespread adoption of the technology, although others question whether the increased incentives are large enough to affect CCS deployment.
Other bills address a suite of measures to advance CCS. Several would provide additional financial incentives, such as tax-exempt private activity bonds, and provisions that would enable eligibility of master limited partnerships for CCS infrastructure projects (S. 843, S. 2005, H.R. 2011, and H.R. 4118). One bill (S. 2602) could help advance CCS by making CCS infrastructure projects eligible under the FAST Act (42 U.S.C. 4370m(6)). Other bills (S. 2803, S. 2997, H.R. 2296, H.R. 5745) would support increased R&D for CCS, carbon utilization technologies, and direct air capture of CO2. One bill (H.R. 4096) would authorize a $5 million prize to promote advances in CCS technology research and development.
There is broad agreement that costs for CCS would need to decrease before the technologies could be deployed commercially across the nation. The issue of greater CCS deployment is fundamental to the underlying reason CCS is deemed important by a range of proponents: to reduce CO2 emissions (or reduce the concentration of CO2 in the atmosphere) and to help mitigate against human-induced climate change.
Carbon capture and sequestration (or storagein appropriations for DOE CCS-related activities, including annual increases in recent years. In FY2021, Congress provided $750 million to FECM, of which $228.3 million was directed to CCUS.
Worldwide, according to the Global CCS Institute, 24 facilities capturing and injecting CO2 facilities were operational in 2020, 12 of which are in the United States. U.S. facilities capturing and injecting CO2, and projects under development, operate in five industry sectors: chemical production, hydrogen production, fertilizer production, natural gas processing, and power generation. These facilities capture and inject CO2 with the aim to sequester the CO2 in underground geologic formations or use the CO2 to increase oil production from aging oil fields, known as enhanced oil recovery (EOR). The Petra Nova project in Texas was the first and only U.S. fossil-fueled power plant generating electricity and capturing CO2 in large quantities (over 1 million tons per year) until CCS operations were suspended in 2020.
The U.S. Environmental Protection Agency (EPA), under authorities to protect underground sources of drinking water, regulates CO2 injection through its Underground Injection Control (UIC) program and associated regulations. While the agency establishes minimum standards and criteria for UIC programs, most states have the responsibility for regulating and permitting wells injecting CO2 for EOR (classified as Class II recovery wells).
Congress has incentivized development of CCS projects through creation of the Internal Revenue Code Section 45Q tax credit for carbon sequestration or its use as a tertiary injectant for EOR or other designated purposes. Recent Internal Revenue Service guidance and regulations on this tax credit are intended to provide increased certainty for industry by establishing processes and standards for “secure geologic storage of CO2,” among other requirements.
The Consolidated Appropriations Act, 2021 (P.L. 116-260) included several provisions aimed at supporting CCS project development in the United States. The act revised and expanded DOE’s ongoing CCS research, development, and demonstration activities, established expedited federal permitting eligibility for CO2 pipelines (where applicable), and extended the start-of-construction deadline for facilities eligible for the Section 45Q tax credit, among other provisions.
There is broad agreement that costs for CCS would need to decrease before the technologies could be widely deployed across the nation. In the view of many proponents, greater CCS deployment is fundamental to reduce CO2 emissions (or reduce the concentration of CO2 in the atmosphere) and to help mitigate human-induced climate change. Congress may also consider that some stakeholders do not support CCS as a mitigation option, citing concerns with continued fossil fuel combustion and the uncertainties of long-term underground CO2 storage.
Congressional Research Service
link to page 5 link to page 7 link to page 7 link to page 8 link to page 9 link to page 10 link to page 11 link to page 12 link to page 13 link to page 13 link to page 14 link to page 14 link to page 15 link to page 16 link to page 18 link to page 19 link to page 19 link to page 23 link to page 24 link to page 6 link to page 8 link to page 8 link to page 9 link to page 10 link to page 15 link to page 17 link to page 17 link to page 12 link to page 21 link to page 21 link to page 26 Carbon Capture and Sequestration (CCS) in the United States
Contents
CCS Primer...................................................................................................................................... 2
CO2 Capture ............................................................................................................................... 4
Postcombustion Capture ..................................................................................................... 4 Precombustion Capture (Gasification) ................................................................................ 5 Oxy-Fuel Combustion Capture ........................................................................................... 6 Allam Cycle ........................................................................................................................ 7
CO2 Transport ............................................................................................................................ 8 CO2 Injection and Sequestration ............................................................................................... 9
Oil and Gas Reservoirs ..................................................................................................... 10 Deep Saline Reservoirs ..................................................................................................... 10 Unmineable Coal Seams .................................................................................................... 11
Carbon Utilization .................................................................................................................... 11 Direct Air Capture ................................................................................................................... 12
Commercial CCS Facilities ........................................................................................................... 13
Petra Nova: The First Large U.S. Power Plant with CCS ....................................................... 15 Boundary Dam: World’s First Addition of CCS to a Large Power Plant ................................ 16
The DOE CCS Program ................................................................................................................ 16 EPA Regulation of Underground Injection in CCS ....................................................................... 20 Discussion ..................................................................................................................................... 21
Figures Figure 1. The CCS Process .............................................................................................................. 3 Figure 2. Diagram of Postcombustion CO2 Capture in a Coal-Fired Power Plant Using an
Amine Scrubber System ............................................................................................................... 5
Figure 3. Diagram of Precombustion CO2 Capture from an IGCC Power Plant............................. 6 Figure 4. Diagram of Oxy-Combustion CO2 Capture from a Coal-Fired Power Plant ................... 7 Figure 5. Schematic Illustration of Current and Potential Uses of CO2 ........................................ 12 Figure 6.Operational and Planned CCS Facilities in the United States Injecting CO2 for
Geologic Sequestration and EOR ............................................................................................... 14
Tables Table 1. Estimates of the U.S. Storage Capacity for CO2 ................................................................ 9 Table 2. Funding for DOE Fossil Energy and Carbon Management Research,
Development, Demonstration, and Deployment Program (FECM) Program Areas .................. 18
Contacts Author Information ........................................................................................................................ 23
Congressional Research Service
link to page 5 Carbon Capture and Sequestration (CCS) in the United States
arbon capture and storage (or sequestration)—known as CCS—is a process that involves capturing man-made carbon dioxide (CO2CO2) at its source and storing it to avoid its release
C to the atmosphere. (CCS is sometimes referred to as CCUS—carbon capture, utilization,
and storage.) CCS could reduce the amount of CO2CO2 emitted to the atmosphere from the burning of fossil fuels at power plants and other large industrial facilities.11 An integrated CCS system would include three main steps: (1) capturing and separating CO2CO2 from other gases; (2) purifying, compressing,compressing and transporting the captured CO2CO2 to the storage or sequestration site; and (3) injecting the CO2CO2 in underground geological reservoirs (the process is explained more fully below in "“CCS Primer"). ”). In recent years, utilization as part of CCUS increasingly has been viewed as a potentially important component of the process. Utilization refers to the beneficial use of CO2 CO2—in lieu of storing it—as a means of mitigating CO2CO2 emissions and converting it to chemicals, cements, plastics, and other products.2 (2 This report uses the term CCS except in cases where utilization is specifically discussed.)
The U.S. Department of Energy (DOE) has long supported research and development (R&D) on CCS within its Fossil Energy Research and Development portfolio (FER&D). Since FY2010, Congress has provided more than $5and Carbon Management Research, Development, Demonstration, and Deployment program (FECM).3 From FY2010 to FY2021, Congress provided $7.3 billion in total appropriations for CCS activities within DOE FER&D (not including theFECM, much of which was directed to CCS. Additionally, Congress provided a one-time appropriation of $3.4 billion provided for CCS in the American Recovery and Reinvestment Act of 2009, (ARRA; P.L. 111-5).
In its FY2018 and FY2019 budget requests, the Trump Administration proposed to reduce FER&D funding compared to previous years. The Trump Administration's proposal differs from the policy trends of the previous two Administrations, which supported R&D on CCS and emphasized the development of large-scale demonstration projects—nearly first-of-their-kind ventures using technologies developed at a pilot or smaller scale that have been ramped up to commercial scale—to evaluate how CCS might be deployed commercially.
Congress did not accept the Administration's FY2018 request for DOE FER&D and instead increased funding by nearly $59 million (9%) compared to FY2017. In 2018 Congress also enacted legislation (Title II, Section 4119 of P.L. 115-123) that would increase the tax credit for capturing and sequestering or utilizing CO2, leading many observers to predict increased CCS activity as a result.
This report includes a primer on the CCS (and carbon utilization) process and discusses the current state of CCS in the United States, as well as the DOE program for CCS R&D and CCS-related legislation in the 115th Congress.
CCS Primer
An integrated CCS system would include three main steps: (1) capturing and separating CO2 from other gases; (2) purifying, compressing, and transporting the captured CO2). Congress has expressed support for continuing federal investment in CCS research and development—including financial support for demonstration projects—through the appropriations process in recent years and in DOE research reauthorizations provided in the Energy Act of 2020 (Division Z of the Consolidated Appropriations Act, 2021; P.L. 116-260).
In recent years, Congress has also enacted tax credits for facilities that capture and sequester CO2—one strategy for incentivizing CCS project deployment. In 2018, Congress enacted legislation (Title II, §4119 of P.L. 115-123) that increased the tax credit for sequestering or utilizing CO2, commonly referred to as the “Section 45Q” tax credit.4 In P.L. 116-260, Congress extended the deadline for start of construction of facilities seeking the tax credit, which, along with Internal Revenue Service regulations on Section 45Q issued in early 2021, could encourage more project development, according to some analysts.5
Congressional interest in addressing climate change has also increased interest in CCS, though debate continues as to what role, if any, CCS should play in deep greenhouse gas reductions. While some policymakers and other stakeholders support CCS as one option for mitigating CO2 emissions,6 others raise concerns that CCS may not discourage fossil fuel use and that CO2 could
1 Carbon capture and sequestration (CCS) also could be used to capture carbon dioxide (CO2) emissions from power plants that use bioenergy sources instead of fossil fuels. In that case, the process is known as bioenergy with carbon capture and storage, or BECCS.
2 See, for example, U.S. Department of Energy (DOE), National Energy Technology Laboratory (NETL), Carbon Utilization Program, at https://www.netl.doe.gov/coal/carbon-utilization.
3 Formerly called Fossil Energy Research and Development. 4 The credit is codified at 26 U.S.C. §45Q. 5 Carbon Capture Coalition, 45Q Tax Credit, at https://carboncapturecoalition.org/45q-legislation/. 6 For example, the International Energy Agency (IEA) includes CCS as a “key solution” in its 2021 report on achieving global net zero greenhouse gas emissions. IEA anticipates widespread CCS deployment in several industries (e.g., power, cement, and hydrogen production) as well as direct air capture. International Energy Agency (IEA), Net Zero by 2050: A Roadmap for the Global Energy Sector, May 2021.
Congressional Research Service
1
link to page 6 Carbon Capture and Sequestration (CCS) in the United States
leak from underground reservoirs into the air or other reservoirs, thereby negating any climate benefits of CCS.7
This report includes a primer on the CCS (and carbon utilization) process; overviews of the DOE program for CCS R&D, U.S. Environmental Protection Agency (EPA) regulation of underground CO2 injection used for CCS, and the Section 45Q tax credit for CO2 sequestration; and a discussion of CCS policy issues for Congress. An evaluation of the fate of injected underground CO2 and the permanence of CO2 storage is beyond the scope of this report.
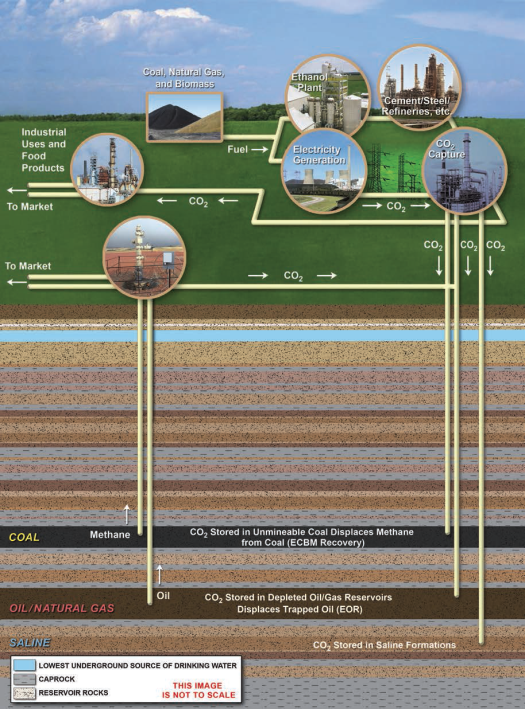
CCS Primer An integrated CCS system includes three main steps: (1) capturing and separating CO2 from other gases; (2) compressing and transporting the captured CO2 to the sequestration site; and (3) injecting the CO2CO2 in subsurface geological reservoirs. The most technologically challenging and costly step in the process is the capturefirst step, whichcarbon capture. Carbon capture equipment is capital-intensive to build and requires a considerable amount ofenergy-intensive to operate. Power plants can supply their own energy to operate (CCS equipment, but the amount of energy a power plant uses to capture and compress CO2CO2 is that much less electricity the plant can deliversell to its customers; this is. This difference, sometimes referred to as the energy penalty or the parasitic load)., has been reported to be around 20% of a power plant’s capacity.8 Figure 1 shows the CCS process schematically from source to storage.
 |
|
“CO2 Injection and Sequestration.”
Congressional Research Service
3
link to page 8 link to page 18 link to page 18 Carbon Capture and Sequestration (CCS) in the United States
The transport and injection/storage steps of the CCS process are not technologically challenging per se, as compared to the capture step. Carbon dioxide pipelines are in use for EORused for enhanced oil recovery (EOR) in regions of the United States today, and for decades large quantities of fluids have been injected into the deep subsurface for a variety of purposes for decades, such as disposal of wastewater from oil and gas operations or of municipal wastewater.9 However, the transport and capturestorage steps still face challenges, including economic and regulatory issues, rights-of-way, and questions regarding the permanence of CO2CO2 sequestration in deep geological reservoirs, as well as and ownership and liability issues for the stored CO2CO2, among others.
CO2 Capture
CO2 Capture The first step in CCS is to capture CO2CO2 at the source and separate it from other gases.10 As noted above, this is typically the most costly part of a CCS project, representing up to 75% of project costs in some cases.11 Current carbon capture costs are estimated at $43-$65 per ton CO2 captured, though cost reductions of 50%-70% may be possible as the industry matures.12
Currently, three main approaches are available to capture CO2 from large-scale industrial facilities or power plants: (1) postcombustion capture; (2) precombustion capture; and (3) oxy-fuel combustion capture.
The following sections summarize each of these approaches. at the source and separate it from other gases. Currently, three main approaches are available to capture CO2 from large-scale industrial facilities or power plants: (1) post-combustion capture, (2) precombustion capture, and (3) oxy-fuel combustion capture. For power plants, current commercial CO2 capture systems theoretically could operate at 85%-95% capture efficiency—meaning that 85% to 95% of all the CO2 produced during the combustion process could be captured before it goes up the stack into the atmosphere.3
In a worst-case scenario, energy penalty in the capture phase of the CCS process may increase the cost of electricity by 80% and reduce an electricity-generating plant's net capacity by 20%.4 Further, as much as 70%-90% of the total cost for CCS is associated with the capture and compression phases of CCS.5 Other estimates indicate that the energy penalty could be lower, resulting in smaller impacts to subsequent electricity costs.6 A detailed description and assessment of thesethe carbon capture technologies is provided in CRS Report R41325, Carbon Capture: A Technology Assessment, by [author name scrubbed].
Post-combustion Capture
The process of post-combustionPeter Folger.
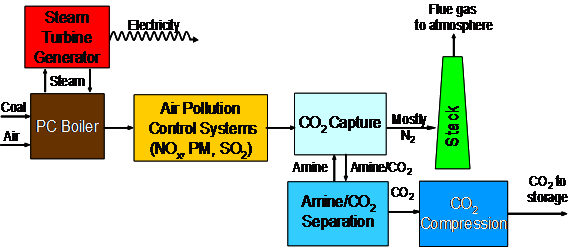
Postcombustion Capture
The process of postcombustion capture involves extracting CO2CO2 from the flue gas—the mix of gases produced that goes up the exhaust stack—following combustion of fossil fuels or biomass.7 Several commercially available technologies, some involving absorption using chemical solvents (such as an amine, ; see Figure 2), can in principle be used to capture large quantities of CO2CO2 from flue gases.813 In a vessel called an absorberabsorber, the flue gas is "scrubbed"“scrubbed” with an amine solution, typically capturing 85% to 90% of the CO2. The CO2CO2. The CO2-laden solvent is then pumped to a second vessel, called a regeneratorregenerator, where heat is applied (in the form of steam) to release the CO2CO2. The resulting stream of concentrated CO2CO2 is then compressed and piped to a storage site, while the depleted solvent is recycled back to the absorber.
Other than the Petra Nova plantproject (discussed below in “ in "Petra Nova: The First (and Only) Large U.S. Power Plant with CCS”"), no large U.S. commercial electricity-generating plants currently capture large volumes of CO2 (i.e., over 1 million tons per year). As the Petra Nova project indicates, the post-combustion capture process includes proven technologies that are commercially available today.
Precombustion Capture
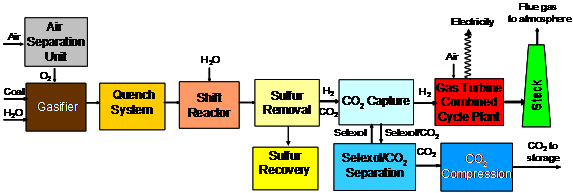
CO2 capture. PC = pulverized coal. N2 = nitrogen gas.
Precombustion Capture (Gasification)
The process of precombustion capture separates CO2CO2 from the fuel by combining the fuel with air and/or steam to produce hydrogen for combustion and a separate CO2CO2 stream that could be stored. For coal-fueled power plants, this is accomplished by reacting coal with steam and oxygen at high temperature and pressure, a process called partial oxidation, or gasification , or gasification (Figure 3).914 The result is a gaseous fuel consisting mainly of carbon monoxide and hydrogen—a mixture known as synthesis gas, or syngassyngas—which can be burned to generate electricity. After particulate impurities are removed from the syngas, a two-stage "shift reactor" converts the carbon monoxide to CO2CO2 via a reaction with steam (H2OH2O). The result is a mixture of CO2CO2 and hydrogen. A chemical solvent, such as the widely used commercial product Selexol (which employs a glycol-based solvent), then captures the CO2CO2, leaving a stream of nearly pure hydrogen that is burned in a combined cycle power plant to generate electricity—this is known as an integrated gasification combined-cycle plantplant (IGCC)—as depicted inin Figure 3.
One example of precombustion capture Existing IGCC power plants in the United States do not capture CO2.15
One example of gasification technology in operation today is atthe Polk Power Station about 40 miles southeast of Tampa, FL.16 The 250 megawatt (MW) unit generates electricity from coal-derived syngas produced and purified onsite. The Polk Power Station does not capture CO2. An example of precombustion capture technology, though not for power generation, is the Great Plains Synfuels Plant in Beulah, ND. The Great Plains plant produces synthetic natural gas from lignite coal through a gasification process, and the natural gas is shipped out of the facility for 14 See CRS Report R41325, Carbon Capture: A Technology Assessment, by Peter Folger. 15 One integrated gasification combined-cycle project in Edwardsport, IN, was designed with sufficient space to add carbon capture in the future. For further discussion, see DOE, NETL, “IGCC Project Examples,” at https://netl.doe.gov/research/coal/energy-systems/gasification/gasifipedia/project-examples.
16 For more information about the Polk Power Station, see DOE, NETL, “Tampa Electric Integrated Gasification Combined-Cycle Project,” at https://netl.doe.gov/research/Coal/energy-systems/gasification/gasifipedia/tampa.
Congressional Research Service
5
link to page 10 link to page 10 Carbon Capture and Sequestration (CCS) in the United States
sale in the natural gas market. The process also produces a stream of high-purity CO2sale in the natural gas market. The process also produces a stream of high-purity CO2, which is piped northward into Canada for use in enhanced oil recovery (EOR)10 at the Weyburn oil field.11
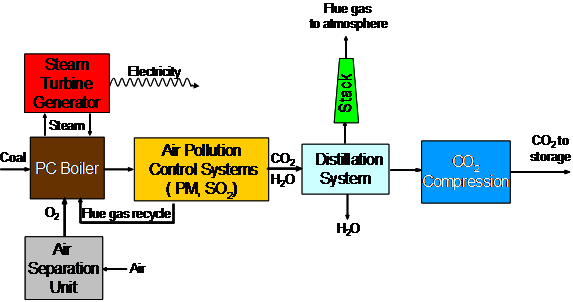
Oxy-Fuel Combustion Capture
The process of oxy-fuel combustion capture uses pure oxygen instead of air for combustion and produces a flue gas that is mostly CO2CO2 and water, which are easily separable, after which the CO2 CO2 can be compressed, transported, and stored (Figure 4). Oxy-fuel combustion requires an oxygen production step, which would likely involve a cryogenic process (shown as the air separation unit inin Figure 4). The advantage of using pure oxygen is that it eliminates the large amount of nitrogen in the flue gas stream.12
, thus reducing the formation of smog-forming pollutants like nitrogen oxides.
Currently oxy-fuel combustion projects are at the lab- or bench-scale, ranging up to verification testing at a pilot scale.13
CO2 Transport
After the CO2 capture step, the gas is purified and compressed Elements, vol. 4 (2008), pp. 311-317.
Allam Cycle
The Allam Cycle is a novel power plant design that uses supercritical CO2 (sCO2) to drive an electricity-generating turbine.19 sCO2 is CO2 held at certain temperature and pressure conditions, giving it unique chemical and physical properties. In contrast, most power plants in operation today (and most proposed power plants using CCS) use steam (i.e., water) to drive a turbine. Power plants using the Allam Cycle combust fossil fuels in pure oxygen, producing CO2 and water.20 The CO2 can be reused multiple times to generate electricity, or piped away for utilization or storage. The excess CO2 produced by the cycle is sufficiently pure to be directly transported or used without requiring an additional capture or purification step. For power plant operations, sCO2 may be more efficient than steam. Initial estimates indicate that power plants using the Allam Cycle could have comparable efficiencies to natural gas combined cycle power plants without CCS.21
The NET Power demonstration facility in La Porte, TX, is the first power plant to use the Allam Cycle. Plans for two commercial-scale Allam Cycle power plants—one in Colorado and one in Illinois—were announced in April 2021.22
19 NET Power, The Allam-Fetvedt Cycle, at https://netpower.com/the-cycle/. 20 The operational NET Power facility uses natural gas as a fuel, but coal may also be used. One of the NET Power project developers, 8 Rivers Capital, received a DOE grant in 2019 to study the design of a coal-fired power plant using the Allam Cycle. DOE, “U.S. Department of Energy Invests $7 Million for Projects to Advance Coal Power Generation Under Coal FIRST Initiative,” at https://netl.doe.gov/node/9282. 21 Rodney Allam et al., “Demonstration of the Allam Cycle: An update on the development status of a high efficiency supercritical carbon dioxide power process employing full carbon capture,” Energy Procedia, vol. 114 (2017), pp. 5948-5966.
22 Akshat Rathi, “U.S. Startup Plans to Build First Zero-Emission Gas Power Plants,” Bloomberg Green, April 15, 2021.
Congressional Research Service
7
Carbon Capture and Sequestration (CCS) in the United States
CO2 Transport After the CO2 capture step, the gas is purified and compressed (typically into a supercritical state) to produce a concentrated stream for transport. Pipelines are the most common method for transporting CO2CO2 in the United States. Currently, approximately 4,5005,000 miles of pipelines transport CO2CO2 in the United States, predominatelypredominantly to oil fields,14 where it is used for EOR.23 Transporting CO2CO2 in pipelines is similar to transporting fuels such as natural gas and oil; it requires attention to design, monitoring for leaks, and protection against overpressure, especially in populated areas.
Costs for pipeline construction vary, depending upon length and capacity; right-of-way costs; whether the pipeline is onshore or offshore; whether the route crosses mountains, large rivers, or frozen ground; and other factors. The quantity and distance transported will mostly determine shipping costs. Shipping rates for CO2 pipelines in the United States may be negotiated between the operator and shippers, or may be subject to rate regulation if they are considered open access pipelines with eminent domain authority. Siting of CO2 pipelines is under the jurisdiction of the states, although the federal government regulates their safety.
Even though regional CO2 pipeline networks currently operate in the United States for EOR, developing a more expansive network for CCS could pose regulatory and economic challenges. Some studies have suggested that development of a national CO2 pipeline network that would address the broader issue of greenhouse gas reduction using CCS may require a concerted federal policy, in some cases including federal incentives for CO2 pipeline development.24 In 2020, enacted legislation included provisions to facilitate the study and development of CO2 pipelines that could be used for CCS.25
Using marine vessels also may be feasible for transporting CO2 over large distances or overseas. Liquefied natural gas and liquefied petroleum gases (i.e., propane and butane) are routinely shipped by marine tankers on a large scale worldwide.26 Marine tankers transport CO2 today, but at a small scale because of limited demand. Marine tanker costs for CO2 shipping are uncertain, because no large-scale CO2 transport system via vessel (in millions of tons of CO2design, monitoring for leaks, and protection against overpressure, especially in populated areas.15 Typically, CO2 would be compressed prior to transportation into a supercritical state,16 making it dense like a liquid but fluid like a gas.
Using ships may be feasible when CO2 must be transported over large distances or overseas. Liquefied natural gas, propane, and butane are routinely shipped by marine tankers on a large scale worldwide. Ships transport CO2 today, but at a small scale because of limited demand. Rail cars and trucks also can transport CO2, but this mode probably would be uneconomical for large-scale CCS operations.
Costs for pipeline transport vary, depending on construction, operation and maintenance, and other factors, including right-of-way costs, regulatory fees, and more. The quantity and distance transported will mostly determine costs, which also will depend on whether the pipeline is onshore or offshore; the level of congestion along the route; and whether mountains, large rivers, or frozen ground are encountered. Shipping costs are unknown in any detail, because no large-scale CO2 transport system via ship (in millions of tons of CO2 per year, for example) is operating.17 Ship costs might be lower, although such an operation has been proposed in Europe.27 Marine tanker shipping might be less costly than pipeline transport for distances greater than 1,000 kilometers and for less than a few million tons of CO2CO2 transported per year.28
23 Pipeline and Hazardous Materials Safety Administration, “Annual Report Mileage for Hazardous Liquid or Carbon Dioxide Systems,” web page, July 1, 2020, at https://www.phmsa.dot.gov/data-and-statistics/pipeline/annual-report-mileage-hazardous-liquid-or-carbon-dioxide-systems.
24 See, for example, Elizabeth Abramson et al., “Transport Infrastructure for Carbon Capture and Storage,” Regional Carbon Capture Deployment Initiative, June 2020; Ryan W. J. Edwards and Michael A. Celia, “Infrastructure to Enable Deployment of Carbon Capture, Utilization, and Storage in the United States,” Proceedings of the National Academy of Sciences, September 18, 2018.
25 USE IT Act (H.R. 1166 and S. 383), 116th Congress, and enacted as part of P.L. 116-260. 26 Rail cars and trucks also can transport CO2, but this mode probably would be uneconomical for large-scale CCS operations.
27 See IEA Clean Coal Centre, “Northern Lights – Send Us Your CO2,” July 2, 2020. In this report, the amount of CO2 is stated in metric tons, or 1,000 kilograms, which is approximately 2,200 pounds. Hereinafter, the unit tons means metric tons.
28 Intergovernmental Panel on Climate Change (IPCC) Special Report, Carbon Dioxide Capture and Storage, 2005, p. 31.
Congressional Research Service
8
link to page 6 link to page 6 link to page 12 Carbon Capture and Sequestration (CCS) in the United States
CO2 Injection and Sequestration Three main types of geological formations are being considered for underground CO2 injection and transported per year.18
Even though regional CO2 pipeline networks currently operate in the United States for EOR, developing a more expansive network for CCS could pose regulatory and economic challenges. Some observers note that development of a national CO2 pipeline network that would address the broader issue of greenhouse gas reduction using CCS may require a concerted federal policy beyond the current joint federal-state regulatory policy.19 One recommendation from stakeholders is for federal regulators to build on state experience for siting CO2 pipelines, for example.20
CO2 Sequestration
Three main types of geological formations are being considered for carbon sequestration: (1) depleted oil and gas reservoirs, (2) deep saline reservoirs, and (3) unmineable coal seams. In each case, CO2 would be injected in a supercritical state—a relatively dense fluid—below groundCO2 in a supercritical state would be injected into a porous rock formation below ground that holds or previously held fluids (Figure 1). When CO2CO2 is injected at depths greater than about half a mile (800 meters) in a typical reservoir, the pressure keeps the injected CO2CO2 supercritical, making the CO2CO2 less likely to migrate out of the geological formation. The process also requires that the geological formation have an overlying caprock or relatively impermeable formation, such as shale, so that injected CO2 remains trapped underground (Figure 1). Injecting CO2CO2 into deep geological formations uses existing technologies that have been primarily developed and used by the oil and gas industry and that potentially could be adapted for long-term storage and monitoring of CO2.
The storage capacity for CO2 in geological formations is potentially very largebe adapted for long-term storage and monitoring of CO2.
DOE's Regional Carbon Sequestration Partnership Initiative has been actively pursuing a three-phase approach to the sequestration step in the CCS process since 2003. It is currently in the development phase.21 The development phase includes implementation of large-scale field testing of approximately 1 million tons of CO2 per project to confirm the safety, permanence, and economics of industrial-scale CO2 storage in seven different regions of the United States.22 The development phase began in 2008 and is projected to last through 2018 and possibly beyond.
The storage capacity for CO2 in geological formations is potentially huge if all the sedimentary basins in the world are considered.2329 In the United States alone, DOE has estimated the total storage capacity to range between about 2.6 trillion and 22 trillion tons of CO2CO2 (see Table 1).2430 The suitability of any particular site, however, depends on many factors, including proximity to CO2CO2 sources and other reservoir-specific qualities such as porosity, permeability, and potential for leakage.2531 For CCS to succeed in mitigating atmospheric emissions of CO2, it is assumed that each reservoir type would permanently store the vast majority of injected CO2, CO2, keeping the gas isolated from the atmosphere in perpetuity. That assumption is untested, although part of the DOE CCS R&D program has been devoted to experimenting and modeling the behavior of large quantities of injected CO2CO2. Theoretically—and without consideration of costs, regulatory issues, public acceptance, infrastructure needs, liability, ownership, and other issues—the United States could store its total CO2CO2 emissions from large stationary sources (at the current rate of emissions) for centuries.
Table 1. Estimates of the U.S. Storage Capacity for CO2
CO2
(in billions of metric tons)
Low
Medium
High
Oil and Natural Gas Reservoirs
186
205
232
Unmineable Coal
54
80
113
Saline Formations
2,379
8,328
21,633
Total
2,618
8,613
21,978
Source: U.S. Department of Energy, National Energy Technology Laboratory, Carbon Storage Atlas, 5th ed., (in billions of metric tons)
|
Low |
Medium |
High |
|
|
Oil and Natural Gas Reservoirs |
186 |
205 |
232 |
|
Unmineable Coal |
54 |
80 |
113 |
|
Saline Formations |
2,379 |
8,328 |
21,633 |
|
Total |
2,618 |
8,613 |
21,978 |
Source: U.S. Department of Energy, National Energy Technology Laboratory, Carbon Storage Atlas, 5th ed., August 20, 2015, at https://www.netl.doe.gov/File%20Library/Research/Coal/carbon-storage/atlasv/ATLAS-V-2015.pdf.
.
29 Sedimentary basins refer to natural large-scale depressions in the Earth’s surface that are filled with sediments and fluids and are therefore potential reservoirs for CO2 storage.
30 For comparison, in 2019 the United States emitted 1.6 billion tons of CO2 from the electricity generating sector. See U.S. Environmental Protection Agency, Draft Inventory of U.S. Greenhouse Gas Emissions and Sinks 1990-2019, p. ES-7, at https://www.epa.gov/ghgemissions/draft-inventory-us-greenhouse-gas-emissions-and-sinks-1990-2019.
31 Porosity refers to the amount of open space in a geologic formation—the openings between the individual mineral grains or rock fragments. Permeability refers to the interconnectedness of the open spaces, or the ability of fluids to migrate through the formation. Leakage means that the injected CO2 can migrate up and out of the intended reservoir, instead of staying trapped beneath a layer of relatively impermeable material, such as shale.
Congressional Research Service
9
link to page 12 Carbon Capture and Sequestration (CCS) in the United States
Notes: Data current as of November 2014. The estimates represent only the physical restraints on storage (i.e., the pore volume in suitable sedimentary rocks) and do not consider economic or regulatory constraints. The low, medium, and high estimates correspond to a calculated probability of exceedance of 90%, 50%, and 10%, respectively, meaning that there is a 90% probability that the estimated storage volume will wil exceed the low estimate and a 10% probability that the estimated storage volume will wil exceed the high estimate. Numbers in the table may not add precisely due to rounding.
Oil and Gas Reservoirs
Pumping CO2
Pumping CO2 into oil and gas reservoirs to boost production (that is, enhanced oil recovery) isEOR) has been practiced in the oil and gas industry for several decadesthe petroleum industry today. The United States is a world leader in this technology, and oil and gas operators inject approximately 68 million tons of CO2CO2 underground each year to help recover oil and gas resources.2632 Most of the CO2 CO2 used for EOR in the United States comes from naturally occurring geologic formations, however, not from industrial sources. Using CO2CO2 from industrial emitters has appeal because the costs of capture and transport from the facility could be partially offset by revenues from oil and gas production. Both of the currently operating large electricity-generating plants with CCS, Boundary Dam and Petra Nova (discussed below in "Coal-Fired Power Plants with CCS"), offset some of the costs by selling the captured CO2 for EOR.
Carbon dioxideThe majority of existing CCS facilities offset some of the costs by selling the captured CO2 for EOR. According to some studies, EOR using CO2 captured from an industrial source can produce crude oil with a lower lifecycle greenhouse gas emissions intensity than either oil produced without EOR or oil produced through EOR using naturally occurring CO2.33 CO2 can be used for EOR onshore or offshore. To date, most U.S. CO2CO2 projects associated with EOR are onshore, with the bulk of activities in western Texas.2734 Carbon dioxide also can be injected into oil and gas reservoirs that are completely depleted, which would serve the purpose of long-term sequestration but without any offsetting financial benefit from oil and gas production.
Deep Saline Reservoirs
Some rocks in sedimentary basins contain saline fluids—brines or brackish water unsuitable for agriculture or drinking. As with oil and gas, deep saline reservoirs can be found onshore and offshore; they are often part of oil and gas reservoirs and share many characteristics. The oil industry routinely injects brines recovered during oil production into saline reservoirs for disposal.28 As35 As Table 1 shows, deep saline reservoirs constitute the largest potential for storing CO2CO2 by far. However, unlike oil and gas reservoirs, storing CO2CO2 in deep saline reservoirs does not have the potential to enhance the production of oil and gas or to offset costs of CCS with revenues from the produced oil and gas.
32 As of 2014. See Vello Kuuskraa and Matt Wallace, “CO2-EOR Set for Growth as New CO2 Supplies Emerge,” Oil and Gas Journal, vol. 112, no. 4 (April 7, 2014), p. 66. Hereinafter Kuuskraa and Wallace, 2014.
33 For example, one study comparing lifecycle greenhouse gas emissions of EOR using different sources of CO2 found that using CO2 captured from an IGCC power plant or a natural gas combined cycle power plant resulted in oil with 25%-60% lower lifecycle greenhouse gas emissions. CO2 source is not the only determinant of the net emissions reductions associated with EOR. The types of EOR technology and methods also affect estimated emissions reductions in scientific studies. To a certain extent, EOR can be optimized for CO2 storage (i.e., conducted in such a way as to attempt to maximize the storage of CO2 as opposed to maximizing the production of oil).
34 As of 2014, nearly two-thirds of oil production using CO2 for EOR came from the Permian Basin, located in western Texas and southeastern New Mexico. Kruskaa and Wallace, 2014, p. 67.
35 The U.S. Environmental Protection Agency (EPA) regulates this practice under authority of the Safe Drinking Water Act, Underground Injection Control (UIC) program. See the EPA UIC program at https://www.epa.gov/uic/class-ii-oil-and-gas-related-injection-wells.
Congressional Research Service
10
Carbon Capture and Sequestration (CCS) in the United States
Unmineable Coal Seams
Unmineable Coal Seams
U.S. coal resources that are not mineable with current technology are those in which the coal beds are not thick enough, are too deep, or lack structural integrity adequate for mining.2936 Even if they cannot be mined, coal beds are commonly permeable and can trap gases, such as methane, which can be extracted (a resource known as coal-bed methane, or CBM). Methane and other gases are physically bound (adsorbed) to the coal. Studies indicate that CO2CO2 binds to coal even more tightly than methane binds to coal.30 CO237 CO2 injected into permeable coal seams could displace methane, which could be recovered by wells and brought to the surface, providing a source of revenue to offset the costs of CO2CO2 injection. Unlike EOR, injecting CO2CO2 and displacing, capturing, and selling CBM (a process known as enhanced coal bed methane recovery, or ECBM) to offset the costs of CCS is not yet part of commercial production. Currently, nearly all CBM is produced by removing water trapped in the coal seam, which reduces the pressure and enables the release of the methane gas from the coal.
Carbon Utilization
The concept of carbon utilization has gained increasingly widespread interest within Congress and in the private sector as a means for capturing CO2CO2 and storing it in potentially useful and commercially viable products, thereby reducing emissions to the atmosphere, and for offsetting the cost of CO2 capture. EOR is currently the main use of captured CO2, and some observers envision EOR will continue to dominate carbon utilization for some time, supporting the scale-up of capture technologies that could later rely upon other utilization pathways.38 Nonetheless, research activities and congressional interest in utilization tend to focus on uses other than EOR. For example, cost of CO2 capture. The carbon utilization process is often referred to in legislative language and elsewhere as CCUS.31 (See, for example, S. 2803, S. 2997, H.R. 2296, discussed below in "CCS-Related Legislation in the 115th Congress.")
P.L. 115-123, the Bipartisan Budget Act of 2018, which expanded the Section 45Q tax credit for carbon capture and sequestration, excludes EOR from the definition of carbon utilization. P.L. 115-123 defines carbon utilization as39
defines carbon utilization as
- the fixation of such qualified carbon oxide through photosynthesis or
chemosynthesis, such as through the growing of algae
ofor bacteria; -
the chemical conversion of such qualified carbon oxide to a material or chemical
compound in which such qualified carbon oxide is securely stored; and
-
the use of such qualified carbon oxide for any other purpose for which a
commercial market exists (with the exception of use as a tertiary injectant in a qualified enhanced oil or natural gas recovery project), as determined by the Secretary [of the Treasury].40
P.L. 116-260 provides two authorizations for a DOE carbon utilization research program (to be coordinated as a single program) in the aforementioned USE IT Act and Energy Act of 2020.
36 Coal bed and coal seam are interchangeable terms. 37 IPCC Special Report, p. 217. 38 For example, “For good reasons, many seek to find ways to use CO2 to create economic value in a climate-positive way. Today, the primary use of CO2 is for enhanced oil recovery. This is an important near-term pathway and provides opportunities to finance projects, scale-up technologies and reduce costs.” Written testimony of Dr. S. Julio Friedmann, U.S. Congress, Senate Committee on Energy and Natural Resources, Full Committee Hearing to Examine Development and Deployment of Large-Scale Carbon Dioxide Management Technologies, 116th Cong., 2nd sess., July 28, 2020.
39 CRS In Focus IF11455, The Tax Credit for Carbon Sequestration (Section 45Q), by Angela C. Jones and Molly F. Sherlock.
40 P.L. 115-123, §41119. A tertiary injectant refers to the use of CO2 for EOR or enhanced natural gas recovery.
Congressional Research Service
11
link to page 15 link to page 7
Carbon Capture and Sequestration (CCS) in the United States
Both focus on “novel uses” for carbon and CO2, such as “chemicals, plastics, building materials, fuels, cement, products of coal utilization in power systems or in other applications, and other products with demonstrated market value.”41
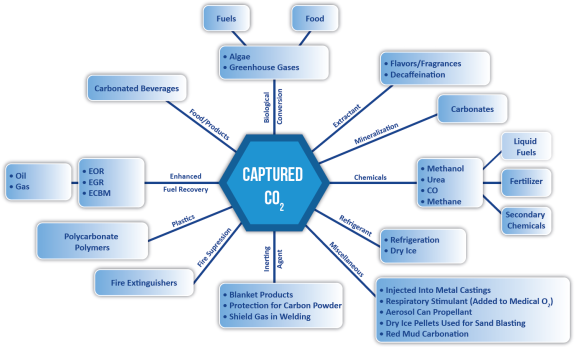
Figure 5 illustrates an array of potential utilization pathways: uptake using algae (for biomass production), conversion to fuels and chemicals, mineralization into inorganic materials, and use as a working fluid (e.g., for EOR) or other services.
Figure 5. Schematic Illustration of Current and Potential Uses of CO2
Source: U.S. DOE, National Energy Technology Laboratory (NETL), at https://www.netl.doe.gov/coal/carbon-utilization.
Secretary [of the Treasury].32
Figure 2 illustrates an array of potential utilization pathways ranging from food and fuels to solid building materials like cement to fertilizers. DOE notes that many of the uses shown in Figure 2 are small scale and typically emit the CO2 back to the atmosphere after use, negating the initial reduction in overall CO2 emissions.33 DOE sponsors research to develop technologies capable of manufacturing stable products using CO2 and storing it in a form that will not escape to the atmosphere. The four main areas of DOE-sponsored research in this area are for (1) cement; (2) polycarbonate plastics; (3) mineralization (conversion of CO2 to carbonates); and (4) enhanced oil (EOR) and gas recovery.34 Using CO2 for EOR currently dominates the estimated 80 million tons of CO2 used worldwide,35 and CCUS proponents indicate that EOR likely will continue as the dominant use in the short to medium term.36
|
 |
|
Source: U.S. DOE, National Energy Technology Laboratory, CO2 Utilization Focus Area, at https://www.netl.doe.gov/research/coal/carbon-storage/research-and-development/co2-utilization. Notes: Enhanced fuel recovery is not considered carbon utilization under P.L. 115-123 for the purposes of tax credits under Section 45Q of the Internal Revenue Code. |
Direct Air Capture
Direct Air Capture Direct air capture (DAC) is an emerging set of technologies that aimsaim to remove CO2CO2 directly from the atmosphere, as opposed to the point source capture of CO2CO2 from a source like a power plant (as described above in "“CO2 Capture").
”).42
DAC systems typically employ a chemical capture system to separate CO2CO2 from ambient air, addition of add energy to separate the captured CO2CO2 from the chemical substrate, and removal ofremove the purified CO2CO2 to be stored permanently or utilized for other purposes (Figure 5).37
.43
41 P.L. 116-260, Division S, §102(c). 42 CRS In Focus IF11501, Carbon Capture Versus Direct Air Capture, by Ashley J. Lawson. Some DAC processes capture CO2 from seawater instead of the atmosphere.
43 For a detailed assessment of DAC technology, see the American Physical Society, Direct Air Capture of CO2 with Chemicals: A Technology Assessment for the APS Panel on Public Affairs, June 1, 2011, at https://www.aps.org/policy/reports/assessments/upload/dac2011.pdf. Hereinafter American Physical Society, 2011. Additional background information is also available in National Academies of Sciences, Engineering, and Medicine, Negative Emissions Technologies and Reliable Sequestration: A Research Agenda, 2019.
Congressional Research Service
12
Carbon Capture and Sequestration (CCS) in the United States
DAC systems have the potential to be classified as net carbon negative, meaning that if the captured CO2CO2 is permanently sequestered or becomes part of long-lasting products such as cement or plastics, the end result would be a reduction in the atmospheric concentration of CO2CO2. In addition, DAC systems can be sited almost anywhere, —they do not need to be near power plants or other point sources of CO2CO2 emissions. They could be located, for example, close to manufacturing plants that require CO2CO2 as an input, and wouldn'twould not necessarily need long pipeline systems to transport the captured CO2.
CO2.
The concentration of CO2CO2 in ambient air is far lower than the concentration found at most point sources. Thus, a recognized drawback of DAC systems is their high cost per ton of CO2CO2 captured, compared to the more conventional CCS technologies.3844 A 2011 assessment estimated costs at roughly $600 per ton of captured CO2.39CO2.45 A more recent assessment from one of the companies developing DAC technology, however, projects lower costs for commercially deployed plants of between $94 and $232 per ton.4046 By comparison, some estimate costs for conventional CCS from coal-fired electricity generating plants in the United States between $48 and $109 per ton.41
Legislation introduced in the 115th Congress, S. 2602 (the USE IT Act, see Table 2), includes the purpose "to support carbon dioxide utilization and direct air capture research" among other purposes, and contains language for a technology prize that would be awarded for DAC projects that capture more than 10,000 tons per year at a cost of less than $200 per ton CO2 captured. H.R. 4096, the Carbon Capture Prize Act, would offer a prize for technology developed to reduce the amount of CO2 in the atmosphere, which would include DAC technologies.
Coal-Fired Power Plants with CCS
Globally, two fossil-fueled power plants currently generate electricity and capture CO2 in large quantities: the Boundary Dam plant in Canada and the Petra Nova plant in Texas. Both plants retrofitted post-combustion capture technology to units of existing plants. (The different types of carbon capture technologies are discussed above in "CCS Primer.")
Petra Nova: The First (and Only) 47
Congress has sometimes combined support for CCS and DAC into single proposals, despite the differences in the technologies. For example, the federal tax credit for carbon sequestration applies to CCS and DAC projects (with CO2 injection for sequestration).48 In other cases, though, Congress has treated the technologies separately. For example, the Energy Act of 2020 provided CCS R&D authorizations primarily in Title IV—Carbon Management, while most DAC R&D authorizations are in Title V—Carbon Removal.
Commercial CCS Facilities According to one set of data collected by the Global CCS Institute (GCCSI), 24 commercial CCS facilities were capturing and injecting CO2 throughout the world in 2020, 12 of which are in the United States.49 These facilities have a cumulative capacity to capture and store an estimated 40 million tons of CO2 each year.50 Additionally, according to GCCSI, 3 more commercial facilities were under construction, 34 pilot or demonstration-scale CCS facilities were operational, and 8 CCS technology test centers were operational worldwide, as of 2020.51
44 Generally, the more dilute the concentration of CO2, the higher the cost to extract it, because much larger volumes are required to be processed. By comparison, the concentration of CO2 in the atmosphere is about 0.04%, whereas the concentration of CO2 in the flue gas of a typical coal-fired power plant is about 14%.
45 American Physical Society, 2011, p. 13. 46 Robert F. Service, “Cost Plunges for Capturing Carbon Dioxide from the Air,” Science, June 7, 2018, at http://www.sciencemag.org/news/2018/06/cost-plunges-capturing-carbon-dioxide-air.
47 Lawrence Irlam, The Costs of CCS and Other Low-Carbon Technologies in the United States-2015 Update, Global CCS Institute, July 2015, p. 1, at http://www.globalccsinstitute.com/publications/costs-ccs-and-other-low-carbon-technologies-2015-update.
48 For more information, see CRS In Focus IF11455, The Tax Credit for Carbon Sequestration (Section 45Q), by Angela C. Jones and Molly F. Sherlock.
49 Global CCS Institute, Global Status Report 2020, December 1, 2020. Two facilities, Petra Nova and Lost Cabin, stopped CCS operations in 2020. The Global CCS Institute defines a commercial facility as a facility capturing CO2 for permanent storage as part of an ongoing commercial operation, that generally has an economic life similar to the host facility whose CO2 it captures, and that supports a commercial return while operating and/or meets a regulatory requirement.
50 Global CCS Institute, Global Status Report 2020, p. 19. 51 Global CCS Institute, Global Status Report 2020, p. 19.
Congressional Research Service
13
Carbon Capture and Sequestration (CCS) in the United States
U.S. CCS facilities in operation or under development occur in five industrial sectors, according to GCCSI data: chemical production, hydrogen production, fertilizer production, natural gas processing, and power generation.52 The Archer Daniels Midland (ADM) facility in Decatur, IL, is the only facility injecting the CO2 solely for geologic sequestration. The facility injects CO2 captured from ethanol production into a saline reservoir and as of 2019 reported that 1.5 million metric tons of CO2 had been injected at the site.53
Figure 6.Operational and Planned CCS Facilities in the United States Injecting CO2
for Geologic Sequestration and EOR
Global CCS Institute data, as of 2020
Source: CRS, adapted from Global CCS Institute, Global Status Report 2020, 2020. Notes: Mtpa = mil ion tons per annum (year); circle placement indicates initial year of operations or anticipated initial year of operations for projects under development, according to GCCSI (the first time frame in the figure represents 38 years, while the other time frames each represent a five-year period). Some projects under
development anticipate multiple CO2 sources; in these cases, circle placement indicates the initial application being studied.
Particular attention has been paid to two power generation projects: Boundary Dam, in Saskatchewan, Canada, and Petra Nova, near Houston, TX. Both projects involved retrofitting coal-fired electricity generators with carbon capture equipment and have been lauded as successful examples of carbon capture technology. At the same time, both projects have been criticized for high costs and for sequestering carbon via EOR. In May 2020, Petra Nova’s owners
52 Global CCS Institute, Global Status Report 2020. “Under development” indicates that some project development. activity has occurred (e.g., feasibility or design studies), but the facility is not actively capturing and/or injecting CO2. Projects may be in different stages of development.
53 EPA FLIGHT database, accessed November 16, 2020. For comparison, that facility reported emitting 17.5 million metric tons of covered GHGs for that same period.
Congressional Research Service
14
Carbon Capture and Sequestration (CCS) in the United States
stopped operating the CCS equipment, citing unfavorable economics due to low crude oil prices, though reports suggest the facility may have experienced prior mechanical challenges.54
Petra Nova: The First Large U.S. Power Plant with CCS On January 10, 2017, theLarge U.S. Power Plant with CCS
The Petra Nova–W.A. Parish Generating Station isbecame the first industrial-scale coal-fired electricity-generatingpower plant with CCS to operate in the United States. On January 10, 2017, theThe plant began capturing approximately 5,000 tons of CO2CO2 per day from its 240-megawatt-equivalent slipstream using post- combustion capture technology.4255 The capture technology is approximately 90% efficient (i.e., it captures about 90% of the CO2CO2 in the exhaust gas after the coal is burned to generate electricity) and is projecteddesigned to capture between 1.4 million and 1.6 million tons of CO2tons of CO2 each year.4356 The captured CO2CO2 is transported via an 82-mile pipeline to the West Ranch oil field, where it is injected for enhanced oil recovery (EOR)EOR. NRG Energy, Inc., and JX Nippon Oil & Gas Exploration Corporation, the joint owners of the Petra Nova project, together with Hilcorp Energy Company (which handles the injection and EOR), expect to increaseanticipated increasing West Ranch oil production from 300 barrels per day before EOR to 15,000 barrels per day after EOR.44
57 Petra Nova’s operators turned off the CCS equipment in May 2020, citing low oil prices caused, in part, by the COVID-19 pandemic.58
DOE provided Petra Nova with more than $160 million from its Clean Coal Power Initiative (CCPI) Round 3 funding, using funds appropriated under the American Recovery and Reinvestment Act of 2009 (Recovery Act; ARRA; P.L. 111-5) together with other DOE FER&D funding for a total of more than $190 million of federal funds for the $1 billion retrofit project.4559 Petra Nova is the only CCPI Round 3 project that expended its Recovery ActARRA funding and is currently operating.46began operating.60 The three other CCPI Round 3 demonstration projects funded using Recovery ActARRA appropriations, (as well as the FutureGen project—slated to receive nearly $1 billion in Recovery ActARRA appropriations) all have been canceled, have been suspended, or remain in development.61
54 Jeremy Dillon and Carlos Anchondo, “Low Oil Prices Force Petra Nova Into ‘Mothball Status,’” E&E News, July 28, 2020; and Nichola Groom, “Problems Plagued U.S. CO2 Capture Project Before Shutdown: DOE Document,” Reuters, August 6, 2020.
55 Slipstream refers to the exhaust gases emitted from the power plant. NRG News Release, “NRG Energy, JX Nippon Complete World’s Largest Post-Combustion Carbon Capture Facility On-Budget and On-Schedule,” January 10, 2017, at http://investors.nrg.com/phoenix.zhtml?c=121544&p=irol-newsArticle&ID=2236424.
56 U.S. Department of Energy (DOE), National Energy Technology Laboratory (NETL), “Recovery Act: Petra Nova Parish Holdings: W.A. Parish Post-Combustion CO2 Capture and Sequestration Project,” at https://www.netl.doe.gov/research/coal/project-information/fe0003311.
57 NRG News Release, “NRG Energy, JX Nippon Complete World’s Largest Post-Combustion Carbon Capture Facility On-Budget and On-Schedule,” January 10, 2017, at http://investors.nrg.com/phoenix.zhtml?c=121544&p=irol-newsArticle&ID=2236424.
58 L.M.Sixel, “NRG Mothballs Carbon Capture Project at Coal Plant,” Houston Chronicle, July 31, 2020. 59 U.S. Department of Energy (DOE), National Energy Technology Laboratory (NETL), “Recovery Act: Petra Nova Parish Holdings: W.A. Parish Post-Combustion CO2 Capture and Sequestration Project,” at https://www.netl.doe.gov/research/coal/project-information/fe0003311.
60 For an analysis of carbon capture and sequestration (CCS) projects funded by the American Recovery and Reinvestment Act (P.L. 111-5), see CRS Report R44387, Recovery Act Funding for DOE Carbon Capture and Sequestration (CCS) Projects, by Peter Folger.
61 FutureGen is discussed in more detail in CRS Report R44387, Recovery Act Funding for DOE Carbon Capture and Sequestration (CCS) Projects, by Peter Folger.
Congressional Research Service
15
link to page 21 Carbon Capture and Sequestration (CCS) in the United States
Boundary Dam: World’s First Addition of CCS to a Large Power Plant canceled, have been suspended, or remain in development.47
The Petra Nova plant is projected to capture more CO2 per year than the other currently operating power plant with CCS, Canada's Boundary Dam (which is designed to capture about 1 million tons per year; see "Boundary Dam: World's First Addition of CCS to a Large Power Plant," below). Petra Nova also generates more electricity than Boundary Dam, about 240 megawatts compared to Boundary Dam's 115 megawatts. Both projects retrofitted one unit of much larger multi-unit electricity-generating plants. The Petra Nova project retrofitted Unit 8 of the W.A. Parish power plant, which in total consists of four coal-fired units and six gas-fired units, comprising more than 3.7 gigawatts of gross capacity, making it one of the largest U.S. power plants.
In 2015, the entire W.A. Parish complex emitted nearly 15 million tons of CO2 from all of its generating units.48 The Petra Nova project reduces CO2 emissions overall from the entire complex by about 11%. By comparison, in 2016, total U.S. CO2 emissions from the electricity-generating sector were about 1.8 billion tons.49 The Petra Nova project would reduce that total by a small percentage (about 0.08%). However, according to DOE, a purpose of Petra Nova was to demonstrate that post-combustion capture and reuse can be done economically for existing plants when there is an opportunity to recover oil from nearby oilfields. DOE also has stated that the success of Petra Nova has the potential to enhance the long-term viability and sustainability of coal-fueled power plants across the United States and throughout the world.50
Boundary Dam: World's First Addition of CCS to a Large Power Plant
The Boundary Dam project was the first commercial-scale power plant with CCS in the world to begin operations. Boundary Dam, a Canadian venture operated by SaskPower,5162 cost approximately $1.3 billion, according to one source.5263 Of that amount, $800 million was for building the CCS process and the remaining $500 million was for retrofitting the Boundary Dam Unit 3 coal-fired generating unit. The project also received $240 million from the Canadian federal government. Boundary Dam started operating in October 2014, after a four-year construction and retrofit of the 150-megawatt generating unit. The final project was smaller than earlier plans to build a 300-megawatt CCS plant, but that original idea may have cost as much as $3.8 billion. The larger-scale project was discontinued because of the escalating costs.53
Similar to the Petra Nova project discussed above, 64
Boundary Dam captures, transports, and sells most of its CO2CO2 for EOR, shipping 90% of the captured CO2CO2 via a 41-mile pipeline to the Weyburn Field in Saskatchewan. CO2CO2 not sold for EOR is injected and stored about 2.1 miles underground in a deep saline aquifer at a nearby experimental injection site. By April 2018June 2020, the plant had captured over 23.4 million tons of CO2 CO2 since full-time operations began in October 2014.54 The 115-megawatt (net) plant plans to capture at least 1 million tons of CO2 per year.55
65 The DOE CCS Program
DOE has funded R&D of aspects of the three main steps leading toof an integrated CCS system since 1997. Since FY2010, Congress has provided more than $5 billion total in annual appropriations for CCS activities at DOE. The Recovery Act provided an additional $3.4 billion to that total.56
, primarily through its Fossil Energy and Carbon Management Research, Development, Demonstration, and Deployment program (FECM).66 CCS-focused R&D has come to dominate the coal program area within DOE FER&D since 2010. However, the Trump Administration's FY2019 budget request proposes to shift to other priorities, decreasing the overall FER&D budget by nearly $225 million compared to what Congress enacted for FY2018. The FY2019 budget request cites early-stage research as its focus: "This budget requestFECM since 2010. Since FY2010, Congress has provided $7.3 billion total in annual appropriations for FECM (see Table 2). ARRA provided an additional $3.4 billion to that total, specifically for CCS projects.67
The Trump Administration proposed shifting FECM’s focus to early-stage research, as summarized in the FY2021 budget request for FECM: “This Budget Request focuses DOE resources toward early-stage R&D and reflects an increased reliance on the private sector to fund later-stage research." The Trump Administration's approach would be a reversal of Obama Administration and George W. Bush Administration DOE policies, which supported large carbon-capture demonstration projects and large injection and sequestration demonstration projects. The Administration previously proposed cuts to FER&D in its FY2018 budget request; however, Congress increased funding by nearly $59 million (9%) compared to FY2017.
For FY2019, House-passed appropriations legislation would increase overall funding for DOE FER&D by over $58 million compared to the FY2018 amount, and $283 million above the Administration budget request.57 The Senate-passed version of the appropriations bill would fund DOE FER&D at about the same level as the FY2018 amount, $727 million, also substantially greater than the Administration's request for $502 million.58
Table 2 shows the funding for DOE CCS programs under FER&D from FY2010 through FY2018 and includes the President's FY2019 budget request. Table 2 groups mostly CCS-related programs under the Coal CCS and Power Systems category and the remainder of fossil energy spending under Other Fossil Energy R&D. This grouping follows how Congress has funded these programs. Congress did not accept the Administration's proposed restructuring of the FER&D portfolio in FY2018.
Coal CCS and Power Systems
Compared to the FY2018 total of $727 million enacted for all FER&D, the Administration's FY2019 request of $502 million would be a reduction of approximately 31%. Carbon capture and carbon storage (Table 2) would receive $40 million total under the Administration's request, compared to nearly $200 million for FY2018, an 80% reduction.
The Administration's FY2019 budget request would prioritize the Advanced Energy Systems (AES) account, requesting $175 million, $63 million above the FY2018-enacted amount, nearly a 44% increase. The budget request indicates that AES would focus on six activities: advanced combustion/gasification, advanced turbines, solid oxide fuel cells, advanced sensors and controls, power generation efficiency, and advanced energy materials. Other accounts under the Coal CCS & Power Systems program area are proposed to be funded slightly above or slightly below FY2018 levels, with the exception of CCS activities. Reductions to CCS-related funding would comprise nearly all of the proposed decreased funding for activities in the Coal CCS & Power Systems program area.
Other Fossil Energy Research and Development
The budget request for FY2019 proposes to decrease funding for programs under Other Fossil Energy R&D by nearly $87 million, a 35% reduction compared to FY2018. Program Direction ($60 million in FY2018) provides DOE headquarters support and federal field and contractor support of the FER&D programs overall. Program Direction and National Energy Technology Laboratory (NETL) Coal R&D together provide support to CCS-related activities directly and indirectly.
The budget request proposes to decrease funding for Natural Gas Technologies and Unconventional Fossil activities compared to what Congress enacted in FY2018, from $90 million to $19.5 million for both programs combined. For FY2018, Congress increased funding for those activities (by $16 million compared to FY2017), which support collaborative research to foster development of shale gas resources, the reduction of methane emissions from natural gas infrastructure, and research on gas hydrates. The budget request proposes to eliminate funding for Transformational Coal Pilot programs (called New Fossil Pilot in FY2017). Congress provided $50 million for the program in FY2017 and $35 million in FY2018.59
Table 2. Funding for DOE Fossil Energy Research, Development, and Demonstration Program Areas
(FY2010 through FY2018, including the Trump Administration's FY2019 budget request)
|
FER&D Coal Program Areas |
Program/Activity |
|
|
|
|
|
|
|
|
|
| |||||||||||
|
Coal CCS and Power Systems |
Carbon Capture |
|
|
|
|
|
|
|
|
|
| |||||||||||
|
Carbon Storage |
|
|
|
|
|
|
|
|
|
| ||||||||||||
|
Advanced Energy Systems |
|
|
|
|
|
|
|
|
|
| ||||||||||||
|
Cross-Cutting Research |
|
|
|
|
|
|
|
|
|
| ||||||||||||
|
Supercritical CO2 Technology |
|
|
|
|
|
|
|
|
|
| ||||||||||||
|
NETL Coal R&D |
|
|
|
|
|
|
|
|
|
| ||||||||||||
|
Transformational Coal Pilots |
|
|
|
|
|
|
|
|
|
| ||||||||||||
|
Subtotal Coal |
|
|
|
|
|
|
|
|
|
| ||||||||||||
|
Other FER&D |
Natural Gas Technologies |
|
|
|
|
|
|
|
|
|
| |||||||||||
|
Unconventional Fossil |
|
|
|
|
|
|
|
|
|
| ||||||||||||
|
Program Direction |
|
|
|
|
|
|
|
|
|
| ||||||||||||
|
Plant and Capital |
|
|
|
|
|
|
|
|
|
| ||||||||||||
|
Env. Restoration |
|
|
|
|
|
|
|
|
|
| ||||||||||||
|
Special Recruitment |
|
|
|
|
|
|
|
|
|
| ||||||||||||
|
NETL R&D |
|
|
|
|
|
|
|
|
|
| ||||||||||||
|
NETL Inf. & Ops |
|
|
|
|
|
|
|
|
|
| ||||||||||||
|
Coop R&D |
|
|
|
|
|
|
|
|
|
| ||||||||||||
|
New Fossil Pilot |
|
|
|
|
|
|
|
|
|
| ||||||||||||
|
Directed Projects |
|
|
|
|
|
|
|
|
|
| ||||||||||||
|
Subtotal Other FER&D |
|
|
|
|
|
|
|
|
|
| ||||||||||||
|
Rescissions/Use of Prior-Year Balances |
|
|
|
|
|
|
|
|
|
| ||||||||||||
|
Total FER&D |
|
|
|
|
|
|
|
|
|
| ||||||||||||
|
|
|
|
|
|
|
|
|
|
Sources: U.S. Department of Energy annual budget justifications for FY2012 through FY2019, development, and commercialization of energy technologies.”68 The Trump Administration’s approach would have been a reversal of Obama Administration and George W.
62 SaskPower is the principal electric utility in Saskatchewan, Canada. 63 MIT Carbon Capture & Sequestration Technologies, CCS Project Database, “Boundary Dam Fact Sheet: Carbon Capture and Storage Project,” at http://sequestration.mit.edu/tools/projects/boundary_dam.html.
64 Ibid. 65 SaskPower, BD3 Status Update: June 2020, at https://www.saskpower.com/about-us/our-company/blog/bd3-status-update-june-2020.
66 The Fossil Energy and Carbon Management Research, Development, Demonstration, and Deployment appropriations account was previously known as the Fossil Energy Research and Development (FER&D) account. The Biden Administration renamed the Office of Fossil Energy as the Office of Fossil Energy and Carbon Management in 2021. This name change was also adopted by appropriators throughout the FY2022 appropriations process. See DOE, “Our New Name Is Also a New Vision,” July 8, 2021, at https://www.energy.gov/fe/articles/our-new-name-also-new-vision.
67 Authority to expend American Recovery and Reinvestment Act (ARRA; P.L. 111-5) funds expired in 2015. An analysis of ARRA funding for CCS activities at DOE is provided in CRS Report R44387, Recovery Act Funding for DOE Carbon Capture and Sequestration (CCS) Projects, by Peter Folger.
68 DOE, FY2021 Congressional Budget Request, Volume 3 Part 2, February 2021, p. 195.
Congressional Research Service
16
link to page 21 Carbon Capture and Sequestration (CCS) in the United States
Bush Administration DOE policies, which supported large carbon-capture demonstration projects and large injection and sequestration demonstration projects. Congress instead provided annual increases in the first three years of the Trump Administration and continued support for demonstration projects. The Biden Administration has also supported funding CCS demonstration projects. Table 2 shows the funding for DOE CCS programs under FECM from FY2010 through FY2021.69
69 For information on FY2021 and FY2022 appropriations, see CRS In Focus IF11861, Funding for Carbon Capture and Carbon Removal at DOE, by Ashley J. Lawson.
Congressional Research Service
17
link to page 22 link to page 22
Table 2. Funding for DOE Fossil Energy and Carbon Management Research, Development, Demonstration, and Deployment
Program (FECM) Program Areas
FY2010 through FY2021
FECM Program
Program/
FY2010 FY2011 FY2012 FY2013 FY2014 FY2015 FY2016
FY2017
FY2018
FY2019
FY2020
FY2021
Areas
Activity
($1,000) ($1,000) ($1,000) ($1,000) ($1,000) ($1,000) ($1,000) ($1,000) ($1,000) ($1,000) ($1,000) ($1,000)
CCUS and Power
Carbon Capture
—
58,703
66,986
63,725
92,000
88,000
101,000
101,000
100,671
100,671
117,800
126,300
Systems
Carbon
23,000
Utilization
Carbon Storage
—
120,912
112,208
106,745
108,766
100,000
106,000
95,300
98,096
98,096
100,000
79,000
Advanced Energy
—
168,627
97,169
92,438
99,500
103,000
105,000
105,000
112,000
129,683
120,000
122,000
Systems
Cross-Cutting
—
41,446
47,946
45,618
41,925
49,000
50,000
45,500
58,350
56,350
56,000
72,000
Research
Supercritical
—
—
—
—
—
10,000
15,000
24,000
24,000
22,430
16,000
14,500
CO2 Technology
NETL Coal R&D
—
—
35,011
33,338
50,011
50,000
53,000
53,000
53,000
54,000
61,000
0
Transformational
—
—
—
—
—
—
—
50,000a
35,000
25,000
20,000
10,000
Coal Pilotsa
Subtotal CCUS and
393,485 389,688 359,320 341,864 392,202 400,000 430,000
423,800
481,117
486,230
490,800
446,800
Power Systems
Other FECM
Natural Gas
17,364
0
14,575
13,865
20,600
25,121
43,000
43,000
50,000
51,000
51,000
57,000
Technologies
Unconventional
19,474
0
4,859
4,621
15,000
4,500
20,321
21,000
40,000
46,000
46,000
46,000
Fossil
Program
158,000
164,725
119,929
114,201
120,000
119,000
114,202
60,000
60,000
61,070
61,500
61,500
Direction
Plant and Capital
20,000
19,960
16,794
15,982
16,032
15,782
15,782
—
—
—
—
—
CRS-18
FECM Program
Program/
FY2010 FY2011 FY2012 FY2013 FY2014 FY2015 FY2016
FY2017
FY2018
FY2019
FY2020
FY2021
Areas
Activity
($1,000) ($1,000) ($1,000) ($1,000) ($1,000) ($1,000) ($1,000) ($1,000) ($1,000) ($1,000) ($1,000) ($1,000)
Env. Restoration
10,000
9,980
7,897
7,515
5,897
5,897
7,995
—
—
—
—
—
Special
700
699
700
667
700
700
700
700
700
700
700
700
Recruitment
NETL Research
—
—
—
—
—
—
0
43,000
50,000
50,000
50,000
83,000
and Operations
NETL
—
—
—
—
—
—
0
40,500
45,000
45,000
50,000
55,000
Infrastructure
Coop R&D
4,868
—
—
—
—
—
—
—
—
—
Directed
35,879
—
—
—
—
—
—
—
—
—
Projects
Subtotal Other
266,285 195,364 164,754 156,851 178,229 171,000 202,000
258,200
245,700
253,770
259,200
303,200
FECM
Rescissions/Use of
— (151,000) (187,000)
—
—
—
—
(14,000)
—
—
Prior-Year Balances
Total FECM
659,770 434,052 337,074 498,715 570,431 571,000 632,000
668,000
726,817
740,000
750,000
750,000
FY2010-FY2021
Grand Total
$7.3B
Sources: U.S. Department of Energy annual budget justifications for FY2012 through FY2021; explanatory statement for P.L. 115-141, Division D (Consolidated Appropriations Act, 2018, at https://rules.house.gov/bill/bil /115/hr-1625-sa).
). Notes: CO2 = CarbonCO2 = carbon dioxide; CCSCCUS = carbon capture utilization and sequestration (or storage); FER&DFECM = Fossil Energy Research and Developmentand Carbon Management Research, Development, Demonstration, and Deployment program; NETL = National Energy Technology Laboratory; Inf. & Ops = Infrastructure and Operations; Coop = Cooperative; R&D = Researchinfrastructure and operations; Coop = cooperative; R&D = research and development. Directed Projects refer to congressionally directed projects. Program areas are as used in the explanatory statement for FY2021 appropriations; previous appropriations language used alternative names for some program areas and may not be completely comparable. Grand total for FY2010-FY2018FY2021 subject to rounding. Amounts provided by the American Recovery and Reinvestment Act of 2009 (ARRA; P.L. 111-5) are not shown in the table or included in the grand total. The carbon utilization program was first authorized for FY2021 as part of P.L. 116-260. a. Funding for Transformational Coal Pilots was first provided as a proviso in FY2017 appropriations. See explanatory statement for P.L. 115-31, Consolidated
Appropriations Act, 2017, Division D at https://www.gpo.gov/fdsys/pkg/CPRT-115HPRT25289/pdf/CPRT-115HPRT25289.pdf.
CRS-19
Carbon Capture and Sequestration (CCS) in the United States
EPA Regulation of Underground Injection in CCS EPA issues regulations for underground injection of CO2 as part of its responsibilities for underground injection control (UIC) programs under the Safe Drinking Water Act (SDWA). EPA also develops guidance to support state program implementation, and in some cases, directly administers UIC programs in states.70 The agency has established minimum requirements for state UIC programs and permitting for injection wells. These requirements include performance standards for well construction, operation and maintenance, monitoring and testing, reporting and recordkeeping, site closure, financial responsibility, and, for some types of wells, post injection site care. Most states implement the day-to-day program elements for most categories of wells, which are grouped into “classes” based on the type of fluid injected. Owners or operators of underground injection wells must follow the permitting requirements and standards established by the UIC program authority in their state.
EPA has issued regulations for six classes of underground injection wells based on type and depth of fluids injected and potential for endangerment of underground sources of drinking water (USDWs). Class II wells are used to inject fluids related to oil and gas production, including injection of CO2 for EOR. Class VI wells are used to inject CO2 for geologic sequestration. There are more than 119,500 EOR wells injecting CO2 in the United States, predominantly in California, Texas, Kansas, Illinois, and Oklahoma.71 This includes EOR wells used to inject CO2 captured from anthropogenic sources and wells using naturally derived CO2. Two EPA-permitted wells are currently operating for sequestration in the United States, both located at the ADM facility in Illinois.72
To protect USDWs from injected CO2 or movement of other fluids in an underground formation, Class II EOR wells must transition to Class VI geologic sequestration wells under certain conditions.73 Class II well owners or operators who inject CO2 primarily for long-term storage (rather than oil production) must obtain a Class VI permit when there is an increased risk to USDWs compared to prior Class II operations using CO2. The Class VI Program Director (EPA or a delegated state) determines whether a Class VI permit is required based on site-specific risk factors associated with USDW endangerment. To date, no such transition has been required.
70 40 C.F.R. §§144-147. 71 EPA, FY19 State UIC Injection Well Inventory, accessed November 27, 2020. 72 EPA has granted North Dakota and Wyoming primary enforcement authority for Class VI well programs in those states.
73 40 C.F.R. §144.19.
Congressional Research Service
20
Carbon Capture and Sequestration (CCS) in the United States
The 45Q Tax Credit for CCS74
included in the grand total.
CCS-Related Legislation in the 115th Congress
A number of bills introduced in the 115th Congress would potentially affect CCS in the United States. Several bills or provisions of bills address Internal Revenue Code, Section 45Q, providing tax credits for CO2 capture and sequestration or use as a tertiary injectant for EOR or natural gas production (S. 1535, S. 1663, S. 2256, H.R. 1892, H.R. 2010, H.R. 3761, H.R. 4857, (see Appendix). H.R. 1892, the Bipartisan Budget Act of 2018, was enacted into law as P.L. 115-123. The provisions of P.L. 115-123 that amended Section 45Q and their implications are discussed in more detail in the text box below.
Other bills also would amend the Internal Revenue Code in ways affecting CCS. For example, S. 843 and H.R. 2011 would amend Section 142 of the Internal Revenue Code to allow qualified CO2 capture facilities that capture 65% or more of their CO2 emissions to be eligible for tax-exempt private activity bonds.60 The bills assert that
allowing tax-exempt financing for the purchase of capital equipment that is used to capture carbon dioxide will reduce the costs of developing carbon dioxide capture projects, accelerate their deployment, and, in conjunction with carbon dioxide utilization and long-term storage, help the United States meet critical environmental, economic, and national security goals.
Several bills would address federal efforts to enhance CCS or emphasize different aspects of the process across three different federal agency and departmental jurisdictions: EPA, DOE, and the Department of Agriculture. S. 2602, for example, would authorize activities under EPA jurisdiction to support direct air capture and utilization of CO2, and would include carbon capture infrastructure projects as eligible under the FAST Act, as part of the bill's intent to expedite the permitting process for CCS. The legislation would add CCS infrastructure projects explicitly as eligible covered projects, meaning any infrastructure construction activity requiring authorization or environmental review by a federal agency.61
S. 2803 and H.R. 5745 would amend the Energy Policy Act of 2005 (P.L. 109-58) to authorize DOE to further its CCS research, development, and deployment (RD&D) activities, and place a greater emphasis on CO2 utilization. S. 2803 would also authorize a project aimed to achieve net-negative CO2 emissions—projects utilizing biomass and fossil fuels to produce electricity, fuels, or chemicals—with a net removal of CO2 from the atmosphere. S. 2997 would authorize the Secretary of Agriculture to pursue biomass-related CCS R&D projects, and would authorize the use of loans or loan guarantees for biomass-related CO2 capture and utilization activities. H.R. 2296 would focus on DOE CCS-related activities and require the department to evaluate its RD&D projects and make recommendations whether each project should continue to receive funding based on progress toward its CCS goals. H.R. 4096 would establish a $5 million prize for CCS-related technology development and commercialization, pursuant to Section 24 of the Stevenson-Wydler Technology Innovation Act of 1980 (15 U.S.C. 3719).62 H.R. 5745 would authorize or encourage RD&D activities across the spectrum of CCS, including carbon capture, carbon sequestration, carbon utilization, and carbon removal (including direct air capture), and would authorize a $15 million prize competition to develop direct air capture technology. The bill also would establish a task force to assess the potential for a national system of CO2 pipelines.
P.L. 115-123: Amending the 45Q Tax Credit for CCS Title II, Section 41119 of P.L. 115-123, the Bipartisan Budget Act of 2018, amended Internal Revenue Code Some observers noted that the 75 million ton cap did not provide enough financial certainty for investors in typically capital-intensive CCS construction projects. Proponents of CCS also pointed to the difficulty in transferability of the credits, and the small value of the credits, as impediments to more widespread adoption of CCS.
January 1, 2026.75 To qualify, a minimum amount of The modifications to 45Q in P.L. 115- Some stakeholders Opponents to
|
Discussion
Currently the Petra Nova plant in Texas is the sole U.S. commercial large-scale fossil-fueled power plant with CCS, capturing over 1 million tons of CO2 annually. The Boundary Dam power plant in Canada is the only other commercial fossil-fueled electricity generating plant in the world operating with CCS and capturing a nearly equivalent volume of CO2. Both plants offset a portion of the cost of CCS by selling CO2 for the purpose of enhanced oil recovery. Some CCS proponents have hailed the expanded tax credit provision enacted as part of P.L. 115-123, increasing the value of tax credits under Section 45Q of the Internal Revenue Code, as a potential "game changer" for incentivizing more development of large-scale CCS deployment like Petra Nova and Boundary Dam.
Some CCS proponents advocate for other incentives, such as tax-exempt private activity bonds, and enabling eligibility of master limited partnerships for CCS infrastructure projects, which could also increase the financial attractiveness of large-scale capital-intensive CCS endeavors. According to CCS proponents, private activity bonds would allow CCS project developers access to tax-exempt debt, thus lowering their capital costs. Master limited partnerships would allow a corporate structure to combine the tax benefits of a partnership with a corporation's ability to raise capital, reducing the cost of equity and providing access to capital on more favorable terms, according to proponents.
Members of Congress have introduced legislation that would authorize these financial incentives, as well as a suite of other bills aimed at advancing CCS by making CCS infrastructure projects eligible under the FAST Act (42 U.S.C. 4370m(6)), supporting increased research and development for conventional CCS and for carbon utilization technologies and direct air capture of CO2. Several bills would authorize technology prizes for advances in CCS R&D, including for utilization technologies and direct air capture.
P.L. 115-123 was enacted on February 9, 2018, and it likely will take time to evaluate the impact on U.S. CCS activities. Other factors, such as the price of oil, which could affect demand for EOR and thus CO2, and the price of natural gas—which could affect the substitution of natural gas for coal in electricity production—will also shape the extent and rapidity of CCS adoption as well. Enactment of other legislation introduced in the 115th Congress (Appendix) that would provide additional incentives for CCS could also influence future CCS activities.
Ultimately the success of legislative approaches advocated by bill sponsors, and more broadly by CCS proponents, will be measured by how those approaches reduce costs for CCS, through financial incentives, technology development, and commercially viable CO2-based products, so that the suite of CCS technologies would be more broadly deployed. Absent a policy mandate for reducing CO2 emissions, or rewarding CO2 capture and storage or utilization (apart from the 45Q tax incentives enacted in P.L. 115-123), there is broad agreement that costs for CCS would need to decrease before the technologies are commercially deployed across the nation.
The issue of greater CCS deployment is fundamental to the underlying reason CCS is deemed important by a range of proponents: to reduce CO2 emissions (or reduce the concentration of CO2 in the atmosphere) and help mitigate against human-induced climate change. The conventional concept of CCS whereby CO2 emissions from large stationary sources in the United States, such as fossil fuel electricity generating plants, refineries, cement plants, and others was recognized early on as a potential pathway to reducing a large amount greenhouse gas emissions from a relatively small number of point sources.63 The U.S. fossil fuel electricity generation sector alone emitted 1.8 billion tons of CO2 in 2016, or 34% of total U.S. CO2 emissions (5.31 billion tons) that year.64
The emerging technologies for utilizing CO2 for a variety of uses and products (carbon utilization, see Figure 5) has energized some CCS advocates because of the commercial potential and prospects for the sequestration of CO2 in long-lasting products such as cements and plastics. A challenge for utilization advocates is whether the market for carbon utilization products and uses is sufficiently large so that the amount of CO2 captured or removed from the atmosphere has some measurable effect on human-induced climate change.
Direct air capture (DAC) also has energized some CCS advocates as it offers the promise of net-negative carbon removal if the CO2 removed by DAC is permanently stored or sequestered. The challenge for DAC is fairly straightforward—how to reduce the cost per ton of CO2 removed.
|
Bill Number |
Short Title |
Status |
Short Summary |
|
Carbon Capture Improvement Act of 2017 |
Referred to Committee on Finance |
| |
|
Furthering Carbon Capture, Utilization, Technology, Underground Storage, and Reduced Emissions Act |
Referred to Committee on Finance |
Amends the Internal Revenue Code, Section 45Q, to increase the carbon oxide sequestration credit from $20 per metric ton for permanent sequestration, and $10 per ton as a tertiary injectant for enhanced oil and gas recovery, to $22.66 up to $50 per ton through 2027 and $12.83 up to $35 per ton over the same time span for permanent sequestration and enhanced oil and gas recovery, respectively. Includes direct air capture facilities with other industrial facilities as qualified facilities for the credits. Includes carbon utilization as one of the categories eligible for the credit. Related bills S. 2256, H.R. 1892, H.R. 3761. |
|
|
CO2 Regulatory Certainty Act |
Referred to Committee on Finance |
Amends the Internal Revenue Code to revise requirements for the secure geological storage of carbon dioxide for the purpose of the tax credit for carbon dioxide sequestration. Establishes a December 31, 2017, deadline and requirements for regulations that the Internal Revenue Service (IRS) is required, under current law, to establish for determining adequate security measures for the geological storage of the carbon dioxide such that carbon dioxide does not escape into the atmosphere. Related bills H.R. 2010, H.R. 4857. |
|
|
Master Limited Partnerships Parity Act |
Referred to Committee on Finance |
Amends the Internal Revenue Code, with respect to the tax treatment of publicly traded partnerships as corporations, to expand the definition of "qualifying income" for such partnerships (known as master limited partnerships) to include income and gains from renewable and alternative energy generation projects, including carbon capture in secure geological storage. Related bill H.R. 4118. |
|
|
Tax Extender Act of 2017 |
Referred to Committee on Finance |
Title IV: amends the Internal Revenue Code, Section 45Q, to increase the carbon oxide sequestration credit from $20 per metric ton for permanent sequestration, and $10 per ton as a tertiary injectant for enhanced oil and gas recovery, to $22.66 up to $50 per ton through 2027 and $12.83 up to $35 per ton over the same time span for permanent sequestration and enhanced oil and gas recovery, respectively. Includes direct air capture facilities with other industrial facilities as qualified facilities for the credits. Includes carbon utilization as one of the categories eligible for the credit. Related bills H.R. 1892, H.R. 3761, S. 1535. |
|
|
Utilizing Significant Emissions with Innovative Technologies Act |
Placed on Senate Legislative Calendar |
Title 1: authorizes the Administrator of the EPA to support activities that help develop direct air capture of CO2, including a technology prize program; authorizes the EPA Administrator to carry out an R&D program to promote CO2 utilization. Title II: amends FAST Act (42 U.S.C. 4370m(6)) to include CO2 pipelines and infrastructure for carbon capture within the definition of eligible projects. |
|
|
Fossil Energy Utilization , Enhancement, and Leadership Act of 2018 |
Referred to Committee on Energy and Natural Resources |
Amends the Energy Policy Act of 2005 (EPAct, P.L. 109-58) to establish a coal technology program to include an R&D program, pilot-scale and demonstration projects, net-negative CO2 emissions projects, and a front-end engineering and design program for fossil fuel power plants that would include carbon capture, utilization, and storage. Amends EPAct to establish a carbon utilization program; establishes a task force on CO2 pipelines; establishes a DOE program for extracting rare-earth elements from coal. |
|
|
Carbon Utilization Act of 2018 |
Referred to Committee on Agriculture, Nutrition, and Forestry |
Amends the 2002 farm bill (P.L. 107-171) to include CO2 capture, utilization, and sequestration from biomass-related facilities; authorizes a carbon utilization education program; authorizes the Secretary of Agriculture to provide loans or loan guarantees for CO2 capture and utilization. |
|
|
Bipartisan Budget Act of 2018 |
Enacted as P.L. 115-123 |
Title II, Section 41119: amended the Internal Revenue Code, Section 45Q, to increase the carbon oxide sequestration credit from $20 per metric ton for permanent sequestration, and $10 per ton as a tertiary injectant for enhanced oil and gas recovery, to $22.66 up to $50 per ton through 2027 and $12.83 up to $35 per ton over the same time span for permanent sequestration and enhanced oil and gas recovery, respectively. Includes direct air capture facilities with other industrial facilities as qualified facilities for the credits. Includes carbon utilization as one of the categories eligible for the credit. |
|
|
CO2 Regulatory Certainty Act |
Referred to Committee on Ways and Means |
Amends the Internal Revenue Code to revise requirements for the secure geological storage of carbon dioxide for the purpose of the tax credit for carbon dioxide sequestration. Establishes a December 31, 2017, deadline and requirements for regulations that the Internal Revenue Service (IRS) is required, under current law, to establish for determining adequate security measures for the geological storage of the carbon dioxide such that carbon dioxide does not escape into the atmosphere. Related bills S. 1663, H.R. 4857. |
|
|
Carbon Capture Improvement Act of 2017 |
Referred to Committee on Ways and Means |
Amends the Internal Revenue Code to authorize the issuance of tax-exempt facility bonds for the financing of qualified carbon dioxide capture facilities. Related bill S. 843. |
|
|
Advancing CCUS Technology Act |
Referred to Committee on Energy and Commerce, Committee on Science, Space, and Technology |
Amends the Energy Policy Act of 2005 (P.L. 109-58) to direct the Department of Energy (DOE) to carry out research and develop technology to improve the conversion, use, and storage of carbon dioxide from fossil fuels. It also revises the program of research and commercial application for coal and power systems to require DOE, during each fiscal year after FY2017, to identify cost and performance goals for technologies allowing large-scale demonstration and the continued cost-competitive commercial use of coal. |
|
|
Carbon Capture Act |
Referred to Committee on Ways and Means |
Amends the Internal Revenue Code, Section 45Q, to allow credit for certain qualified projects for the sequestration or utilization of CO2 for 15 years beginning on the date the equipment was placed in service; increases the credit to up to $35 per ton for certain qualified projects over the 15-year time span. Includes direct air capture facilities with other industrial facilities as a qualified facility. |
|
|
Carbon Capture Prize Act |
Referred to Committee on Science, Space, and Technology |
Authorizes the Secretary of Energy to award a $5 million prize to the winner or winners of a competition for research, development, or commercialization of a technology that would reduce the amount of carbon in the atmosphere including by capturing and sequestering CO2 or reducing CO2 emissions. |
|
|
Master Limited Partnerships Parity Act |
Referred to Committee on Ways and Means |
Amends the Internal Revenue Code, with respect to the tax treatment of publicly traded partnerships as corporations, to expand the definition of "qualifying income" for such partnerships (known as master limited partnerships) to include income and gains from renewable and alternative energy generation projects, including carbon capture in secure geological storage. Related bill S. 2005. |
|
|
Regulatory Certainty Act |
Referred to Committee on Ways and Means |
Amends the Internal Revenue Code to revise requirements for the secure geological storage of carbon dioxide for the purpose of the tax credit for carbon dioxide sequestration. Establishes a December 31, 2018, deadline and requirements for regulations that the Internal Revenue Service (IRS) is required, under current law, to establish for determining adequate security measures for the geological storage of the carbon dioxide such that carbon dioxide does not escape into the atmosphere. Related bills H.R. 2010, S. 1663. | |
|
Fossil Energy Research and Development Act of 2018 |
Referred to Committee on Science, Space, and Technology, Committee on Transportation and Infrastructure |
Amends the Energy Policy Act of 2005 (P.L. 109-58) to expand the scope of DOE fossil energy research activities that include improving the conversion, use, and storage of CO2 from fossil fuel combustion. Authorizes research, development, demonstration, and commercial application at DOE of carbon capture technologies. Encourages DOE support for large-scale pilot programs (including carbon capture pilot test centers) and for large-scale demonstration projects. Reauthorizes RD&D of carbon storage activities at DOE (including the regional sequestration partnerships). Establishes an RD&D program for carbon utilization activities. Establishes an interagency task force to investigate the potential for a national system of CO2 pipelines. Establishes an RD&D program for carbon removal (including direct air capture) and authorizes a $15 million prize competition to develop direct air capture technologies. |
Source: CRS.
Notes: CCS is carbon capture and sequestration (or storage). CCUS is carbon capture, utilization, and storage. In this report, the amount of CO2 is stated in metric tons, or 1,000 kilograms, which is approximately 2,200 pounds. Hereinafter, the unit tons means metric tons.
Author Contact Information
Footnotes
| 1. |
Carbon capture and sequestration (CCS) also could be used to capture carbon dioxide (CO2) emissions from power plants that use bioenergy sources instead of fossil fuels. |
| 2. |
See, for example, U.S. DOE, National Energy Technology Laboratory, CO2 Utilization Focus Area, at https://www.netl.doe.gov/research/coal/carbon-storage/research-and-development/co2-utilization. |
| 3. |
DOE, NETL, "Carbon Capture Program," fact sheet, June 2016, at https://www.netl.doe.gov/File%20Library/Research/Coal/carbon%20capture/Carbon-Capture-Factsheet-June-2016.pdf. |
| 4. |
Ibid. |
| 5. |
White House, Report of Interagency Task Force on Carbon Capture and Storage, August 2010, p. 9, at https://energy.gov/sites/prod/files/2013/04/f0/CCSTaskForceReport2010_0.pdf. |
| 6. |
See, for example, Howard J. Herzog, Edward S. Rubin, and Gary T. Rochelle, "Comment on 'Reassessing the Efficiency Penalty from Carbon Capture in Coal-Fired Power Plants,'" Environmental Science and Technology, vol. 50 (May 12, 2016), pp. 6112-6113. |
| 7. |
Flue gas refers to the emissions from combusting fossil fuels to generate steam at the plant. For post-combustion capture using air, the flue gas consists mostly of nitrogen, CO2, and water vapor. |
| 8. |
Amines are a family of organic solvents, which can "scrub" the CO2 from the flue gas. When the CO2-laden amine is heated, the CO2 is released to be compressed and stored, and the depleted solvent is recycled. |
| 9. |
See CRS Report R41325, Carbon Capture: A Technology Assessment, by [author name scrubbed]. |
| 10. |
Injecting CO2 into an oil reservoir often increases or enhances production by lowering the viscosity of the oil, which allows it to be pumped more easily from the formation. The process is sometimes referred to as tertiary recovery or enhanced oil recovery (EOR). |
| 11. |
For a more detailed description of the Great Plains Synfuels plant, see DOE, NETL, "SNG from Coal: Process & Commercialization," at https://www.netl.doe.gov/research/coal/energy-systems/gasification/gasifipedia/great-plains. |
| 12. |
Nitrogen oxides emissions lead to the formation of ozone, a criteria pollutant. |
| 13. |
For more information see DOE, National Energy Technology Laboratory, Oxy-Combustion, at https://www.netl.doe.gov/research/coal/energy-systems/advanced-combustion/oxy-combustion. |
| 14. |
Mathew Wallace et al., A Review of the CO2 Pipeline Infrastructure in the U.S., DOE, DOE/NETL-2014/1681, April 21, 2015, at https://energy.gov/sites/prod/files/2015/04/f22/QER%20Analysis%20-%20A%20Review%20of%20the%20CO2%20Pipeline%20Infrastructure%20in%20the%20U.S_0.pdf. |
| 15. |
|
| 16. |
Also, when injected underground to depths greater than 800 meters (about half a mile), the overlying pressure keeps CO2 in a supercritical state, making it less likely to migrate out of the geological formation. |
| 17. |
In this report, the amount of CO2 is stated in metric tons, or 1,000 kilograms, which is approximately 2,200 pounds. Hereinafter, the unit tons means metric tons. |
| 18. |
IPCC Special Report, p. 31. |
| 19. |
Mathew Wallace et al., A Review of the CO2 Pipeline Infrastructure in the U.S., DOE, April 21, 2015, p. 1. |
| 20. |
Ibid. |
| 21. |
DOE, NETL, "Regional Carbon Sequestration Partnership (RCSP) Initiative," at https://www.netl.doe.gov/research/coal/carbon-storage/carbon-storage-infrastructure/rcsp. |
| 22. |
Ibid. |
| 23. |
Sedimentary basins refer to natural large-scale depressions in the Earth's surface that are filled with sediments and fluids and are therefore potential reservoirs for CO2 storage. |
| 24. |
For comparison, in 2016 the United States emitted 1.8 billion tons of CO2 from the electricity generating sector. See U.S. Environmental Protection Agency, Inventory of U.S. Greenhouse Gas Emissions and Sinks 1990-2016, EPA 430-R-18-003, April 12, 2018, pp. ES-6, https://www.epa.gov/ghgemissions/inventory-us-greenhouse-gas-emissions-and-sinks. |
| 25. |
Porosity refers to the amount of open space in a geologic formation—the openings between the individual mineral grains or rock fragments. Permeability refers to the interconnectedness of the open spaces, or the ability of fluids to migrate through the formation. Leakage means that the injected CO2 can migrate up and out of the intended reservoir, instead of staying trapped beneath a layer of relatively impermeable material, such as shale. |
| 26. |
As of 2014. See Vello Kuuskraa and Matt Wallace, "CO2-EOR Set for Growth as New CO2 Supplies Emerge," Oil and Gas Journal, vol. 112, no. 4 (April 7, 2014), p. 66. Hereinafter Kuuskraa and Wallace, 2014. |
| 27. |
As of 2014, nearly two-thirds of oil production using CO2 for EOR came from the Permian Basin, located in western Texas and southeastern New Mexico. Kruskaa and Wallace, 2014, p. 67. |
| 28. |
The U.S. Environmental Protection Agency (EPA) regulates this practice under authority of the Safe Drinking Water Act, Underground Injection Control (UIC) program. See the EPA UIC program at https://www.epa.gov/uic/class-ii-oil-and-gas-related-injection-wells. |
| 29. |
Coal bed and coal seam are interchangeable terms. |
| 30. |
IPCC Special Report, p. 217. |
| 31. |
DOE's Office of Fossil Energy refers to its CCS program activities as the Carbon Capture, Utilization, and Storage Research. See https://www.energy.gov/fe/science-innovation/office-clean-coal-and-carbon-management. |
| 32. |
P.L. 115-123, §41119. A tertiary injectant refers to the use of CO2 for EOR or enhanced natural gas recovery. |
| 33. |
U.S. DOE, National Energy Technology Laboratory, CO2 Utilization Focus Area, at https://www.netl.doe.gov/research/coal/carbon-storage/research-and-development/co2-utilization. |
| 34. |
U.S. DOE, National Energy Technology Laboratory, CO2 Utilization Focus Area. |
| 35. |
Reflects an estimate as of 2011, which included 50 million tons for EOR in the United States. Global CCS Institute, Accelerating the Uptake of CCS: Industrial use of Captured Carbon Dioxide, December 20, 2011, http://hub.globalccsinstitute.com/publications/accelerating-uptake-ccs-industrial-use-captured-carbon-dioxide. CO2 use for EOR in the United States in 2014 was estimated at 68 million tons in 2014 (see footnote 38), so the global amount is likely higher. |
| 36. |
Global CCS Institute, 2011. |
| 37. |
For a detailed assessment of DAC technology, see the American Physical Society, Direct Air Capture of CO2 With Chemicals, A Technology Assessment for the APS Panel on Public Affairs, June 1, 2011, at https://www.aps.org/policy/reports/assessments/upload/dac2011.pdf. Hereinafter American Physical Society, 2011. |
| 38. |
Generally, the more dilute the concentration of CO2, the higher the cost to extract it, because much larger volumes are required to be processed. By comparison, the concentration of CO2 in the atmosphere is about 0.04%, whereas the concentration of CO2 in the flue gas of a typical coal-fired power plant is about 14%. |
| 39. |
American Physical Society, 2011, p. 13. |
| 40. |
Robert F. Service, "Cost Plunges for Capturing Carbon Dioxide from the Air," Science, June 7, 2018, http://www.sciencemag.org/news/2018/06/cost-plunges-capturing-carbon-dioxide-air. |
| 41. |
Lawrence Irlam, The Costs of CCS and Other Low-Carbon Technologies in the United States-2015 Update, Global CCS Institute, July 2015, p. 1, http://www.globalccsinstitute.com/publications/costs-ccs-and-other-low-carbon-technologies-2015-update. |
| 42. |
Slipstream refers to the exhaust gases emitted from the power plant. NRG News Release, "NRG Energy, JX Nippon Complete World's Largest Post-Combustion Carbon Capture Facility On-Budget and On-Schedule," January 10, 2017, at http://investors.nrg.com/phoenix.zhtml?c=121544&p=irol-newsArticle&ID=2236424. |
| 43. |
Global CCS Institute, Projects Database, "Petra Nova Carbon Capture," at http://www.globalccsinstitute.com/projects/petra-nova-carbon-capture-project; and Christa Marshal and Edward Klump, "Carbon Capture Takes a 'Huge Step' with First U.S. Plant," Energy Wire, January 10, 2017, at https://www.eenews.net/energywire/stories/1060048090/search?keyword=petra+nova. |
| 44. |
NRG News Release, "NRG Energy, JX Nippon Complete World's Largest Post-Combustion Carbon Capture Facility On-Budget and On-Schedule," January 10, 2017, at http://investors.nrg.com/phoenix.zhtml?c=121544&p=irol-newsArticle&ID=2236424. |
| 45. |
U.S. Department of Energy (DOE), National Energy Technology Laboratory (NETL), "Recovery Act: Petra Nova Parish Holdings: W.A. Parish Post-Combustion CO2 Capture and Sequestration Project," at https://www.netl.doe.gov/research/coal/project-information/fe0003311. |
| 46. |
For an analysis of carbon capture and sequestration (CCS) projects funded by the American Recovery and Reinvestment Act (P.L. 111-5), see CRS Report R44387, Recovery Act Funding for DOE Carbon Capture and Sequestration (CCS) Projects, by [author name scrubbed]. |
| 47. |
FutureGen is discussed in more detail in CRS Report R44387, Recovery Act Funding for DOE Carbon Capture and Sequestration (CCS) Projects, by [author name scrubbed]. |
| 48. |
U.S. Environmental Protection Agency, "2015 Greenhouse Gas Emissions from Large Facilities, W.A. Parish," at https://ghgdata.epa.gov/ghgp/service/facilityDetail/2015?id=1006868&ds=E&et=FC_CL&popup=true. |
| 49. |
U.S. Environmental Protection Agency, Inventory of U.S. Greenhouse Gas Emissions and Sinks 1990-2016, EPA 430-R-18-003, April 12, 2018, pp. ES-6, https://www.epa.gov/ghgemissions/inventory-us-greenhouse-gas-emissions-and-sinks. |
| 50. |
DOE, NETL, "Recovery Act: Petra Nova Parish Holdings: W.A. Parish Post-Combustion CO2 Capture and Sequestration Project," at https://www.netl.doe.gov/research/coal/project-information/fe0003311. |
| 51. |
SaskPower is the principal electric utility in Saskatchewan, Canada. |
| 52. |
MIT Carbon Capture & Sequestration Technologies, CCS Project Database, "Boundary Dam Fact Sheet: Carbon Capture and Storage Project," at http://sequestration.mit.edu/tools/projects/boundary_dam.html. |
| 53. |
Ibid. |
| 54. |
SaskPower, BD3 Status Update: April 2018, at https://www.saskpower.com/about-us/our-company/blog/bd3-status-update-april-2018. |
| 55. |
Net power refers to the gross amount of power generated by the plant minus the electricity used to operate the plant. In this case, the electricity used to operate the plant includes the amount of electricity used for carbon capture. |
| 56. |
Authority to expend American Recovery and Reinvestment Act (Recovery Act; P.L. 111-5) funds expired in 2015. An analysis of Recovery Act funding for CCS activities at DOE is provided in CRS Report R44387, Recovery Act Funding for DOE Carbon Capture and Sequestration (CCS) Projects, by [author name scrubbed]. |
| 57. |
U.S. Congress, House Committee on Appropriations, Subcommittee on Energy and Water Development, and Related Agencies, Energy and Water Development Appropriations Bill, 2019, Report to accompany H.R. 5895, 115th Cong., 2nd sess., May 21, 2018, H.Rept. 115-697 (Washington: GPO, 2018), p. 93. |
| 58. |
U.S. Congress, Senate Committee on Appropriations, Subcommittee on Energy and Water Development, Energy and Water Development Appropriations Bill, 2019, report to accompany S. 2975, 115th Cong., 2nd sess., May 24, 2018, S.Rept. 115-258 (Washington: GPO, 2018), p. 84. |
| 59. |
|
| 60. |
The Findings section of both bills states that "since 1968, tax-exempt private activity bonds have been used to provide access to lower-cost financing for private businesses that are purchasing new capital equipment for certain specified environmental facilities, including facilities that reduce, recycle, or dispose of waste, pollutants, and hazardous substances." |
| 61. |
P.L. 114-94, the Fixing America's Surface Transportation Act (FAST Act). Currently under the FAST Act, "the term 'covered project' means any activity in the United States that requires authorization or environmental review by a Federal agency involving construction of infrastructure for renewable or conventional energy production, electricity transmission, surface transportation, aviation, ports and waterways, water resource projects, broadband, pipelines, manufacturing, or any other sector as determined by a majority vote of the Council." See 42 U.S.C. 4370m(6). |
| 62. | |
| 63. |
IPCC Special Report. |
| 64. |
U.S. Environmental Protection Agency, Inventory of U.S. Greenhouse Gas Emissions and Sinks 1990-2016, EPA 430-R-18-003, April 12, 2018, pp. ES-6, https://www.epa.gov/ghgemissions/inventory-us-greenhouse-gas-emissions-and-sinks. |