Social Security: What Would Happen If the Trust Funds Ran Out?
Changes from June 11, 2018 to June 12, 2019
This page shows textual changes in the document between the two versions indicated in the dates above. Textual matter removed in the later version is indicated with red strikethrough and textual matter added in the later version is indicated with blue.
Social Security: What Would Happen If the Trust Funds Ran Out?
Contents
- Introduction
- Background on Social Security
- The Social Security Trust Funds
- How the Trust Funds Work
- Trust Fund Receipts
- Trust Fund Expenditures
- Annual Surpluses and Deficits
- Cash-Flow Surpluses and Deficits
- Trust Fund Balances
- Trust Fund Solvency
- Historical Trust Fund Operations
- Surpluses and Deficits
- Near-Insolvency of the OASI Trust Fund in the Early 1980s
- Recent Near-Insolvency of the DI Trust Fund
- Social Security Financial Projections
- Trust Fund Ratio
- Legal Background on Trust Fund Insolvency
- The Antideficiency Act
- Legal Entitlement to Social Security Benefits
- What Happens to Benefits in the Case of Insolvency?
- What If Congress Waits to Act?
- Benefit Cut Scenario
- Size of Benefit Cuts
- Payroll Tax Increase Scenario
- Size of Payroll Tax Rate Increases
- Impact of Payroll Tax Increases
- Conclusion
Figures
- Figure 1. Annual Net Change in
- Figure 2. Actual and Projected Trust Fund Ratios, by Trust Fund, 2000-2040
- Figure 3. Benefits as a Share of Scheduled Benefits, 2018-2092
- Figure 4. Replacement Rates for Retired Workers Who Claim at Their Full Retirement Age Under the Benefit Cut Scenario, 2018-2092
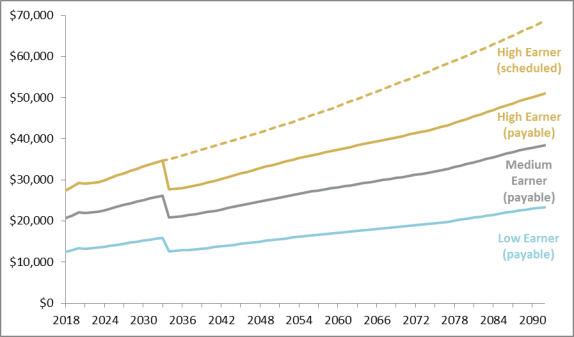
- Figure 5. Initial Real Annual Payable Benefits for Retired Workers Claiming at Their Full Retirement Age Under the Benefit Cut Scenario, 2018-2092
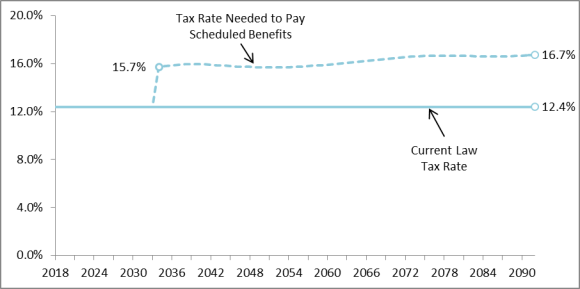
- Figure 6. Combined Social Security Payroll Tax Rate Under Current Law and Under the Tax Rate Increase Scenario, 2018-2092
Tables
Summary
Social Security's receipts and expenditures are accounted for through two federal trust funds: the Federal Old-Age and Survivors Insurance (OASI) Trust Fund and the Federal Disability Insurance (DI) Trust Fund. Under their intermediate assumptions and under current law, the Social Security trustees project that the DI trust fund will become depleted in 20322052 and the OASI trust fund will become depleted in 2034. Although the two funds are legally separate, they are often considered in combination. The trustees project that the combined Social Security trust funds will become depleted in 20342035. At that point, the combined trust funds would become insolvent, because incoming tax revenue would be sufficient to pay only about 7980% of scheduled benefits.
If a trust fund became depleted and current receipts were insufficient to cover current expenditures, there would be a conflict between two federal laws. Under the Social Security Act, beneficiaries would still be legally entitled to their full scheduled benefits. However, the Antideficiency Act prohibits government spending in excess of available funds, so the Social Security Administration (SSA) would not have legal authority to pay full Social Security benefits on time.
It is unclear what specific actions SSA would take if a trust fund were insolvent. After depletion, the trust funds would continue to receive tax revenues, from which a majority of scheduled benefits could be paid. One option would be to pay full benefits on a delayed schedule; another would be to make timely but reduced payments. Social Security beneficiaries would remain legally entitled to full, timely benefits and could take legal action to claim the balance of their benefits.
Maintaining financial balance after trust fund insolvency would require substantial reductions in Social Security benefits, substantial increases in tax revenues, or some combination of the two. The trustees project that following depletion of the combined funds in 20342035, Congress could restore balance by reducing scheduled benefits by about 2120%; the required reduction would grow gradually to 2625% by 2092. Alternatively, Congress could2093. An alternative could be for Congress to raise the Social Security payroll tax rate from 12.4% to 15.760% following depletion in 20342035, then gradually increase it to 16.750% by 20922093.
Trust-fund insolvency could be avoided if expenditures were reduced or receipts increased sufficiently. The sooner Congress acts to adjust Social Security policy, the less abrupt the changes would need to be, because they could be spread over a longer period and would therefore affect a larger number of workers and beneficiaries. Even if changes were not implemented immediately, enacting them sooner would give workers and beneficiaries more time to plan and adjust their work and savings behavior.
Introduction
Each year when the Social Security trustees release their annual report, attention is focused on the projection of the year that the Social Security trust funds will become depleted, that is, the year in which the trust funds' investment holdings in U.S. Treasury securities fall to zero.1 In their 20182019 report, the trustees project that, under their intermediate assumptions and under current law, the Federal Disability Insurance (DI) Trust Fund will become depleted in 20322052 and the Federal Old-Age and Survivors Insurance (OASI) Trust Fund will do so in 2034.2 Although the two funds are legally separate, they are often described in combination. The trustees project that the combined Old-Age, Survivors, Disability Insurance (OASDI) trust funds will become depleted in 20342035.
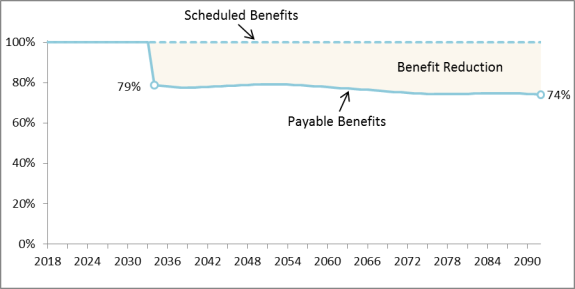
Some Americans may believe that if the trust funds were depleted, Social Security would be unable to pay benefits at all. In fact, in 20342035, the first year of projected depletion of the combined Social Security trust funds, the program is projected to have enough tax revenues to pay about 7980% of scheduled benefits; that percentage would decline to 7475% by the end of the 75-year projection period in 20922093.3 Thus, although the trust funds would be insolvent upon depletion, because they would be unable to cover 100% of expenditures with incoming tax revenues, they would not be "completely broke" and unable to pay any benefits.
Although benefits would be paid in some form, it is unclear how the necessary reductions would be implemented, because the Social Security Act does not specify what would happen to benefits if a trust fund became insolvent. One option would be to pay full benefits on a delayed schedule; another would be to make timely but reduced payments.
This report explains what the Social Security trust funds are and how they work. It describes the historical operations of the trust funds and the Social Security trustees' projections of future operations. It explains what could happen if Congress allowed the trust funds to run out. It also analyzes two scenarios that assume Congress waits until the moment of insolvency to act, showing the magnitude of benefit cuts or tax increases needed and how such changes would affect beneficiaries.
Background on Social Security
Old-Age, Survivors, and Disability Insurance, commonly known as Social Security, is a work-related social insurance program authorized under Title II of the Social Security Act that provides monthly cash benefits to retired or disabled workers and their eligible dependents and to eligible survivors of deceased insured workers.4 Workers obtain insurance protection by working for a sufficient number of years in jobs covered by Social Security. A worker's job is considered covered if the earnings derived from that job are subject to Social Security taxes and thus are creditable for program purposes. In 20182019, an estimated 174177 million people (or about 9493% of all workers) will work in paid employment or self-employment covered by Social Security.5
Social Security benefits are based on a worker's career-average earnings in jobs covered by Social Security and designed to replace a portion of the income lost to a family due to the worker's retirement, disability, or death. In May 2018April 2019, the Social Security Administration (SSA) authorized benefit payments for 62.563.4 million beneficiaries, including 43.044.2 million retired workers, 8.65 million disabled workers, 4.87 million dependents of retired or disabled workers, and 6.0 million survivors of deceased insured workers.6 The average benefit payment issued that month was $1,412468 for retired workers, $1,198235 for disabled workers, $596624 for dependents of retired or disabled workers, and $1,153193 for survivors for deceased insured workers.7
The Social Security Trust Funds
How the Trust Funds Work8
Social Security's receipts and expenditures are accounted for through two legally distinct federal trust funds: the OASI trust fund and the DI trust fund. In the federal accounting structure, a trust fund is an accounting mechanism used by the Department of the Treasury to track and report receipts dedicated for spending on specific purposes, as well as expenditures made to its beneficiaries that are financed by those receipts, in accordance with the terms of a statute that designates the fund as a trust fund.9 The OASI trust fund records receipts and expenditures associated with retired workers, their dependents, and survivors of deceased insured workers, while the DI trust fund records receipts and expenditures associated with disabled workers and their dependents. The OASI and DI trust funds operate separately but are closely linked.10 Several times in the past, Congress has authorized the reallocation of the Social Security payroll tax rate to equalize the financial conditions of the two trust funds. In part because of those experiences, analysts often treat the two funds collectively on a hypothetical basis as the combined OASDI trust funds.
The Social Security trust funds, like most federal trust funds, have different attributes than trust funds in the private sector. The Government Accountability Office (GAO) notes the following:
In the federal budget the meaning of the term "trust" differs significantly from its private sector usage. In the private sector, a person creates a private trust fund using his or her own assets to benefit a stated individual(s). The creator of the trust names a trustee who has a fiduciary responsibility to manage the designated assets in accordance with the stipulations of the trust. In the federal sector, the Congress creates a federal trust fund in law and designates a funding source to benefit stated groups or individuals. However, in contrast to a private trust fund, the federal government does not have a fiduciary responsibility to the trust beneficiaries, and it can raise or lower future trust fund collections and payments or change the purposes for which the collections are used by changing existing laws. Moreover, the federal government has custody and control of the funds as well as the earnings of most federal trust funds.11
Trust Fund Receipts
The trust funds' primary source of revenue is the Social Security payroll tax, but they also receive income from federal income taxes on benefits and from interest on the funds' investment holdings. The payroll tax consists of a 12.40% total tax on wages and self-employment income up to the taxable maximum, which in 2018 is $128,4002019 is $132,900 and generally increases annually with average earnings growth in the economy.12 Of the 12.40% total, 10.03% is credited to the OASI trust fund and 2.37% to the DI trust fund.13 Some Social Security benefits paid to people with incomes above a certain threshold are subject to federal income tax.14 Most of the resulting revenue is credited to the Social Security trust funds, and some goes to Medicare's Hospital Insurance (HI) trust fund.15 In 20172018, the combined trust funds' total receipts were $996.61,003.4 billion, with 87.788.2% from payroll taxes, 8.53% from interest income, and 3.85% from income taxes on benefits (see Appendix A).16
Trust Fund Expenditures
In 20172018, the combined trust funds' total expenditures were $952.51,000.2 billion, with 98.8% for benefit payments and 0.7% for administrative expenses (see Appendix A). The remaining 0.5% was transferred to the Railroad Retirement Board (RRB) as part of a financial interchange with the RRB. This annual exchange of funds places the Social Security trust funds in the same financial position in which they would have been if railroad service had been covered by Social Security.
Annual Surpluses and Deficits
In years when Social Security's total receipts, including interest, exceed expenditures, then the trust funds have an annual surplus. By law, that surplus is invested in special-issue U.S. Treasury securities (i.e., nonmarketable government bonds), which are backed by the full faith and credit of the federal government. In other words, Social Security's cash surpluses are borrowed by the General Fund of the U.S. Treasury. The Treasury, in turn, incurs an obligation to repay the bonds with interest. These bonds are assets to the Social Security program but liabilities to the rest of the government. In 20172018, the combined trust funds generated an annual surplus of $443.1 billion ($996.61,003.4 billion in total receipts minus $952.51,000.2 billion in total expenditures; see Appendix A).
When the trust funds spend more than they receive in taxes and interest, they have an annual deficit, which requires Social Security to redeem bonds accumulated in previous years. The Department of the Treasury pays benefits with cash from general revenues and writes down an equivalent amount of the trust fund's bond holdings.17 In their latest report, the Social Security trustees project that total expenditures for the combined trust funds will exceed total receipts in 20182020, resulting in an annual deficit for the first time since 1982.18
Cash-Flow Surpluses and Deficits
An alternative measure of the trust funds' finances is given by the cash-flow balance. That measure does not consider interest income, so the trust funds run a cash-flow surplus when tax revenues exceed expenditures, and they run a cash-flow deficit when they spend more than they receive in taxes.
Total receipts for the combined trust funds in 20172018 were $996.61,003.4 billion, with $911.5920.1 billion in non-interestnoninterest income (i.e., payroll taxes and income taxes on benefits) and $85.183.3 billion in interest income (see Appendix A). Because total expenditures for the combined trust funds in 20172018 were $952.51,000.2 billion, there was a combined cash-flow deficit in 20172018 of $41.080.1 billion ($952.51,000.2 billion in total expenditures minus $911.5920.1 billion in non-interestnoninterest income).
Trust Fund Balances
The balance of a trust fund is the accumulation of excess receipts over expenditures (i.e., the sum of annual surpluses less annual deficits). A positive balance denotes the total amount of the trust fund's investment holdings in U.S. government bonds (also known as asset reserves). Annual surpluses add to a trust fund's balance while annual deficits reduce it. The annual surplus of $443.1 billion in 20172018 increased the trust funds' combined balance from $2.85,891 billion at the end of 20162017 to $2.89,894 billion at the end of 20172018 (see Appendix A).
Trust Fund Solvency
If the trust funds are not able to pay all of current expenditures out of current tax revenues and accumulated trust fund assets, they are insolvent. Insolvency means that Social Security's trust funds are unable to pay benefits in full and on time. It does not mean that Social Security will be "completely broke" and unable to pay any benefits.
Historical Trust Fund Operations
The OASI trust fund was created by the Social Security Act Amendments of 1939 (P.L. 76-379) and superseded the Old-Age Reserve Account established by the original Social Security Act in 1935 (P.L. 74-271).19 The DI trust fund was established as part of the Social Security Amendments of 1956 (P.L. 84-880).20 Neither of the Social Security trust funds has ever become insolvent. The trust funds have existed on a hypothetical combined basis since the DI fund was first credited with receipts and debited for expenditures in 1957.
Surpluses and Deficits
The trust funds have run annual surpluses in most years. Except for the first decades of the program and a few years beginning in the late 1960s, these annual surpluses were typically small relative to the size of the trust funds' expenditures. Beginning in 1975, the combined trust funds ran annual deficits. The trust funds made up the difference between receipts and expenditures during these years by redeeming some of the bonds accumulated in earlier years. In other words, in those years, the Social Security trust funds received net transfers from the Treasury's General Fund.
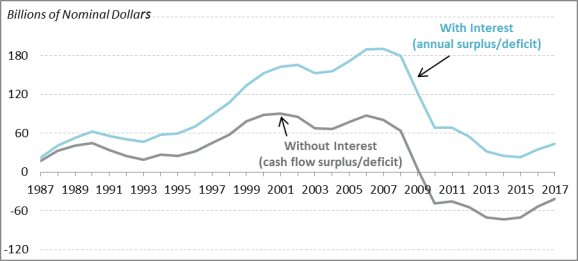
The aging of the baby-boom population and the recent recession and subsequent weak economy have resulted in higher expenditures and lower tax revenues for Social Security. Since 2010, the combined trust funds have run cash-flow deficits (Figure 1), which are projected to continue indefinitely under current law.
|
Figure 1. Annual Net Change in the Balance of the Combined Social Security Trust Funds, With and Without Interest Income, 1987- |
 |
|
Source: Congressional Research Service (CRS), based on data from the Social Security Administration (SSA), Office of the Chief Actuary (OCACT), "Social Security Trust Fund Data," https://www.ssa.gov/oact/STATS/table4a3.html. |
However, because interestinterest income has exceeded the cash-flow deficit, the combined trust funds have continued to run annual surpluses, which averaged about 5% of total expenditures from 2010 through 20172018.21 Cash-flow deficits do not affect Social Security directly. However, if the non-Social Security portion of the federal budget is in deficit, redemption of trust fund bonds puts additional pressure on the overall federal budget.
Near-Insolvency of the OASI Trust Fund in the Early 1980s
In the early 1980s, a solvency crisis loomed for the OASI trust fund. The 1982 Social Security Trustees Report projected that in the absence of legislative changes, the OASI trust fund would become insolvent by July 1983.22 To relieve the pressure on the OASI trust fund temporarily, Congress permitted the fund to borrow from the DI and HI trust funds through the end of 1982.23 On November 5, 1982, the Department of the Treasury announced that the balance of the OASI trust fund had fallen to zero, and that the U.S. Treasury would be unable to redeem the amount of bonds necessary to cover the OASI benefit checks that had been delivered on November 3.24 To cover the shortfall, the Secretary of the Treasury authorized a $581 million loan from the DI trust fund to the OASI trust fund. Additional loans from the DI and HI trust funds to the OASI trust fund were made before the temporary interfund borrowing authority expired.
This measure gave policymakers time to develop a more sustainable solution to Social Security's solvency problem. The Social Security Amendments of 1983 (P.L. 98-21) increased Social Security income and reduced spending. As a result, the combined trust funds ran significant surpluses, which on average exceeded a quarter of expenditures from 1987 to 2009. The 1982 loans from the DI and HI trust funds to the OASI trust fund were repaid, with interest, by the end of April 1986.25
Recent Near-Insolvency of the DI Trust Fund26
In their annual reports for 2012 through 2015, the trustees projected that the DI trust fund would be depleted in late 2016 (see Appendix B). At the end of 2015, the balance of the DI trust fund was $32.3 billion, down from $60.2 billion at the start of the year.27 The declining solvency of the DI trust fund was the result of an imbalance between the fund's receipts and expenditures. Between 1995 and 2015, tax revenues to the DI trust fund were relatively flat as a percentage of taxable payroll, whereas expenditures as a share of taxable payroll grew markedly.28 The increase in expenditures stemmed largely from the growth in the number of beneficiaries in the program. During that period, the number of disabled-worker beneficiaries increased by 113%, from nearly 4.2 million to more than 8.9 million.29
On November 2, 2015, President Barack Obama signed into law the Bipartisan Budget Act of 2015 (BBA 2015; P.L. 114-74). Among other provisions, the BBA 2015 authorized a temporary reallocation of the payroll tax rate between the OASI and DI trust funds to provide DI with a larger share for 2016 through 2018. Specifically, the DI trust fund's share of the combined tax rate increased by 0.57 percentage points at the beginning of 2016, from 1.80% to 2.37%. Because the BBA 2015 did not change the combined payroll tax rate of 12.40%, the portion of the tax rate allocated to OASI decreased by a corresponding amount. This means that OASI's share of the combined tax rate declined by 0.57 percentage points at the start of 2016, from 10.60% to 10.03%. For 2019 and later, the shares allocated to the DI and OASI trust funds are scheduled to return to their 2015 levels: 1.80% to the DI trust fund and 10.60% to the OASI trust fund.
Social Security Financial Projections
This report focuses on the trustees' "intermediate" Social Security projections, which reflect their "best estimates" of future demographic and economic trends.30 Under that set of assumptions, the DI Trust Fund is depleted in 20322052 and the OASI Trust Fund is depleted in 2034.31 Considered on a hypothetical combined basis, the trust funds would become insolvent in 20342035. However, the trustees' projections—like all long-term projections—are uncertain. They estimate that there is a 10% chance that the combined trust funds would become insolvent in 2032 or earlier and a 10% chance that insolvency would occur in 20392040 or later.32 Using somewhat different assumptions and projection methods, the Congressional Budget Office (CBO) projects that the combined trust funds will become insolvent in 20302031.33
Even after insolvency, the trust funds will continue to receive income from payroll taxes and income taxes on benefits that will allow some benefits to be paid. The trustees project that, under their intermediate assumptions, tax income would be sufficient to cover about 7980% of scheduled benefits following insolvency of the combined trust funds in 20342035, declining to 7475% in 20922093.34
Trust Fund Ratio
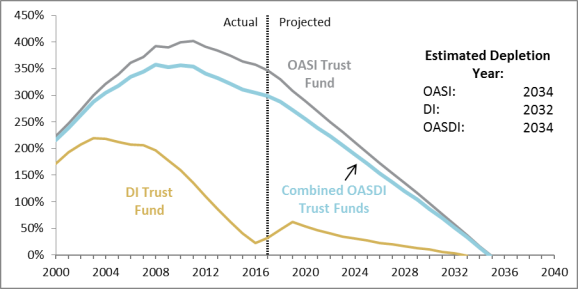
To put the trust fund balance in context, analysts commonly consider the trust fund ratio: the balance in the trust funds at the beginning of a year divided by projected expenditures for that year. The trust fund ratio thus represents the proportion of a year's cost that could be paid solely with the reserves at the beginning of the year. The ratio for the combined trust funds peaked at 358% in 2008 (Figure 2). The combined trust fund ratio declined to 299289% in 20172018 and is continuing to fall. By definition, the ratio will reach zero when the trust funds become depleted.
|
Figure 2. Actual and Projected Trust Fund Ratios, by Trust Fund, 2000-2040 (trust fund assets at the beginning of the year as a share of annual expenditures) |
 |
|
Source: CRS, based on The Board of Trustees, Federal Old-Age and Survivors Insurance and Federal Disability Insurance Trust Funds, The Notes: OASI = Old-Age and Survivors Insurance. DI = Disability Insurance. OASDI = Old-Age, Survivors, and Disability Insurance. Projections are based on the trustees' |
Legal Background on Trust Fund Insolvency
The Antideficiency Act
The Social Security Act specifies that benefit payments shall be made only from the trust funds (i.e., only from their accumulated bond holdings).35 Another law, the Antideficiency Act, prohibits government spending in excess of available funds.36 Consequently, if the Social Security trust funds become insolvent—that is, if current tax receipts and accumulated assets are not sufficient to pay the benefits to which people are entitled—the law effectively prohibits full Social Security benefits from being paid on time.
Legal Entitlement to Social Security Benefits
The Social Security Act states that every individual who meets program eligibility requirements is entitled to benefits.37 Social Security is an entitlement program, which means that the federal government is legally obligated to pay Social Security benefits to all those who are eligible for them as set forth in the statute.38 If the federal government fails to pay the benefits stipulated by law, beneficiaries could take legal action. Insolvency would not relieve the government of its obligation to provide benefits.
What Happens to Benefits in the Case of Insolvency?
The Antideficiency Act prohibits government agencies from paying for benefits, goods, or services beyond the limit authorized in law for such payments. The authorized limit in law for Social Security benefits is the balance of the trust fund. The Social Security Act does not stipulate what would happen to benefit payments if the trust funds ran out. As a result, either full benefit checks may be paid on a delayed schedule or reduced benefits would be paid on time.39 In either case, total payable benefits would be lower than scheduled benefits.
To see how a delay could affect beneficiaries, consider the current Social Security benefit payment schedule, shown in Table 1. (This schedule may be changed at the discretion of the Commissioner of Social Security.)40
|
Benefits Paid On |
Birth Date of Worker on Whose Record Benefits Are Paid |
|
Third of every month |
Any birth date for: (1) Social Security beneficiaries who also receive Supplemental Security Income benefits or who reside in a foreign country, and (2) Most beneficiaries who began to receive benefits prior to June 1997. |
|
Second Wednesday |
1st to 10th day of the month |
|
Third Wednesday |
11th to 20th day of the month |
|
Fourth Wednesday |
21st to 31st day of the month |
Source: Congressional Research Service (CRS), based on 20 C.F.R. §404.1807 and Social Security Administration (SSA), Office of the Chief Actuary (OCACT), "Cyclical Payment of Social Security Benefits," http://ssa.gov/OACT/ProgData/cyclicalpay.html.
Note: For beneficiaries scheduled to receive payments on the third of the month, benefits may be paid earlier if the third is on a weekend or holiday.
New beneficiaries' payment dates are generally based on their day of birth—for example, if a retired worker was born on the first of the month (e.g., June 1), his or her benefit payment is made on the second Wednesday in the month.41
If trust fund insolvency caused delays in the payment schedule, benefit payments could be made in the usual order—first to those who receive benefits on the third of the month, then to those on the second Wednesday of the month, and so on, until the remainder of the trust funds' balance reached zero. At that point, no benefits could be paid until more tax receipts were credited to the trust funds. Then benefit payments could be picked up where they left off when the trust funds ran out. This cycle could continue indefinitely. The timing of these payments would be unpredictable.
What If Congress Waits to Act?
There are many options to restore Social Security solvency, which could be combined or targeted in a variety of ways. For example, Congress could decrease Social Security benefits. Benefit cuts could be applied proportionately to all beneficiaries or structured to protect certain people, such as disabled or low-income beneficiaries. Congress could also increase Social Security's income by raising payroll or other taxes or by transferring funds from the Treasury's general fund. Payroll tax increases could be applied proportionately to all workers or targeted to certain workers, such as those who earn more than the taxable maximum ($128,400 in 2018132,900 in 2019).
The next section presents two policy options that could be implemented after the trust funds' combined balance fell to zero to ensure a balanced system in later years:
- the benefit cut scenario, under which benefits would be cut across the board; and
- the tax increase scenario, under which the payroll tax rate would increase.
Both scenarios assume that current law would remain in place until the combined trust funds became insolvent. If changes were made sooner, they could be smaller, since the burden of lower benefits or higher taxes would be shared by more beneficiaries or workers over a longer period.42 Either scenario would essentially convert Social Security to a pure pay-as-you-go system, in which income and outgo are equal on an annual basis and there are no trust fund assets. These scenarios are only two of a wide range of possibilities. When Congress last addressed Social Security's solvency in 1983, lawmakers employed a combination of tax increases and benefit reductions to improve the financial condition of the combined trust funds.
Benefit Cut Scenario
Size of Benefit Cuts
If the trust funds were allowed to run out, Congress could eliminate annual cash-flow deficits by cutting benefits so that spending equals tax income on an annual basis. According to the trustees, achieving annual balance would require benefit cuts of 2120% in 20342035, the first year of insolvency, rising to 2625% by 20922093.43 To maintain balance after 20922093, the Social Security trustees project that larger benefit reductions would be needed, because people would continue to live longer and therefore collect benefits for longer periods.
Figure 3 shows the percentage of scheduled benefits that are payable each year with scheduled revenues. One way to understand how such a reduction would affect beneficiaries is to examine the effect on projected replacement rates and real benefit amounts for hypothetical workers.
Replacement Rates
One way of measuring the adequacy of Social Security benefits is the replacement rate, the ratio of an individual's program benefit to past covered earnings. Replacement rates can be calculated in different ways. This report uses the following methodology employed by SSA's actuaries.44
|
Replacement Rate = |
Initial Social Security Benefit |
|
Career-Average Indexed Earnings from Covered Work |
Social Security was established to replace income lost to a family as a result of the retirement, death, or disability of a worker. To ensure that average benefit levels grow along with average wages—thus keeping replacement rates generally steady—initial Social Security benefits are indexed to wage growth. Historically, wages have generally risen faster than prices, allowing the standard of living to rise from one generation to the next.
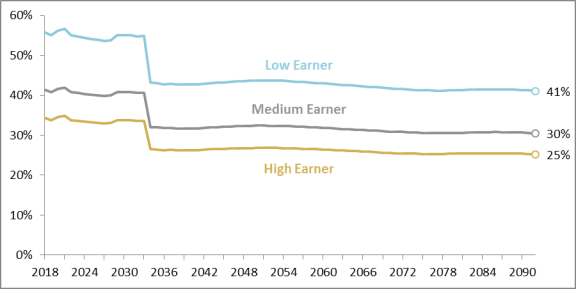
Figure 4 shows projected replacement rates under the benefit cut scenario for hypothetical low, medium, and high earners who claim retirement benefits at their full retirement age from 20182019 through 20922093.45
|
Figure 4. Replacement Rates for Retired Workers Who Claim at Their Full Retirement Age Under the Benefit Cut Scenario, (initial benefits as a share of career-average indexed earnings from covered work) |
 |
|
Source: CRS analysis of data from Notes: Projections are based on the trustees' |
The Social Security benefit formula is progressive, so the replacement rate is higher for people with lower lifetime earnings in covered employment or self-employment than for people with higher lifetime earnings. In 20182019, the estimated rates are 5655% for low earners, 4241% for medium earners, and 34% for high earners.46
Because lower earners have higher replacement rates, the 2120% reduction would result in a larger percentage point reduction in replacement rates for low earners than for high earners. The replacement rate for low earners would fall from 55% in 2033 to 43% in 20342034 to 44% in 2035, a decline of 1211 percentage points. In contrast, the replacement rate for high earners would fall from 34% in 2033 to 26% in 2034, an 82034 to 27% in 2035, a 7-percentage-point drop.47
Real Benefit Levels
Another measure of benefit adequacy is initial annual benefit amounts. Since benefits are based on workers' lifetime earnings, higher earners tend to receive higher benefit amounts than lower earners. In 20182019, a hypothetical low earner is estimated to receive an annual Social Security benefit of $12,53113,243, a medium earner a benefit of $20,66221,843, and a high earner a benefit of $27,37428,934.48 Figure 5 shows future initial real benefit amounts in 20182019 dollars (i.e., after adjusting for inflation), which illustrates how the purchasing power of benefits will change over time.
Because average real earnings generally grow over time, scheduled real benefits also grow. The trustees project that scheduled initial real benefit amounts for hypothetical individuals claiming retirement benefits at their full retirement age will increase by 2825% between 20182019 and 20342035.49 Under the benefit cut scenario, real payable benefit levels are projected to drop by 2120% after the trust funds become insolvent in 20342035, then to once again rise gradually.50 Under the trustees' projections, payable benefits in 2035 would be about the same as payable benefits in 20182019.51
Payroll Tax Increase Scenario
Upon trust fund depletion, the system could also be balanced by raising the payroll tax rate so that the tax income would be sufficient to pay scheduled benefits each year.
Size of Payroll Tax Rate Increases
The trustees project that paying scheduled benefits after depletion in 20342035 would require an increase in the combined employee and employer payroll tax rate of 3.32 percentage points, from the current 12.4% to 15.76%, after insolvency in 20342035.52 To sustain balance, the payroll tax rate would have to reach 16.75% by 20922093, the last year of the 75-year projection period.53 Figure 6 shows the combined payroll tax rate under current law and the combined payroll tax rate needed to pay scheduled benefits from 2018 to 20922019 to 2093.
Impact of Payroll Tax Increases
Raising the payroll tax rate would increase most workers' taxes by the same proportion. However, because covered earnings are taxable only up to a specified maximum ($128,400 in 2018132,900 in 2019), the effective increase in the payroll tax would be smaller in percentage terms for people who earn more than the taxable maximum than for other workers. Unlike the federal income tax, the Social Security payroll tax is levied at a flat rate starting at the first dollar of earnings.
Conclusion
Under current law, the Social Security trust funds will almost certainly become insolvent. The sooner changes are made to the program, the smaller and less abrupt the changes would need to be to maintain solvency. Prompt action would also allow Congress to gradually phase in changes, rather than abruptly cutting benefits or raising taxes, thus allowing workers to plan in advance for their retirements.
Appendix A.
20172018 Trust Fund Operations
|
Category |
OASI Trust Fund |
DI Trust Fund |
Combined OASDI Trust Funds |
|
Receipts |
|||
|
Payroll and Self-Employment Taxes |
$ |
$ |
$ |
|
Income from the Taxation of Benefits |
35,877 |
1,973 |
37,850 |
|
General Fund Reimbursements |
17 |
3 |
20 |
|
Non-Interest Income |
$ |
$169, |
$ |
|
Interest |
83,231 |
1,888 |
85,119 |
|
Total |
$ |
$ |
$ |
|
Expenditures |
|||
|
Benefit Payments |
798,692 |
142,806 |
941,499 |
|
Administrative Expenses |
3, |
2, |
6, |
|
Railroad Retirement Transfers |
4, |
207 |
4, |
|
Total |
$ |
$ |
$ |
|
Balance (Asset Reserves) |
|||
|
Balance at the Start of the Year |
2, |
46,338 |
2, |
|
Net Increase |
18,961 |
25, |
44,103 |
|
Balance at the End of the Year |
$2,797,872 |
$ |
$2,894,929 |
|
Cash Flow Surplus/Deficit (Net Increase in Balance Less Interest Income) |
-$ |
$ |
-$ |
Source: CRS, based on SSA, OCACT, "Financial Data for a Selected Time Period," https://www.ssa.gov/oact/ProgData/allOps.html.
Notes: OASI = Old-Age and Survivors Insurance. DI = Disability Insurance. OASDI = Old-Age, Survivors, and Disability Insurance.
The Combined OASDI Trust Fund values may not necessarily equal the sum of its rounded components.Appendix B. Key Dates Projected for the Social Security Trust Funds
Table B-1. Key Dates Projected for the Social Security Trust Funds as Shown Under the Intermediate Assumptions in Trustees Reports from 1983 to 2018
|
Year of Report |
Year of Projected Depletion |
Year That Total Cost First Exceeds Non-Interest Incomea |
Year That Total Cost First Exceeds Total Incomea |
|||||||||||||||
|
OASI |
DI |
OASDI |
OASI |
DI |
OASDI |
OASI |
DI |
OASDI |
||||||||||
|
Intermediate II-B Projectionsb |
||||||||||||||||||
|
1983 |
2021 |
2047 |
||||||||||||||||
|
1984 |
2050 |
2021 |
2012 |
2021 |
2045 |
2038 |
2044 |
|||||||||||
|
1985 |
2050 |
2034 |
2049 |
2019 |
2010 |
2019 |
2032 |
2020 |
2032 |
|||||||||
|
1986 |
2054 |
2026 |
2051 |
2020 |
2009 |
2019 |
2035 |
2017 |
2033 |
|||||||||
|
1987 |
2055 |
2023 |
2051 |
2020 |
2008 |
2019 |
2036 |
2013 |
2033 |
|||||||||
|
1988 |
2050 |
2027 |
2048 |
2019 |
2009 |
2019 |
2033 |
2016 |
2032 |
|||||||||
|
1989 |
2049 |
2025 |
2046 |
2019 |
2009 |
2018 |
2032 |
2014 |
2030 |
|||||||||
|
1990 |
2046 |
2020 |
2043 |
2019 |
2008 |
2017 |
2030 |
2011 |
2028 |
|||||||||
|
Intermediate Projections |
||||||||||||||||||
|
1991 |
2045 |
2015 |
2041 |
2018 |
1998 |
2017 |
2030 |
2011 |
2028 |
|||||||||
|
1992 |
2042 |
1997 |
2036 |
2018 |
1992 |
2016 |
2028 |
1992 |
2024 |
|||||||||
|
1993 |
2044 |
1995 |
2036 |
2019 |
1993 |
2017 |
2030 |
1993 |
2025 |
|||||||||
|
1994 |
2036 |
1995 |
2029 |
2016 |
1994 |
2013 |
2024 |
1994 |
2019 |
|||||||||
|
1995 |
2031 |
2016e |
2030 |
2014 |
2003e |
2013 |
2021 |
2007e |
2020 |
|||||||||
|
1996 |
2031 |
2015 |
2029 |
2014 |
2003 |
2012 |
2021 |
2007 |
2019 |
|||||||||
|
1997 |
2031 |
2015 |
2029 |
2014 |
2004 |
2012 |
2021 |
2007 |
2019 |
|||||||||
|
1998 |
2034 |
2019 |
2032 |
2015 |
2006 |
2013 |
2023 |
2009 |
2021 |
|||||||||
|
1999 |
2036 |
2020 |
2034 |
2015 |
2006 |
2014 |
2024 |
2009 |
2022 |
|||||||||
|
2000 |
2039 |
2023 |
2037 |
2016 |
2007 |
2015 |
2026 |
2012 |
2025 |
|||||||||
|
2001 |
2040 |
2026 |
2038 |
2016 |
2008 |
2016 |
2027 |
2015 |
2027 |
|||||||||
|
2002 |
2043 |
2028 |
2041 |
2018 |
2009 |
2017 |
2028 |
2018 |
2027 |
|||||||||
|
2003 |
2044 |
2028 |
2042 |
2018 |
2008 |
2018 |
2030 |
2018 |
2028 |
|||||||||
|
2004 |
2044 |
2029 |
2042 |
2018 |
2008 |
2018 |
2029 |
2017 |
2028 |
|||||||||
|
2005 |
2043 |
2027 |
2041 |
2018 |
2005 |
2017 |
2028 |
2014 |
2027 |
|||||||||
|
2006 |
2042 |
2025 |
2040 |
2018 |
2005 |
2017 |
2028 |
2013 |
2027 |
|||||||||
|
2007 |
2042 |
2026 |
2041 |
2018 |
2005 |
2017 |
2028 |
2013 |
2027 |
|||||||||
|
2008 |
2042 |
2025 |
2041 |
2018 |
2005 |
2017 |
2028 |
2012 |
2027 |
|||||||||
|
2009 |
2039 |
2020 |
2037 |
2017 |
2005 |
2016 |
2025 |
2009 |
2024 |
|||||||||
|
2010 |
2040 |
2018 |
2037 |
2018 |
2005 |
2015 |
2026 |
2009 |
2025 |
|||||||||
|
2011 |
2038 |
2018 |
2036 |
2017 |
2005 |
2010 |
2025 |
2009 |
2023 |
|||||||||
|
2012 |
2035 |
2016 |
2033 |
2010 |
2005 |
2010 |
2023 |
2009 |
2021 |
|||||||||
|
2013 |
2035 |
2016 |
2033 |
2010 |
2005 |
2010 |
2022 |
2009 |
2021 |
|||||||||
|
2014 |
2034 |
2016 |
2033 |
2010 |
2005 |
2010 |
2022 |
2009 |
2020 |
|||||||||
|
2015 |
2035 |
2016 |
2034 |
2010 |
2005 |
2010 |
2022 |
2009 |
2020 |
|||||||||
|
2016 |
2035 |
2023f |
2034 |
2010 |
2019f |
2010 |
2022 |
2019f |
2020 |
|||||||||
|
2017 |
2035 |
2028 |
2034 |
2010 |
2019 |
2010 |
2022 |
2019 |
2022 |
|||||||||
|
2018 |
2034 |
2032 |
2034 |
2010 |
2019 |
2010 |
2020 |
2019 |
2018
|
2019
|
2034
|
2052
|
2035
|
2010
|
2036
|
2010
|
2020
|
2041 2020 |
Source: CRS, based on data from 1983-20182019 Social Security Trustees Reports and information provided by SSA.
Notes: OASI = Old-Age and Survivors Insurance. DI = Disability Insurance. OASDI = Old-Age, Survivors, and Disability Insurance.
a. Dates indicate the first year a condition is projected to occur and to persist annually thereafter through the end of the 75-year projection period.
b. From 1983 to 1990, two intermediate forecasts were prepared (II-A and II-B). The intermediate II-B forecast corresponds more closely to the intermediate forecast in subsequent years.
c. Trust fund expected to remain solvent throughout the long-range projection period.
e. The Social Security Domestic Employment Reform Act of 1994 (P.L. 103-387) authorized a reallocation of the payroll tax rate between the OASI and DI trust funds to ultimately provide DI with more revenue.
f. The Bipartisan Budget Act of 2015 (P.L. 114-74) authorized a temporary reallocation of the payroll tax rate between the OASI and DI trust funds to provide DI with more revenue for 2016 through 2018.
Author Contact Information
Acknowledgments
Earlier versions of this report were written by former CRS analysts [author name scrubbed], [author name scrubbed]Kathleen Romig, Christine Scott, and Noah Meyerson. All questions from congressional clients should be directed to the current author.
Footnotes
| 1. |
The Social Security Board of Trustees presents an annual report to Congress on the current and projected financial status of the Social Security trust funds (see 42 U.S.C. §401[c]). The board is composed of six members: the Secretary of the Treasury, who is the Managing Trustee; the Secretary of Labor; the Secretary of Health and Human Services; the Commissioner of Social Security; and two public representatives, who are nominated by the President for a term of four years and subject to confirmation by the Senate. The trustees specify the assumptions about future demographic and economic trends used in the projections; however, the Social Security Administration's (SSA) Office of the Chief Actuary (OCACT) advises the trustees on the assumptions as well as develops and runs the computer models that produce the forecasts. |
| 2. |
The Board of Trustees, Federal Old-Age and Survivors Insurance and Federal Disability Insurance Trust Funds, The |
| 3. |
Ibid., Table IV.B4. |
| 4. |
42 U.S.C. §§401 et seq. |
| 5. |
SSA, OCACT, Fact Sheet on the Old-Age, Survivors, and Disability Insurance Program, |
| 6. |
SSA, OCACT, "Benefits Paid By Type Of Beneficiary," https://www.ssa.gov/oact/ProgData/icp.html. |
| 7. |
Ibid. |
| 8. |
CRS Report RL33028, Social Security: The Trust Funds. |
| 9. |
An account of the U.S. Treasury is designated as a trust fund by the Office of Management and Budget (OMB), in consultation with the Department of the Treasury, if the fund's authorizing legislation makes such a designation and if the fund's receipts are earmarked for spending on specific purposes or programs. Section 201 of the Social Security Act (42 U.S.C. §401) authorizes the Federal Old-Age and Survivors Insurance (OASI) Trust Fund and the Federal Disability Insurance (DI) Trust Fund and designates them as trust funds. |
| 10. |
Under current law, the OASI and DI trust funds may not borrow from one another. |
| 11. |
U.S. Government Accountability Office (GAO), Federal Trust and Other Earmarked Funds: Answers to Frequently Asked Questions, GAO-01-199SP, January 1, 2001, p. 7, https://www.gao.gov/products/GAO-01-199SP. |
| 12. |
42 U.S.C. §430 and 26 U.S.C. §§1401, 3101, and 3111. See SSA, OCACT, "Contribution and Benefit Base," https://www.ssa.gov/oact/cola/cbb.html. |
| 13. |
42 U.S.C. §401(a) and 401(b). Both the total tax rate and the allocation of it between the OASI and DI trust funds have changed many times; for historical rates, see SSA, OCACT, "Social Security Taxes Rates," https://www.ssa.gov/oact/progdata/oasdiRates.html. |
| 14. |
CRS Report RL32552, Social Security: Calculation and History of Taxing Benefits. |
| 15. |
CRS Report R43122, Medicare Financial Status: In Brief. |
| 16. |
SSA, OCACT, "Trust Fund Data," https://www.ssa.gov/oact/ProgData/funds.html. A very small amount of the combined trust funds total receipts (about 0.002%) were transfers from the General Fund of the U.S. Treasury, which occurred for several different reasons. |
| 17. |
See David Pattison, "Social Security Trust Fund Cash Flows and Reserves," Social Security Bulletin, vol. 75, no. 1 (February 2015), https://www.ssa.gov/policy/docs/ssb/v75n1/index.html. |
| 18. |
|
| 19. |
The OASI trust fund became effective on January 1, 1940. For more information on the origins of the OASI trust fund and the Old-Age Reserve Account, see Board of Trustees of the Federal Old-Age and Survivors Insurance Trust Fund, First Report of the Board of Trustees of the Federal Old-Age and Survivors Insurance Trust Fund, January 3, 1941, https://www.ssa.gov/oact/tr/historical/1941TR.html. |
| 20. |
The DI trust fund was established on August 1, 1956. For more information on the origins of the DI Trust Fund, see CRS Report R43318, The Social Security Disability Insurance (DI) Trust Fund: Background and Current Status. |
| 21. |
SSA, OCACT, "Social Security Trust Fund Data," https://www.ssa.gov/oact/ProgData/funds.html. |
| 22. |
U.S. Congress, House Committee on Ways and Means, The 1982 Annual Report of the Board of Trustees of the Federal Old-Age and Survivors Insurance and Federal Disability Insurance Trust Funds, 97th Cong., 2nd sess., April 1, 1982, H.Doc. 97-163 (Washington: GPO, 1982), p. 2, https://www.ssa.gov/oact/tr/historical/1982TR.pdf (hereinafter "1982 Social Security Trustees Report"). |
| 23. | |
| 24. |
Edward Cowan, "Leaders of Both Parties Facing Tough Choices on Social Security Problems," The New York Times, November 7, 1982, http://www.nytimes.com/1982/11/07/us/leaders-of-both-parties-facing-tough-choices-on-social-security-problems.html. See also see Bruce D. Schobel, "Interfund Borrowing Under the Social Security Act," Social Security Bulletin, vol. 46, no. 9 (September 1983), https://www.ssa.gov/policy/docs/ssb/v46n9/. |
| 25. |
SSA, "Research Note #4: Inter-Fund Borrowing Among the Trust Funds," http://www.ssa.gov/history/interfundnote.html. |
| 26. |
CRS Report R43318, The Social Security Disability Insurance (DI) Trust Fund: Background and Current Status. |
| 27. |
SSA, OCACT, "Time Series for Selected Financial Items," https://www.ssa.gov/oact/ProgData/tsOps.html. |
| 28. |
Taxable payroll is the total amount of earnings in the economy that is subject to Social Security payroll taxes (with some adjustments). |
| 29. |
SSA, OCACT, "Benefits Paid by Type of Beneficiary," https://www.ssa.gov/oact/ProgData/icp.html. |
| 30. |
To estimate the future financial status of the trust funds, the Social Security trustees produce short-range and long-range actuarial projections under three sets of economic and demographic assumptions: intermediate, low-cost, and high-cost. Intermediate assumptions represent the trustees' best estimate of the financial condition of the trust funds in the future. The low-cost and high-cost sets of assumptions, on the other hand, depict extraordinarily favorable (low-cost) or unfavorable (high-cost) possibilities for the trust funds' future solvency. According to the trustees, "actual future costs are unlikely to be as extreme as those portrayed by the low-cost and high-cost projections" ( |
| 31. |
|
| 32. |
Ibid., Table VI.E1. |
| 33. |
U.S. Congressional Budget Office (CBO), The 201 |
| 34. |
|
| 35. |
42 U.S.C. §401(h). |
| 36. |
31 U.S.C. §1341. |
| 37. |
42 U.S.C. §§402 and 423. |
| 38. |
See 2 U.S.C. §622 for the definition of entitlement authority. Congress retains the right to modify provisions of the Social Security Act at any time, which could affect the benefits current and future beneficiaries may receive (see 42 U.S.C. §1304). For more information, see nondistributable CRS Report RL32822, Social Security Reform: Legal Analysis of Social Security Benefit Entitlement Issues (available upon request |
| 39. |
The 1982 Trustees Report, which projected impending trust fund insolvency, stated that unless legislative changes were made, "inability to pay some benefits on time would result" (1982 Social Security Trustees Report, p. 2 [emphasis added]). That language suggests that after insolvency, full benefit payments would have been made on a delayed schedule. The |
| 40. |
20 C.F.R. §404.1807. For the payment schedule rationale, see SSA, "Cycling Payment of Social Security," 62 Federal Register 6114, February 11, 1997, https://www.gpo.gov/fdsys/pkg/FR-1997-02-11/pdf/97-3205.pdf. |
| 41. |
For beneficiaries who receive Social Security benefits based on another person's work record (e.g., spousal benefits), their payment date depends on the birth date of the worker on whose record they receive benefits. The current benefit payment schedule was first implemented for new beneficiaries in May 1997. |
| 42. |
The trustees estimate that 75-year solvency could be restored through (1) an immediate payroll tax increase of 2. |
| 43. |
|
| 44. |
Under the Social Security program, the replacement rate for retired workers is the ratio of the Social Security benefit to the average of the highest 35 years of covered earnings, indexed to wage growth using the SSA's Average Wage Index (AWI). Other ways to measure replacement rates are discussed in Andrew G. Biggs and Glenn R. Springstead, "Alternate Measures of Replacement Rates for Social Security Benefits and Retirement Income," Social Security Bulletin, vol. 68, no. 2, October 2008, http://www.ssa.gov/policy/docs/ssb/v68n2/v68n2p1.html, and in SSA, OCACT, Replacement Rates For Retirees: What Makes Sense For Planning And Evaluation?, Actuarial Note 155, July 2014, at http://www.ssa.gov/oact/NOTES/pdf_notes/note155.pdf. |
| 45. |
The low earner is assumed to have earned 45% of the national average wage (or $ |
| 46. |
OCACT Actuarial Note |
| 47. |
CRS analysis of data from OCACT Actuarial Note |
| 48. |
|
| 49. |
Ibid. |
| 50. |
Immediately before the trust funds become insolvent in |
| 51. |
CRS analysis of data from |
| 52. |
CRS analysis of data from |
| 53. |
Ibid. Under the tax rate increase scenario discussed in this report, the payroll tax rate would have to change each year, increasing in some years and decreasing in others. Alternatively, the payroll tax rate could be permanently increased by 3. |