Teen Births in the United States: Overview and Recent Trends
Changes from April 30, 2018 to May 13, 2020
This page shows textual changes in the document between the two versions indicated in the dates above. Textual matter removed in the later version is indicated with red strikethrough and textual matter added in the later version is indicated with blue.
Contents
- Introduction
- Teen Births in the United States
- Factors Likely Contributing to
Trends in Teen Birth Ratesthe Declining Risk of Teen Pregnancy
- Financial and Social Costs of Teen Births
Figures
Appendixes
Summary
The Centers for Disease Control and Prevention (CDC), the federal government's lead public health agency, has identified teen pregnancy as a major public health issue because of its high cost for families of teenage parents and society more broadly. The CDC highlights that the teen pregnancy rate has decreased steadily, dropping below CDC's target goal of 30.3 per 1,000 females aged 15 to 17 by 2015; however, the CDC also raises the concern that the United States has one of the highest rates of teen births of all industrialized countries.
This report discusses trends in teen birth rates—or the number of births per 1,000 females aged 15 to 19 each year—since the 1950s. The rate of teens births peaked in 1957 at 96.3. It then decreased in most years from the 1960s through the 1980s. From 1991 onward, the rate declined except in two years, 2006 and 2007. The greatest decline in teen birth rates has occurred in recent years. For example, from 2007 to 2018, the rate declined by approximately 58%. The 2018 teen birth rate of 17.4 was a historical low since CDC began collecting and reporting birth data in the 1940s.
In nearly each year from 1991 through the recent period, the teen birth rate decreased for all racial and ethnic groups; however, the rates declined more for certain groups than others. While the birth rates for two groups (non-Hispanic blacks and Hispanics) declined more than the rate for white teens, their birth rates remained higher overall. In 2018, Hispanic (26.7), non-Hispanic black (26.2), and non-Hispanic American Indian/Alaska Native (29.4) teens had more than double the teen birth rate for non-Hispanic white (12.2) and non-Hispanic Asian or Pacific Islander (4.0) teens.
Teen birth rates have varied considerably by state and territory. In 2018, the state with the lowest reported rate was Massachusetts (7.2); the state with the highest reported rate was Arkansas (30.4). Teen birth rates have declined in rural areas over time but remain relatively higher than rates in urban areas.
Research suggests that multiple trends have led to lower U.S. teen pregnancy and birth rates. From the 1990s through 2007, the risk of teen pregnancy decreased primarily because of improved contraceptive use, including an increase in the use of certain contraception methods (e.g., condoms), an increase in the use of multiple methods of contraception, and substantial declines in foregoing the use of contraception altogether. Some of the risk of pregnancy decreased among younger teens because of decreased sexual activity. A primary factor for more recent declines in the risk of teen pregnancy has been the increasing use of contraceptives among sexually active teens. Broad economic and social variables may influence teen behaviors, such as whether they will abstain from sex or use contraceptives.
Teen pregnancy has high costs for teen parents, their children, and society more generally. Teenage mothers and fathers tend to have less education and are more likely to live in poverty than their peers who are not parents. Moreover, lower levels of education reduce teen parents' potential for economic self-sufficiency. Some analysis has looked at these societal impacts and the benefits of avoiding pregnancy during the teen years.
This report accompanies CRS Report R45183, Teen Pregnancy: Federal Prevention Programs, which discusses Congress's current approach of supporting programs that seek to prevent pregnancy among teens; and CRS In Focus IF10877, Federal Teen Pregnancy Prevention Programs, which includes summary information about the programs.
Introduction
This report provides context for Congress about the U.S. teen birth rate—or the number of births per 1,000 females aged 15 to 19 each year—and its changes since the 1950s. Over this period, the teen birth rate has generally been in decline. This decline has been most significant in recent years, with the rate reaching a record low in 20162018. Multiple factors have likely contributed to the decrease, though the influence of any single factor is not fully known. Reduced teen sexual activity, particularly among younger adolescents, could be one explanation. Increases in use of contraceptives, including highly effective and multiple methods, among sexually active teens could be another. Other factors, such as broader social and economic trends, may also be at play.
Despite the decline in the teen birth rate, Congress continues to be interested in the issue of teen birth because of its high social and economic costs for both individual families and society more generally.1 The Centers for Disease Control and Prevention (CDC), the nation's lead public health agency, has identified teen pregnancy as a major public health issue.2 Further, disparities persist in teen birth rates among racial and ethnic subgroups and across states.
This report accompanies CRS Report R45183, Teen Pregnancy: Federal Prevention Programs, which discusses Congress's current approach of supporting programs that seek to prevent pregnancy among teens in the first place.
Teen Births in the United States
Data on births are distinct from data on pregnancies. The teen birth rate refers to the number of live births per 1,000 teen girls aged 15 through 19. The teen pregnancy rate includes the number of pregnancies per 1,000 teen girls aged 15 through 19, which encompasses live births, abortions, and fetal losses. Birth data account for nearly every birth in the United States, whereas pregnancy data are based on estimates of miscarriages and abortion numbers that draw on various reporting systems and surveys. The Centers for Disease Control and Prevention (CDC), the federal government's lead public health agency, reports birth data on an annual basis (most recently for 2018). The CDC and the Guttmacher Institute publish teen pregnancy rates. These rates are usually published a year or two after birth data because of the time required to incorporate data from the various data sources.2
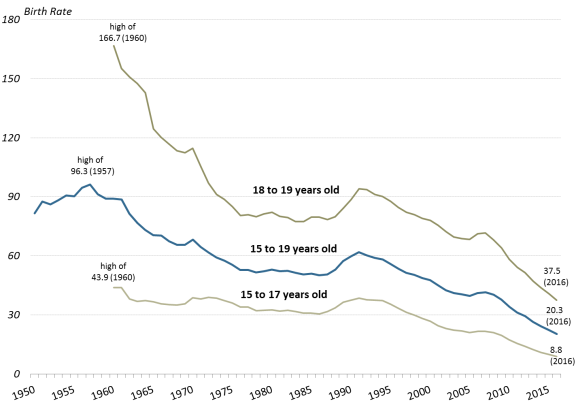
Birth rate is per 1,000 females aged 15 to 19, (15 to 17 and 18 to 19 subgroup data became available in 1960) Source: Congressional Research Service (CRS), based on data from the U.S. Department of Health and Human Services (HHS), Centers for Disease Control and Prevention (CDC), National Center for Health Statistics (NCHS), December 2016; and Joyce A. Martin et al., "Births: Final Data for 2018," HHS, CDC, National Center for Health Statistics (NCHS), National Vital Statistics Report, vol. 68, no. 13, November 27, 2019.The CDC tracks birth rates nationally, including by age and other characteristics of birth mothers. In 2016, there were nearly 4 million births in the United States.3 About 210,000 of these births (5.3%) were to teenagers aged 15 to 19.4 Figure 1 shows the birth rate for teens aged 15 to 19 from 1950 through 2016 (the rate excludes the territories). The rate ticked up in the "baby boom" era of the 1950s, peaking in 1957 at 96.3 per 1,000 females aged 15 to 19.
Teen Births in the United States
The rate ticked up in the baby boom era of the 1950s, peaking in 1957 at 96.3. It then decreased in most years from the 1960s through the 1980s.5 From 1991 onward, the teen birth rate declined except in two years, 2006 and 2007. The rate dropped by
6772% from 1991 (61.8 births per females aged 15 to 19) to 2016 (20.3 births to females aged 15 to 19) to 2018 (17.4). In other words, about 6% of teens aged 15 to 19 gave birth in 1991 compared to aboutless than 2% in 2016. 2018.
The greatest decline in pregnancy for teens ages 15 to 19the teen birth rate occurred in recent years. For example, from 2007 to 2016, the rate of teen pregnancy declined by slightly more than 50%. The 2016 teen birth rate of 20.3 births per 1,000 females ages 15 to 19 reached2018, the rate declined by about 58%. The 2018 teen birth rate of 17.4 was a historical low since CDC began collecting and reporting birth data in the 1940s.
The CDC began tracking subgroup data for teens in 1960, when the teen pregnancybirth rate was highest for both teens aged 15 to 17 (43.9 per 1,000) and teens aged 18 to 19 (166.7 per 1,000). Figure 1 indicates that the birth rate was higher in each year for the older teens compared to the younger teens. The 20162018 birth rates for 15- to 17-year-olds (8.87.2 per 1,000) and 18- to 19-year-olds (37.532.3 per 1,000) were the lowest on record.
Repeat teen births have also declined over time. A CDC analysisCDC found that the number of subsequent teen births among youth aged 15 to 19 declined nationally by nearly 54% from 2004 to 2015 (the most recent analysis available). The prevalence of teen births that were repeat births was highest among Hispanic youth, followed by non-Hispanic black and non-Hispanic white youth. Over this same period, the largest declines in the repeat birth rate for teens aged 15 to 19number of repeat births were among black teens (21.8%), followed by Hispanic (16.8%) and white (13.9%) teens.6 Teen mothers have also been less likely to be married than in previous years. In 2018, the birth rate for unmarried teens aged 15 to 19 was 16.0 per 1,000. This is compared to 31.0 per 1,000 in 2010.7 were among black teens (21.8%), followed by Hispanic (16.8%) and white (13.9%) teens.6
With the decline in births to teen mothers, this population has made up a smaller share of births to unmarried women. In 2015 (the most recent year data are available), teens made up about 13% of births to unmarried women. This is compared to 20% in 2010 and 50% in 1970.7
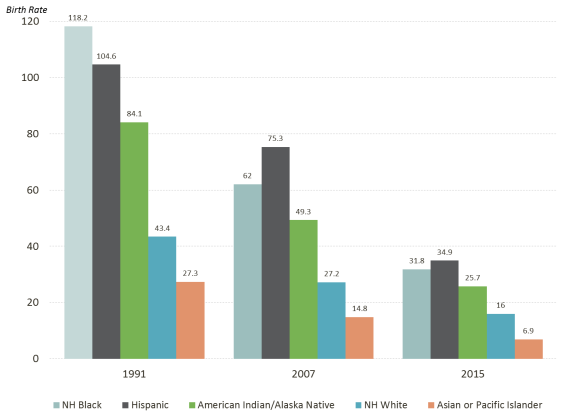
Despite the overall decline in the teen birth rate, the rates for certain racial and ethnic groups remain relatively high. Birth rates for teens aged 15 to 19 in 2015Teen birth rates in 2018 varied based on race and ethnicity, with three groups—Hispanic (34.9 per 1,000 Hispanic births to females aged 15 to 1926.7), non-Hispanic black (31.826.2), and non-Hispanic American Indian/Alaska Native teens (25.7)(29.4) teens—having more than double the teen birth rate for non-Hispanic white (16.012.2) and non-Hispanic Asian/ or Pacific Islander (6.94.0) teens.8
Figure 2 shows the teen birth rate for teens aged 15 to 19 by race and Hispanic origin over three key years: 1991, when the teen birth rate started a long-term decline; 2007, the most recent year when the teen birth rate had ticked back up slightly; and 20152018, the most recent year for which CDC compiled historical teen birth rate data by race and ethnicity. In nearly each year from 1991 through the recent period, the teen birth rate decreased for all racial and ethnic groups; however, the rates declined more for certain groups compared to others.9 From 2007 to 20152018, birth rates fell by 4155% for non-Hispanic white teens, 4840% for non-Hispanic American Indian/Alaska Native teens, 4958% for non-Hispanic black teens, 5373% for non-Hispanic Asian/Pacific Islander teens, and 5465% for Hispanic teens. While the birth rates for three groups (American Indian, Alaska Native, and black teenstwo groups (non-Hispanic black and Hispanic) had a greater decline than the rate for white teens, their birth rates remained higher.
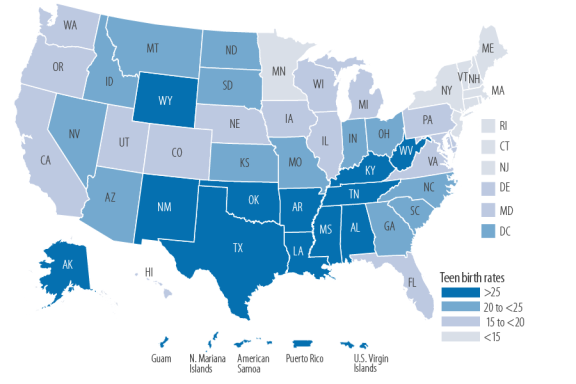
In 2016In 2018, the birth rate for teens aged 15 to 19 varied considerably by state and territory. The state with the lowest reported rate was Massachusetts (8.5 per 1,000 teens aged 15 to 19 in the state) and7.2); the state with the highest reported rate was Arkansas (34.6). 30.4).
Figure 3 shows a map with 20162018 teen births rates by quartilein four data categories for the 50 states, Washington, DC, and fivethe District of Columbia, and three of the territories. TheEighteen states withhad rates of less than 15 included Minnesota and eight northeastern states (Connecticut, Massachusetts, Maineper 1,000 teens aged 15 to 19: California, Colorado, Connecticut, Maine, Maryland, Massachusetts, Minnesota, New Hampshire, New Jersey, New York, Rhode Island, and Vermont). The states withOregon, Pennsylvania, Rhode Island, Utah, Vermont, Virginia, Washington, and Wisconsin. Ten states had the highest teen birth rates (25 or higher): were 10 states concentrated in the South and Southwest (Alabama, Arkansas, Kentucky, Louisiana, Mississippi, New Mexico, Oklahoma, Tennessee, Texas, and West Virginia), and Wyoming and Alaska. The rates for the territories ranged from 29.619.3 in Puerto Rico to 40.8 in American Samoa34.4 in Guam.10 From 2007 (when the birth rate last ticked up) to 20162018, the teen birth rate of teens decreased in each state or territory by between 2219% and 6067%.11
Teen birth rates have also declined in rural areas over time but remain relatively higher than rates in urban areas.12
While the U.S. teen birth rate has decreased over time, it has been higher than that of most other industrialized countries.13 For comparison, the U.S. teen birth rate of 24.2 in 2015 was about 1.5 times that18.8 was about 50% higher than the rate of the United Kingdom, 14.4 in 201512.6, in 2017 (based on the most recent international data available).14 The reasons for the high teen birth rate in the United States relative to other industrial countries have not been fully explored. Economic conditions and income inequality within and between countries may play a role.15 Further, the research literature, which is somewhat dated and limited, indicates that use of contraceptives among teens appears to be greater in other developed countries compared to the United States.16
Factors Likely Contributing to Trends in Teen Birth Rates
the Declining Risk of Teen Pregnancy
Researchers suggest that multiple trends have driven down U.S. teen pregnancy and teen birth rates. They point to certain factors as the reason for the decline in the birth ratedeclines over the 1990s through 2007. The research literatureResearch indicates that over this period, the risk of teen pregnancy decreased primarily because of improved contraceptive use, including an increase in the use of certain contraception methods (e.g., condoms), an increase in the use of multiple methods of contraception, and substantial declines in foregoing contraception.17 In addition, some of the risk of pregnancy decreased among younger teens, those ages 15 to 17, because of decreased sexual activity.18 A primary factor for more recent declines in the risk of teen pregnancy has also been the increasing use of contraceptives among sexually active teens. From 2007 through 2014, teens increased their contraceptive use, including the use of any method, the use of long-acting reversible contraceptives (LARCs; e.g., intrauterine devices, or IUDs, and birth control implants), and the use of the withdrawal method along with another method.19 the risk of teen pregnancy decreased because of the declining share of teens, particularly younger teens, ever having sexual intercourse.17 In addition, risk of pregnancy decreased because teens with sexual experience reported improved use of contraceptives. Teens were more likely to use condoms and long-acting hormonal methods and less likely to use withdrawal or no method of contraceptives.18 This change in behavior may have been driven by the national AIDS epidemic.19
Researchers are uncertain about the reasons for the decline in teen pregnancy in more recent years.20 The share of teens who engage in sex has decreased. A nationally representative survey of high school students found that the share of students in grades 9-12 ever having had sexual intercourse dropped from about 48% in 2007 to 41% in 2015.21 Another potential influence in decreasing rates of pregnancy is the increasing use of contraceptives among sexually active teens since 2007. Contraceptive use generally did not increase at the same pace as it did in the earlier period; however, teens have been more likely to use highly effective (i.e., birth control pill; patch; and long-acting reversible contraceptives (LARCs), including intrauterine devices (IUDs), injections, and contraceptive implants) and multiple methods of contraception.22 The abortion rate, which has declined over time, does not appear to be a major factor in contributing to decreasing teen birth rates.23
Broad economic and social variables may influence teen behaviors, such as whether they will abstain from sex or use contraceptives if they have sex. For example, some.20 Behavioral changes may have been driven by a confluence of factors, such as expanded educational and labor market opportunities for women and improvements in contraceptive technology.21 Some observers theorize that the long-term downward trend in teen birth rates is attributable to the recession that began in late 2007. They contend that during economic downturns the decrease in teen births—like the decrease in overall births—is partly due to teenagers being more careful as they witness the economic difficulties faced by their families.2422 Despite this rationale, the teen birth rate continued to diminish after the recession (as well as during periods of economic expansion in the 1990s). Another possible explanation for the decline is the role of social media and increased use of the internet in teens' knowledge about sex and birth control. One analysis found that there were more rapid declines in rates of teen childbearing in places where the MTV show 16 and Pregnant was more widely viewed.2523 The study extrapolated that teens changed their behavior (e.g., increasing the use of contraceptives) after viewing the show. Still, teen birth rates declined even after ratings for the show peaked.
TeenSome observers contend that teen pregnancy prevention programs, such as those supported with federal funding, could potentially play a role in the declining birth rate for teenagers.2624 However, the extent to which these programs have caused a decline in the teen birth rate is not fully known. Fewer than half of all states require schools to teach sexual education, and it does not appear that rates of teen pregnancy have dropped more quickly or slowly in states that take a specific approach to sexual education.27 A growing body of evidence shows that selected education models can influence adolescents' decisions about having sex and using contraceptives. Some federal programs require or encourage grant recipients to use models that have met standards for effectiveness.28 Nonetheless, organizations that provide evidence-based or promising teen pregnancy prevention education reach a small share of youth. For example, the grantees funded under the four federal teen pregnancy programs served about 620,000 youth in a one-year period, which accounts for approximately 3% of the population aged 15 to 19.2925
Financial and Social Costs of Teen Births
Teen pregnancy has high costs for the families of teen parents and society more generally.3026 Teenage mothers and fathers tend to have less education and are more likely to live in poverty than their peers who are not teen parents. For example,
- nearly one-third of teen girls who have dropped out of high school cite pregnancy or parenthood as a reason,
- about 7 out of 10 teen mothers who have moved out of their family's household live below the poverty level, and
- more than 60% of teen mothers receive some type of public benefits within the first year after their children are born.
31
Moreover, lower27 Lower levels of education reduce teen parents' potential for economic self-sufficiency. At the same time, being impoverished and having less education can also increase the likelihood of teens becoming pregnant in the first place.3228 These poorer outcomes may be explained in part by underlying differences between those who give birth as teens and those who delay childbearing: teen mothers often come from more disadvantaged backgrounds (e.g., family more likely to receive public welfare benefits, parents have lower levels of education) than their counterparts who have children at a later age.3329 In addition, teen sexual activity even among those who do not become pregnant can increase the risk of sexually transmitted infections (STIs), which can led to long-term health issues. Adolescents aged 15 to 19 have certain STIs at a rate that is among the highest of sexually active individuals.34
Further, teen childbearing can also affect the offspring of teen parents. Children of teenage mothers have poorer outcomes than children of mothers who give birth in their early 20s or later. They are generally more likely to (1) have chronic medical conditions, (2) use public health care, (3) have lower school readiness scores, (4) do poorly in school, (45) give birth during their teen years (females), and (56) be incarcerated (males).3531 In addition to the consequences for teens and their families, teen childbearing has societal impacts. An analysis by the Power to Decide (formerly the National Campaign to Prevent Teen and Unplanned Pregnancy), a nonpartisan organization that provides information and research on teen pregnancy, found that teen pregnancy cost U.S. taxpayers about $9.4 billion in 2010. The $9.4 billion includes $3.1 billion in child welfare benefits, $2.1 billion in public sector health care expenses, $2.0 billion in spending on incarceration (for sons of teenage mothers), and $2.2 billion in lost tax revenue because of lower earnings of children of teen mothers over their own adult lifetimes.36
Appendix. Additional Data on Teen Pregnancy
Table A-1. Birth Rates for Teens Aged 15 to19, 1950-2016
Birth rate is per 1,000 females aged 15 to 19
|
Year |
Birth Rate |
Year |
Birth Rate |
Year |
Birth Rate |
Year |
Birth Rate |
|
1950 |
81.6 |
1967 |
|
1984 |
|
2001 |
45.0 |
|
1951 |
87.6 | 51.3
1968 |
65.6 |
1985 |
51.0 |
2002 |
42.6 |
|
1952 |
86.1 |
1969 |
65.5 |
1986 |
50.2 | 48.8
2003 |
41.1 |
|
1953 |
88.2 |
1970 |
68.3 | 47.7
1987 |
50.6 |
2004 |
|
|
1954 |
90.6 | 45.0
1971 |
64.5 |
1988 |
53.0 |
2005 |
39.7 |
|
1955 |
|
1972 |
61.7 |
1989 |
57.3 | 41.1
2006 |
41.1 |
|
1956 |
94.6 |
1973 |
59.3 | 40.5
1990 |
59.9 |
2007 |
41.5 |
|
1957 |
96.3 | 39.7
1974 |
57.5 |
1991 |
61.8 |
2008 |
40.2 |
|
1958 |
91.4 |
1975 |
|
1992 |
60.3 | 41.5
2009 |
37.9 |
|
1959 |
89.1 |
1976 |
52.8 | 40.2
1993 |
59.0 |
2010 |
|
|
1960 |
89.1 | 37.9
1977 |
52.8 |
1994 |
58.2 |
2011 |
31.3 |
|
1961 |
88.6 |
1978 |
51.5 |
1995 |
56.0 | 31.3
2012 |
29.4 |
|
1962 |
81.4 |
1979 |
52.3 | 29.4
1996 |
|
2013 |
26.5 |
|
1963 |
76.7 | 26.5
1980 |
53.0 |
1997 |
51.3 |
2014 |
24.2 |
|
1964 |
73.1 |
1981 |
52.2 |
1998 |
|
2015 |
|
|
1965 |
70.5 |
1982 |
52.4 | 20.3
1999 |
48.8 |
2016 |
20.3 |
|
1966 |
70.3 | 18.8
1983 |
51.4 |
2000 |
47.7 |
2017 |
Not yet available |
Source: Table prepared by the Congressional Research Service (CRS) based on data from the Department of Health and Human Services (HHS), Centers for Disease Control and Prevention (CDC), National Center for Health Statistics (NCHS).
Author Contact Information
Acknowledgments
Isaac Nicchitta, Research Assistant in CRS's Domestic Social Policy Division, provided invaluable support and editorial comments on this report.
Footnotes
| 1. |
Urban Institute, Kids Having Kids: Costs and Social Consequences of Teen Pregnancy, edited by Saul D. Hoffman and Rebecca A. Maynard, 2nd ed., 2008. (Hereinafter, Urban Institute, Kids Having Kids: Costs and Social Consequences of Teen Pregnancy.) | |||||
| 2. | See also, U.S. Department of Health and Human Services (HHS), |
|||||
3.
|
Table A-1 includes birth rates for teens since 1950. Joyce A. Martin, et al., "Births: Final Data for 2018," HHS, CDC, NCHS, National Vital Statistics Report, vol. 68, no. 13, November 27, 2019 (Hereinafter, Joyce A. Martin, et al., "Births: Final Data for 2018.")
|
|||||
| 4. |
The CDC also tracks births for youth aged 10 to 14; however, their birth rate has been much lower than the rate of births for older teens, and is therefore not included in this analysis. The birth rate was 0.2 births per 1,000 youth aged 10 to 14 in |
|||||
| 5. |
The baby boom era refers to individuals born in the U.S. between mid-1946 and mid-1964; Sandra L. Colby and Jennifer M. Ortman, "The Baby Boom Cohort in the United States: 2012 to 2016, Population Estimates and Projections," Current Population Reports, CDC, May 2014. |
|||||
| 6. |
Deborah |
|||||
| 7. |
| |||||
| 8. |
Brady E. Hamilton and T.J. Mathews, "Continued Decline in Teen Births in the United States, 2015," HHS, CDC, NCHS, NCHS Data Brief, no. 259, September 2016. This analysis is from 1991 through 2015. See "Data Table for Figure 2: Birth Rates for Females Aged 15-19, by Race and Hispanic Origin: United States, 1991-2015." |
|||||
| 9. |
Ibid. |
|||||
| 10. | Joyce A. Martin, et al., "Births: Final Data for 2016." 8.
|
|
This is based on Congressional Research Service correspondence with HHS, CDC, January 2020. 9.
|
|
Ibid. 10.
|
Joyce A. Martin et al., "Births: Final Data for 2018." Data are not reported for American Samoa (2017 teen birth rate of 38.4), or for the U.S. Virgin Islands (2016 teen birth rate of 25.4). Joyce A. Martin et al., "Births: Final Data for 2017," HHS, CDC, NCHS, National Vital Statistics Report, vol. 67, no. 8, November 7, 2018; and Joyce A. Martin, et al., "Births: Final Data for 2016," HHS, CDC, NCHS, National Vital Statistics Report, vol. 67, no. 1, January 31, 2018. |
| 11. |
This is based on a Congressional Research Service |
|||||
| 12. |
Brady E. Hamilton, Lauren M. Roseen, and Amy M. Branum, "Teen Birth Rates for Urban and Rural Areas in the United States, 2007-2015," HHS, CDC, NCHS, NCHS Data Brief, no. 264, November 2016. |
|||||
| 13. |
Guttmacher Institute, "Teen Pregnancy Rates Declined in Many Countries between the Mid-1990s and 2011—United States Lags Behind Many Other Developed Nations," press release, January 23, 2015. |
|||||
| 14. |
United Nations, Statistics Division, "Demographic Yearbook |
|||||
| 15. |
John S. Santelli, Vinit Sharma, and Russell Viner, "Inequality, National Wealth, Economic Development and Global Trends in Teenage Birth Rates, 1990-2010," Journal of Adolescent Health, vol. 52, no. 1 (February 2013); and Melissa S. Kearney and Phillip B. Levine, "Why Is the Teen Birth Rate in the United States So High and Why Does It Matter?" Journal of Economic Perspectives, Spring: 26(2), 2012, pp. 141-166. (Hereinafter, Melissa S. Kearney and Phillip B. Levine, "Why Is the Teen Birth Rate in the United States So High and Why Does It Matter?") |
|||||
| 16. |
Melissa S. Kearney and Phillip B. Levine, "Why Is the Teen Birth Rate in the United States So High and Why Does It Matter?" See also, Gilda Sedgh et al., "Adolescent Pregnancy, Birth, and Abortion Rates Across Countries: Levels and Trends." |
|||||
| 17. |
| |||||
| 18. | Ibid. |
|||||
|
|
||||||
|
Ibid. See also, Heather D. Boonstra, "What Is Behind the Declines in Teen Pregnancy Rates?" Guttmacher Policy Review, vol. 17, no. 3, September 3, 2014. (Hereinafter, Heather D. Boonstra, "What Is Behind the Declines in Teen Pregnancy Rates?") |
||||||
|
|
Heather D. Boonstra, "What Is Behind the Declines in Teen Pregnancy Rates?" and Melissa S. Kearney and Phillip B. Levine, "Investigating Recent Trends in the U.S. Teen Birth Rate." Melissa S. Kearney and Phillip B. Levine, "Investigating Recent Trends in the U.S. Teen Birth Rate," Journal of Health Economics, vol., 41, 2015. See also, Sarah Kliff, "The Mystery of the Falling Teen Birth Rate," Vox, January 21, 2015. (Hereinafter, Sarah Kliff, "The Mystery of the Falling Teen Birth Rate.") 21.
|
|
Melissa S. Kearney and Phillip B. Levine, "Investigating Recent Trends in the U.S. Teen Birth Rate," Journal of Health Economics, vol., 41, 2015. 22.
|
|
Sarah Kliff, "The Mystery of the Falling Teen Birth Rate." |
Kathleen A. Ethier, Laura Kann, and Timothy McManus, "Sexual Intercourse Among High School Students – 29 States and United States Overall, 2005-20015," Morbidity and Mortality Weekly Report, vol. 66, nos. 51 and 52, January 5, 2018. |
| 22. |
Laura Lindberg, John Santelli, and Sheila Desai, "Understanding the Decline in Adolescent Fertility in the United States, 2007-2012," Journal of Adolescent Health, vol. 59, no. 5 (November 2016); and Joyce C. Abma and Gladys M. Martinez, Sexual Activity and Contraceptive Use Among Teenagers in the United States, 2011-2015, HHS, CDC, NCHS, National Health Statistics Reports, no. 104, June 22, 2017. See also, Lisa Romero et al., Vital Signs: Trends in Use of Long-Acting Reversible Contraception Among Teens Aged 15–19 Years Seeking Contraceptive Services—United States, 2005–2013, HHS, CDC, Morbidly and Mortality Weekly Report, April 10, 2015. |
|||||
| 23. |
Sarah Kliff, "The Mystery of the Falling Teen Birth Rate," and Eileen Patten and Gretchen Livingston, Why is the Teen Birth Rate Falling?, Pew Research Center, April 29, 2016. |
|||||
| 24. |
Heather D. Boonstra, "What Is Behind the Declines in Teen Pregnancy Rates?" |
|||||
|
Melissa S. Kearney and Phillip B. Levine, "Media Influences on Social Outcomes: The Impact of MTV's 16 and Pregnant on Teen Childbearing," American Economic Review, vol. 105, no. 12 (2012). |
||||||
|
See CRS Report R45183, Teen Pregnancy: Federal Prevention Programs for further information about current programs that are federally funded. |
||||||
|
Sarah Kliff, "The Mystery of the Falling Teen Birth Rate | ||||||
| 28. |
For further information about evaluation of the federal Teen Pregnancy Prevention program, see Amy Feldman Farb and Amy L. Margolis, "The Teen Pregnancy Prevention Programs (2010-2015): Synthesis of Impact Findings," American Journal of Public Health, vol. 106, no. S1 (September 2016). Outside stakeholders have analyzed the results of the evaluations. One analysis found that multiple evidence-based models were not successfully replicated and raised concerns about the methodology used in some of the studies. See, David B. Muhlhausen, The Failure of the Teen Pregnancy Prevention Program: Advocates of Evidence-Based Policymaking Ignore the Evidence, The Heritage Foundation, Backgrounder, July 31, 2017. Another analysis contends that the evaluations show encouraging results and that the results have generally been more successful than those other programs. See, Ron Haskins and Nathan Joo, Tiered Evidence: What Happens When Evidence-Based Teen Pregnancy Programs Are Scaled Up to New Sites?, Brookings Institution, May 2017. |
|||||
| 29. | CRS calculation based on program data for recent years and of 2017 Census estimates by age. See U.S. Census Bureau, "Annual Estimates of the Resident Population for Selected Age Groups by Sex for the United States." This does not account for the possibility that these programs are reaching a greater percentage of youth who are at risk and are the target population of such programs. Further, this scenario excludes other teen pregnancy programs that are not federally funded. |
|||||
|
HHS, CDC, Winnable Battles Final Report. |
||||||
|
Power to Decide (formerly The National Campaign to Prevent Teen and Unplanned Pregnancy), Why It Matters: Teen Childbearing, Education, and Economic Wellbeing, July 2012. |
||||||
|
Urban Institute, Kids Having Kids: Costs and Social Consequences of Teen Pregnancy. |
||||||
|
Melissa S. Kearney and Phillip B. Levine, "Why Is the Teen Birth Rate in the United States So High and Why Does It Matter?"; and Urban Institute, Kids Having Kids: Costs and Social Consequences of Teen Pregnancy. |
||||||
|
HHS, CDC, Sexually Transmitted Disease Surveillance 2016, September 2017. |
||||||
|
Emily Holcombe, Kristen Peterson, and Jennifer Manlove, Ten Reasons to Still Keep the Focus on Teen Childbearing, Child Trends, March 2009; and Urban Institute, Kids Having Kids: Costs and Social Consequences of Teen Pregnancy. |
||||||
|
The Power to Decide is a Washington, DC-based organization that promotes that all young people have access to the sexual health information, reproductive health services, and sense of possibility that they need to decide if, when, and under what circumstances to get pregnant and have a child. The Power to Decide, 2018 Annual Report, p. 12.
Kelleen Kaye and Alison Ng, Estimating the State and National Savings Associated with Declines in Teen Childbearing, Power to Decide, January 2018. The decrease in teen births is based on the additional number of teen births estimated to have occurred in 2015 if the teen birth rate remained the same as in 1991. |