Frequently Asked Questions About Prescription Drug Pricing and Policy
Changes from April 24, 2018 to May 6, 2021
This page shows textual changes in the document between the two versions indicated in the dates above. Textual matter removed in the later version is indicated with red strikethrough and textual matter added in the later version is indicated with blue.
Frequently Asked Questions About Prescription Drug Pricing and Policy
Contents
- Introduction
- U.S. Prescription Drug Spending
- How Much Does the United States Spend on Prescription Drugs?
How Does 2016Frequently Asked Questions About May 6, 2021 Prescription Drug Pricing and Policy Suzanne M. Kirchhoff Prescription drugs play an important role in the U.S. health care system. Innovative, Analyst in Health Care breakthrough drugs are providing cures for diseases such as hepatitis C and helping Financing individuals with chronic conditions lead fuller lives. Studies show that prescription drug therapy can produce health care savings by reducing the number of hospitalizations and Agata Bodie other costly medical procedures. Analyst in Health Policy Congress and presidential administrations have attempted to ensure that Americans have Kavya Sekar access to pharmaceuticals by, among other legislation, enacting the Medicare Part D Analyst in Health Policy prescription drug benefit as part of the Medicare Modernization and Prescription Drug Act of 2003 (MMA; P.L. 108-173) and expanding drug coverage under the 2010 Patient Simi V. Siddalingaiah Protection and Affordable Care Act (ACA; P.L. 111-148, as amended). Congress also Analyst in Health has enacted laws to encourage manufacturing of lower-cost generic drugs, as well as Economics cutting-edge biologics and biosimilars. Americans are using more prescription drugs, and for longer periods of time, than in past decades. Still, access to prescription drugs remains an issue for a number of consumers, particularly those without insurance; those prescribed expensive specialty drugs for treating serious or rare diseases; or those enrolled in private insurance or public health plans that impose high cost-sharing requirements, such as drug deductibles and coinsurance. The pace of U.S. retail prescription drug spending has varied through the decades. Drug spending growth moderated in the early 2000s due in part to an economic recession and the expanded use of lower-cost generic drugs. Drug spending spiked in 2014, due in part to the introduction of expensive new hepatitis C drugs, increasing 13.5% in 2014 and 8.8% in 2015, before slowing to an average of 3.4% annual growth from 2016 through 2019. Although the pace of spending has declined from the 2014 peak, the Centers for Medicare & Medicaid Services (CMS) forecasts that retail drug spending could average 5.5% annual growth from 2020 through 2028, which would be faster than some other areas of U.S. health care spending in this period. The CMS projections for 2020-2028 are based on a model developed prior to the Coronavirus Disease 2019 (COVID-19) pandemic. Future CMS reports will measure the impact of the pandemic. This CRS report addresses frequently asked questions about government and private-sector policies that affect drug prices and availability. Among the prescription drug topics covered are spending trends, federally funded research and development, regulation of direct-to-consumer advertising, legal restrictions on prescription drug reimportation, and federal price negotiation. The report provides a broad overview of the issues, as well as references to more in-depth CRS products. The Appendix provides references to relevant congressional hearings and documents. Congressional Research Service link to page 5 link to page 7 link to page 7 link to page 10 link to page 11 link to page 11 link to page 12 link to page 14 link to page 15 link to page 19 link to page 19 link to page 20 link to page 22 link to page 24 link to page 25 link to page 27 link to page 27 link to page 33 link to page 36 link to page 39 link to page 41 link to page 44 link to page 9 link to page 10 link to page 13 link to page 16 link to page 19 link to page 20 link to page 26 link to page 45 link to page 46 link to page 6 link to page 21 link to page 30 Frequently Asked Questions About Prescription Drug Pricing and Policy Contents Introduction ..................................................................................................................................... 1 U.S. Prescription Drug Spending .................................................................................................... 3 How Much Does the United States Spend on Prescription Drugs? .......................................... 3 How Does Current Drug Spending Compare to Other Years? .................................................. 6 What Is Behind the Recent Volatility in Retail Drug Spending? .............................................. 7 Changes in Drug Mix .......................................................................................................... 7 Changes in Drug Prices ....................................................................................................... 8 Drug Utilization ................................................................................................................ 10 Are U.S. Consumer Out-of-Pocket Drug Costs Rising? .......................................................... 11 Government Role in Prescription Drug Spending ......................................................................... 15 How Much U.S. Drug Spending Is Paid by Government Programs? ..................................... 15 How Does the Federal Government Pay For Prescription Drugs? .......................................... 16 Can the HHS Secretary Negotiate Medicare Part D Drug Prices? .......................................... 18 What Are U.S. States Doing to Address Drug Costs? ............................................................. 20 Is U.S. Prescription Drug Spending Higher Than in Other Nations? ...................................... 21 Pharmaceutical Development and Marketing ................................................................................ 23 How Much Does Publicly Funded Research Contribute to Drug Development? ................... 23 How Much Does It Cost to Develop New Drugs? .................................................................. 29 Is There a Relationship Between Development Costs and Drug Prices? ................................ 32 Can the FDA Regulate Prescription Drug Prices?................................................................... 35 May U.S. Consumers Import Drugs from Abroad?................................................................. 37 How are Prescription Drug Ads Regulated? ........................................................................... 40 Figures Figure 1. National Retail Prescription Drug Spending .................................................................... 5 Figure 2. Annual Percentage Change in Retail Prescription Drug Spending .................................. 6 Figure 3. U.S. Retail Prescription Drug Price Inflation ................................................................... 9 Figure 4. Consumer Out-of-Pocket Spending as a Share of Retail Drug Spending ...................... 12 Figure 5. Per Capita Out-of-Pocket Spending for Retail Prescription Drugs ................................ 15 Figure 6. Share of Spending for Retail Prescription Drugs by Source .......................................... 16 Figure 7. Per Capita Spending on Retail Drugs in U.S. and Other Countries ............................... 22 Figure 8. Direct-to-Consumer Prescription Drug Advertising ...................................................... 41 Figure 9. Number of Prescription Drug Ads Reviewed by FDA ................................................... 42 Tables Table 1. Commonly Used Prescription Drug Terms ........................................................................ 2 Table 2. Selected Federal Programs Providing Prescription Drug Coverage ................................ 17 Table 3. Findings from Studies on Direct Public Sector Contributions to New Drugs ................. 26 Congressional Research Service link to page 48 link to page 48 link to page 53 Frequently Asked Questions About Prescription Drug Pricing and Policy Appendixes Appendix. Relevant Congressional Drug Pricing Hearings in the 117th, 116th, 115th and 114th Congresses ......................................................................................................................... 44 Contacts Author Information ........................................................................................................................ 49 Congressional Research Service link to page 11 link to page 11 link to page 48 Frequently Asked Questions About Prescription Drug Pricing and Policy IntroductionDrug Spending Compare to Other Years?- What Is Behind the Recent Volatility in Retail Drug Spending?
- Changes in Drug Mix
- Changes in Drug Prices
- Drug Utilization
- Are U.S. Consumer Out-of-Pocket Drug Costs Rising?
- Government Role in Prescription Drug Spending
- How Much U.S. Drug Spending Is Paid by Government Programs?
- How Does the Federal Government Pay For Prescription Drugs?
- Can the HHS Secretary Negotiate Medicare Part D Drug Prices?
- What Are U.S. States Doing to Address Drug Costs?
- Is U.S. Prescription Drug Spending Higher Than in Other Nations?
- Pharmaceutical Development and Marketing
- How Much Does Publicly Funded Research Contribute to Drug Development?
- How Much Does It Cost to Develop New Drugs?
- Does Congress Regulate Prescription Drug Ads?
- May U.S. Consumers Import Drugs from Abroad?
Figures
- Figure 1. National Retail Prescription Drug Spending
- Figure 2. Annual Percentage Change in Retail Prescription Drug Spending
- Figure 3. U.S. Retail Prescription Drug Price Inflation
- Figure 4. Consumer Out-of-Pocket Spending as a Share of Retail Drug Spending
- Figure 5. Per Capita Out-of-Pocket Spending for Retail Prescription Drugs
- Figure 6. Share of Spending for Retail Prescription Drugs by Source
- Figure 7. Per Capita Spending on Retail Drugs in U.S. and Other Countries
- Figure 8. Direct-to-Consumer Prescription Drug Advertising
- Figure 9. Number of Prescription Drug Ads Reviewed by FDA
Tables
Summary
Prescription drugs play an important role in the U.S. health care system. Innovative, breakthrough drugs are providing cures for diseases such as hepatitis C and helping individuals with chronic conditions lead fuller lives. Studies show that prescription drug therapy can produce savings for the broader health care savingssystem by reducing the number of hospitalizations and other costly medical procedures.
Americans are using more prescription drugs, and for longer periods of time, than in past decades. Still, access to prescription drugs remains an issue for a number of consumers, particularly those without insurance; those enrolled in private insurance or public health plans that impose high cost-sharing requirements, such as drug deductibles and coinsurance; and those prescribed expensive specialty drugs for treating serious or rare diseases. Specialty drugs, which can cost tens of thousands of dollars or more for a course of treatment, made up less than 3% of total prescriptions, but nearly 40% of retail and mail-order prescription drug spending, net of rebates in 2016-2017, according to one study.1 (See “Drug Price Transparency” textbox below.)
Retail prescription drug spending has varied over the years. Spending moderated in the early 2000s due in part to an economic recession, and the expanded use of lower-cost generic drugs. Spending has increased at a faster rate in recent years, as manufacturers have introduced new drugs at a record rate and have raised prices for existing brand-name products. (See “What Is Behind the Recent Volatility in Retail Drug Spending?”)
Overall, annual spending for outpatient (retail) drugs jumped 13.5% in 2014 and 8.8% in 2015, before slowing to an average 3.4% annual rate of growth from 2016-2019, including an increase of 5.7% in 2019.2 Although the pace of spending has declined from the 2014 peak, the Centers for Medicare & Medicaid Services (CMS) forecasts that retail drug spending could average 5.5% annual growth from 2020 through 2028, which is faster than some other areas of U.S. health care spending in this period.3 However, the CMS projections for 2020-2028 are based on models developed prior to the COVID-19 pandemic. Future CMS reports will measure the impact of the pandemic.
This CRS report addressesmedical procedures.
Congress and presidential administrations have attempted to ensure that Americans have access to pharmaceuticals by enacting the Medicare Part D prescription drug benefit as part of the Medicare Modernization and Prescription Drug Act of 2003 (MMA; P.L. 108-173) and expanding drug coverage under the 2010 Patient Protection and Affordable Care Act (ACA; P.L. 111-148, as amended). Congress also has enacted laws to encourage manufacturing of lower-cost generic drugs, as well as cutting-edge biologics and biosimilars.
Americans are using more prescription drugs, and for longer periods of time, than in past decades. Still, access to prescription drugs remains an issue for a number of consumers, particularly those without insurance; those prescribed expensive specialty drugs for treating serious or rare diseases; or those enrolled in private insurance or public health plans with high cost-sharing requirements, such as drug deductibles and coinsurance.
Prescription drug affordability has gained renewed attention during the past few years as retail drug spending has risen at the fastest pace in more than a decade—growing 12.4% in 2014 and 8.9% in 2015 before slowing to a 1.3% increase in 2016. There are several reasons for the recent volatility in drug spending. Manufacturers have been introducing new drugs at a record rate and raising prices for many existing brand-name products. The introduction of new hepatitis C drugs at the end of 2013 had a major impact on total drug spending in 2014 and 2015. At the same time, fewer brand-name drugs have lost patent protection than in previous years, resulting in less impact from the use of lower-cost generic substitutes. The Centers for Medicare & Medicaid Services (CMS) forecasts that retail drug spending could average 6.3% annual growth from 2017 to 2026. Although that growth rate would be a reduction from the average level of the past several years, CMS expects retail drug spending to increase faster than other areas of medical spending in this 10-year period.
This report will address frequently asked questions about government and private-sector policies that affect drug prices and availability. Among the prescription drug topics covered are spending trends, federally funded research and development, regulation of direct-to-consumer advertising, legal restrictions on drug reimportation, and federal price negotiation. The report provides a broad overview of the issues as well asand references to more in-depth CRS products. The appendix Appendix provides references to relevant congressional hearings.
1 Steven Hill, Edward Miller, and Yao Ding, “Net Spending On Retail Specialty Drugs Grew Rapidly, Especially For Private Insurance And Medicare Part D,” Health Affairs, vol. 39, no. 11, November 2020, https://www.healthaffairs.org/doi/10.1377/hlthaff.2019.01830. The research looks at net spending after rebates. The authors said their work complemented other research, such as findings by the IQVIA Institute for Human Data Science that in 2018 specialty drugs accounted for approximately half of combined gross spending on retail, mail-order, and provider-administered drugs.
2 Centers for Medicare & Medicaid Services (CMS), “National Health Expenditure Data: Historical,” Table 16, available at https://www.cms.gov/Research-Statistics-Data-and-Systems/Statistics-Trends-and-Reports/NationalHealthExpendData/NationalHealthAccountsHistorical, and “National Health Expenditure Data: Projected,” Table 11, https://www.cms.gov/Research-Statistics-Data-and-Systems/Statistics-Trends-and-Reports/NationalHealthExpendData/NationalHealthAccountsProjected. Also see Sean Keehan et al., “National Health Expenditure Projections, 2019–28: Expected Rebound in Prices Drives Rising Spending Growth,” Health Affairs, March 24, 2020, https://www.healthaffairs.org/doi/full/10.1377/hlthaff.2020.00094.
3 Ibid.
Congressional Research Service
1
link to page 7 link to page 7 link to page 7 Frequently Asked Questions About Prescription Drug Pricing and Policy
Table 1. Commonly Used Prescription Drug Terms
Term
Definition
Biologic
provides references to relevant congressional hearings and documents (see Appendix).
Introduction
Prescription drug affordability has gained renewed attention in the past few years, as retail drug spending has risen at the fastest pace in more than a decade. There are several reasons for the increase in drug spending. Manufacturers have been introducing new drugs at a record rate and raising prices for existing brand-name products. (See "What Is Behind the Recent Volatility in Retail Drug Spending?," below.) At the same time, fewer brand-name drugs have lost patent protection than in previous years, which has meant lower savings from new generic substitutes. The Centers for Medicare & Medicaid Services (CMS) forecasts that retail drug spending could average 6.3% annual growth from 2017 to 2026.1 Although that growth rate would be a reduction from recent, more rapid levels, CMS expects retail drug spending to increase faster than other areas of medical spending in this 10-year period.
This report will address frequently asked questions about government and private-sector policies that affect drug prices and availability. Among the prescription drug topics covered are federally funded research and development, regulation of direct-to-consumer advertising, legal restrictions on reimportation, and federal price negotiation. The report provides a broad overview of the issues and references to more in-depth CRS products. The appendix provides references to relevant congressional hearings (see Appendix).
|
Term |
Definition |
|
Biologic |
Pharmaceuticals derived from a living organism that can be many times the size of a conventional (small-molecule) drug and have a more complex |
|
Biosimiliar |
structure.a
Biosimilar
A follow-on to a biologic that is |
|
Brand-Name Drug |
A drug marketed under a proprietary, trademark-protected name. |
|
Coinsurance |
The percentage share that an enrollee in a health insurance plan pays for a product or service covered by the plan. For example, an insurer may charge 10% coinsurance for a $100 prescription drug, meaning the consumer |
|
Co-payment |
Co-payment A fixed dollar amount that an enrollee in a health insurance plan pays for a product or service covered by the plan. For example, an insurer may charge a $20 co-payment for a physician visit or a $5 co-payment for a prescription drug. |
|
Deductible |
Deductible The amount an enrollee is required to pay for health care services or products before his or her insurance plan begins to provide coverage. An enrollee in an insurance plan with a $500 deductible would be responsible for paying for the first $500 in health care services. In some insurance plans, the deductible does not apply to certain services, such as preventive care. Insurance plans vary regarding whether beneficiaries must meet a deductible for prescription drug coverage. |
|
Generic Drug |
Generic Drug
A drug that is identical to a traditional (small molecule) brand-name drug in dosage, safety, strength, route of administration, quality, performance characteristics, and intended use. Generic drugs generally cost significantly less than their brand-name |
|
Formulary |
counterparts.b
Formulary
A list of prescription drugs covered by an insurance plan. In an effort to control costs, insurers are imposing partially closed formularies, which include a more limited number of drugs than open formularies. Insurers use tiered cost sharing for formulary drugs, meaning patients are charged lower co-payments or coinsurance for less expensive generic drugs and certain brand-name drugs that are designated by the plan as preferred drugs, based on the price the plan has negotiated with the manufacturer and the
effectiveness of the product. At the same time, patients are charged higher co-payments or coinsurance for more expensive drugs or drugs that the plan deems to be less effective.
Orphan Drug
|
|
Orphan Drug |
A traditional drug or biologic for the treatment of rare diseases and disorders that affect fewer than 200,000 people in the United States or that affect more than 200,000 people but where manufacturers are not expected to recover the costs of developing and
marketing a treatment drug. Manufacturers of orphan drugs are eligible for federal tax, marketing, and other incentives.c
Out-of-Pocket Costs
|
|
Out-of-Pocket Costs |
The total amount an insured consumer pays each year for covered health care services that are not reimbursed by an insurance plan. Out-of-pocket costs can include deductibles, co-payments, and coinsurance. |
|
Out-of-Pocket Maximum |
Out-of-Pocket The maximum amount an enrollee must pay before his or her health insurance plan Maximum covers 100% of health benefits. Certain costs, such as premiums, generally are not counted toward an out-of-pocket maximum, or cap. |
|
Pharmacy Benefit Managers (PBMs) |
Pharmacy Benefit Intermediaries between health plans and pharmacies, drug wholesalers, and Managers (PBMs) manufacturers. PBMs perform functions such as designing drug formularies, negotiating prices, and administering prescription drug payment systems. |
|
Pharmacy Network |
Congressional Research Service 2 link to page 7 link to page 7 Frequently Asked Questions About Prescription Drug Pricing and Policy Term Definition Pharmacy Network A group of retail, mail-order, and specialty pharmacies that contract with PBMs and health insurers to dispense covered drugs at set prices. Network pharmacies also may provide other services under contract, such as monitoring patient adherence to drugs. |
|
Premium |
Premium The amount an enrollee pays for health insurance coverage. Many plans charge monthly premiums, but premiums also can be assessed on a quarterly or annual basis. |
|
Specialty Drug |
Specialty Drug
There is no one set definition of specialty drugs, although insurers and other health care payers often characterize them as prescription products requiring extra handling or administration that are used to treat rare and/or complex diseases, such as cancer. High cost can trigger a specialty drug designation. Biologics are often deemed |
|
Underinsured |
specialty drugs.d
Underinsured
Refers to people who have insurance but still have financial difficulty paying for prescription drugs or medical |
treatments.e Source: CRS.
a. See CRS Report R44620, Biologics and Biosimilars: Background and Key Issues, by Judith A. Johnson.
b. . b. U.S. Food and Drug Administration (FDA), "“Generic Drugs,"” at https://www.fda.gov/drugs/resourcesforyou/consumers/buyingusingmedicinesafely/genericdrugs/default.htmdrugs/buying-using-
medicine-safely/generic-drugs. In 1984, Congress enacted the Hatch-Waxman Act (P.L. 98-417), which provided manufacturers of innovative prescription drugs with patent protection and a period of marketing exclusivity, created a generic drug approval process to help companies bring products to market more quickly once the patent for an original brand-name drug expired, and established procedures for resolving patent disputes arising from applications to market generic drugs. Generic drugs make up about 8990% of filled prescriptions and 2620% of total drug spending. See Association for Accessible Medications, 2017 2020 Generic Drug & Biosimilars Access & Savings in the United States Report in the U.S., at https://www.accessiblemeds.org/resources/blog/2017-generic-drug-access-and-savings-us-report.
c. FDA, "accessiblemeds.org/2020-Access-Savings-Report.
c. FDA, “Developing Products for Rare Diseases & Conditions,"” at https at http://www.fda.gov/ForIndustry/DevelopingProductsforRareDiseasesConditions/ucm2005525.htm.
d. ://www.fda.gov/industry/developing-
products-rare-diseases-conditions.
d. See CRS Report R44132, Specialty Drugs: Background and Policy Concerns.
e. There are different definitions of underinsurance. For example, the Commonwealth Fund defines individuals
as underinsured if they had health insurance but still had total out-of-pocket costs or deductibles that were high relative to their incomes. See Commonwealth Fund, "Underinsured Rate Increased Sharply in 2016; More Than Two of Five Marketplace Enrollees and a Quarter of People with Employer Health Insurance Plans Are Now Underinsured," October 18, 2017, at http“Underinsured Rate Rose From 2014-2018, With Greatest Growth Among People in Employer Health Plans,” February 7, 2019, at https://www.commonwealthfund.org/press-release/2019/underinsured-rate-rose-2014-2018-greatest-growth-among-people-employer-health.
://www.commonwealthfund.org/publications/press-releases/2017/oct/underinsured-press-release.
U.S. Prescription Drug Spending
How Much Does the United States Spend on Prescription Drugs?
The most commonly cited data on prescription drug spending come from the National Health Expenditures (NHE) accounts compiled by CMS.24 The NHE accounts track annual spending by all payers for prescription drugs purchased in retail settings, such as pharmacies, mail-order outlets, grocery stores, warehouse clubs, and similar businesses. The NHE data do not include
4 CMS, “National Health Expenditure Projections 2019-2028,” at https://www.cms.gov/Research-Statistics-Data-and-Systems/Statistics-Trends-and-Reports/NationalHealthExpendData/NationalHealthAccountsProjected. The National Health Expenditures (NHE) data incorporate information from the U.S. Census Bureau and IQVIA, a private firm that provides consulting, technology, and other services for the health care industry. The figures include retail sales of prescription drugs, subtract manufacturer rebates, and add in government spending for drugs provided by government-owned mail-order facilities.
Congressional Research Service
3
link to page 9 link to page 10 link to page 10 Frequently Asked Questions About Prescription Drug Pricing and Policy
drugs dispensed in institutions including hospitals, long-term care facilities, and clinics,35 nor do they include over-the-counter products such as aspirin purchased without a prescription.4
6
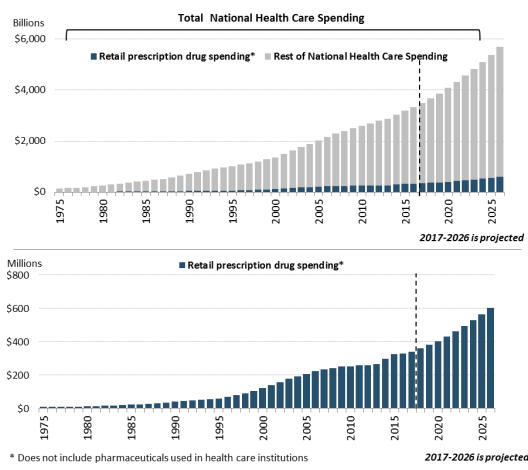
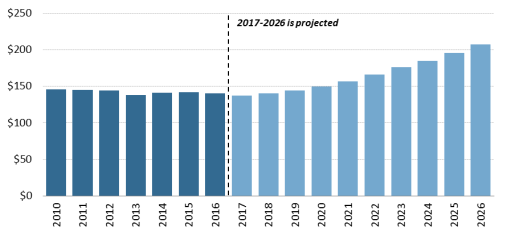
According to the most recent NHE data, the United States spent $328.6369.7 billion on prescription drugs in 20162019 and a forecast $338.1projected $358.7 billion in 20172020, or 10% of predicted 2017 national health care spending of $3.5 trillion.5about 9% of the forecast of $4 trillion in 2020 national health care spending.7 Prescription drug spending is forecast to rise toremain at about 11% 9% of national health care spending by 2027 (see Figure 1). through 2028, down slightly from a prior average of about 10% of health care spending (see Figure 1).
Retail drug spending has ranged from about 5% to 10% of total health care expenditures since 1960, when the NHE accounts began compiling prescription spending data.68 (See "“How Does 2016Current Drug Spending Compare to Other Years?") ”) Because the NHE data provide information about retail drug sales only, a number of analysts say the data do not offer a complete picture of U.S. drug spending. The Department of Health and Human Services (HHS) in April 2016 issued a study that attempted to estimate total U.S. prescription drug spending—retail plus institutional use in hospitals and other health facilities.7
9
5 Although spending for drugs in institutional settings is not included in the NHE retail prescription drug category, it is included in other categories of spending and in overall national health care spending. For example, drugs dispensed in hospitals are included in the NHE hospital spending category.
6 Many over-the-counter products originally were prescription products, such as some antihistamines. See U.S. Food and Drug Administration (FDA), “Now Available without a Prescription,” at https://www.fda.gov/drugs/drug-information-consumers/now-available-without-prescription.
7 CMS, “National Health Expenditure Projections 2019-2028,” at https://www.cms.gov/Research-Statistics-Data-and-Systems/Statistics-Trends-and-Reports/NationalHealthExpendData/NationalHealthAccountsProjected; and “National Health Expenditure Data: Historical,” at https://www.cms.gov/Research-Statistics-Data-and-Systems/Statistics-Trends-and-Reports/NationalHealthExpendData/NationalHealthAccountsHistorical. The NHE projects national health care spending of $6.2 trillion in 2028, including $560 billion in retail drug spending. Sean Keehan et al., “National Health Expenditure Projections, 2019–28: Expected Rebound in Prices Drives Rising Spending Growth,” Health Affairs, March 24, 2020, https://www.healthaffairs.org/doi/full/10.1377/hlthaff.2020.00094. (CMS updated its historic spending data after the Health Affairs article was published to provide actual data, rather than projections, for 2019. This report uses the most updated historic data for prescription drug spending. The historic data showed higher drug spending for 2019 than had been earlier projected by CMS, while the 2020-2028 projections are based on data developed prior to the COVID-19 pandemic.)
8 According to the NHE, retail prescription drug spending was 10% of national health expenditures in 1960. Retail drug spending declined to less than 5% of national health expenditures from 1960 to 1982. During this period, other areas of medical spending were increasing more quickly than drug spending due to the creation of government health programs such as Medicare and Medicaid and the expansion of private health insurance. Retail drug spending began to increase as a share of national health spending in the mid-1980s, due to price inflation and growing consumption. By the early 2000s, retail drug spending had once again reached about 10% of national health care expenditures. See Cynthia Smith, “Retail Prescription Drug Spending in the National Health Accounts,” Health Affairs, vol. 233, no. 1 (January/February 2004), pp. 160-167, at https://www.healthaffairs.org/doi/full/10.1377/hlthaff.23.1.160.
9 Department of Health and Human Services (HHS), Office of the Assistant Secretary for Planning and Evaluation, “Observations on Trends in Prescription Drug Spending,” March 8, 2016, at https://aspe.hhs.gov/pdf-report/observations-trends-prescription-drug-spending. The HHS estimate is based on NHE retail prescription drug data and an outside analysis by the Altarum Institute, a nonprofit health systems research and consulting organization. According to Altarum, nonretail, or institutional, drug spending accounts for 28% of prescription drug spending and retail drugs account for 72% The HHS study provided estimates of total prescription drug spending as a share of U.S. personal health expenditures. Personal health expenditures are a subset of the NHE accounts that measure the amount spent each year to treat people with specific medical conditions. Personal health expenditures do not include some areas of spending included in the broader definition of national health expenditures, such as industry investment and public health activity. According to HHS, total prescription drug spending was projected to account for nearly 17% of personal health expenditures in 2016. The comparable measure for retail prescription drugs was 12%.
Congressional Research Service
4
Frequently Asked Questions About Prescription Drug Pricing and Policy
Figure 1. National Retail Prescription Drug Spending
(Annual spending for retail drugs as a percentage of total health spending)
Source: Centers for Medicare & Medicaid Services (CMS), National Health Expenditure (NHE) data: Historical and Projected. Note: Figures through 2019 are actual; 2020-2028 are forecasts.
In addition to the NHE data, private consultants and academics publish their own forecasts of U.S. prescription drug spending.810 National estimates vary for a number of reasons, including assumptions about the dollar value of rebates that pharmaceutical manufacturers provide to health payers, as well as the value of coupons offered to consumers, and whether the forecasts include both retail and institutional use. However, the different studies show a trend toward higher spending in recent years.
How Does 2016similar spending trends in recent years.
10 IQVIA estimates that prescription drug spending, based on list prices set by manufacturers, was $671 billion in 2019, growing at a 7.1% compound annual growth rate (CAGR) over the previous five years. According to IQVIA, payer net spending is calculated after supply chain discounts, manufacturer rebates, and patient out-of-pocket costs are deducted, and markups and margins by intermediaries are added. Total net payer spending in 2019 was $509 billion and had increased at a CAGR of 4.1% over the previous five years. See IQVIA Institute, “Medicine Spending and Affordability in the United States,” Overview, p. 2, August 2020. Available at https://www.iqvia.com/insights/the-iqvia-institute/reports/medicine-spending-and-affordability-in-the-us. Also see Eric Tichy et al., “National Trends in Prescription Drug Expenditures and Projections for 2020,” American Journal of Health System Pharmacies, vol. 77 (May 15, 2020), at https://academic.oup.com/ajhp/article-abstract/77/15/1213/5837520.
Congressional Research Service
5
link to page 10 link to page 6 link to page 11 link to page 11
Frequently Asked Questions About Prescription Drug Pricing and Policy
How Does Current Drug Spending Compare to Other Years? Drug Spending Compare to Other Years?
The pace of U.S. retail prescription drug spending has varied through the decades. For much of the 1980s through the early 2000s, retail drug spending grew at a double-digit annual pace. From 2003 through 2013, drug spending slowed to a historically low average annual growth rate of 5%.9 about 5%.11 (See Figure 2.) Drug spending growth moderated for a number of reasons during this period, including a deep economic recession from 2007 to 2010, a reduction in the number of expensive new drugs coming to the market compared to earlier years, and a continued expansion in the use of lower-cost generic drugs.10 12 (See Table 1.)
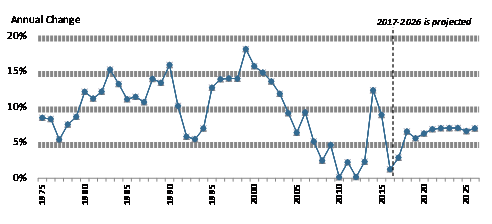
However, in 2014, spending for retail prescription drugs accelerated. U.S. retail drug spending jumped by 12.4% in 20142019 are actual; 2020-2028 are forecasts.
Spending for retail prescription drugs accelerated in 2014, jumping by 13.5%—the largest annual increase in more than a decade. Drug spending rose by 8.98% in 2015 before slowing to a 1.3% increase in 2016 and a forecasted 2.9% increase in 2017.11 (See "pace of a 3.4% annual rate of growth from 2016 to 2019.13 (See “What Is Behind the Recent Volatility in Retail Drug Spending?” below.) According to CMS, a 5.7% increase in spending in 2019 was influenced by growing utilization, including use of drugs for autoimmune disorders, cancer, and diabetes.14
11 Aaron Catlin and Cathy Cowan, History of Health Spending in the United States, 1960-2013, Health Affairs, November 23, 2015, at https://www.healthaffairs.org/do/10.1377/hblog20151123.051904/full/. The implementation of Medicare Part D in 2006 caused a spike in prescription drug spending that year.
12 Ibid., p. 23. 13 Centers for Medicare & Medicaid Services (CMS), “National Health Expenditure Data: Historical,” at https://www.cms.gov/Research-Statistics-Data-and-Systems/Statistics-Trends-and-Reports/NationalHealthExpendData/NationalHealthAccountsHistorical, and “National Health Expenditure Data: Projected,” https://www.cms.gov/Research-Statistics-Data-and-Systems/Statistics-Trends-and-Reports/NationalHealthExpendData/NationalHealthAccountsProjected. Also see Sean Keehan et al., “National Health Expenditure Projections, 2019–28: Expected Rebound in Prices Drives Rising Spending Growth,” Health Affairs, March 24, 2020, https://www.healthaffairs.org/doi/full/10.1377/hlthaff.2020.00094.
14 Anne Martin, Micah Hartman, David Lassman, Aaron Catlin, “National Health Care Spending In 2019: Steady Growth for the Fourth Consecutive Year,” Health Affairs, December 16, 2020, https://www.healthaffairs.org/doi/full/10.1377/hlthaff.2020.02022.
Congressional Research Service
6
link to page 48 Frequently Asked Questions About Prescription Drug Pricing and Policy
Retail drug spending is projected to grow by about 5.5% a year on average from 2020 through 2028, according to the NHE, due partly to faster projected drug price growth and growing intensity of use.15 That is in line with NHE projections for overall U.S. health care spending to grow at a 5.4% annual rate from 2019 to 2028. The CMS projections are based on data developed prior to the COVID-19 pandemic.
During recent Congresses, lawmakers held a series of hearings Retail Drug Spending?," below.)12 Retail drug spending is projected to grow by about 6.3% a year on average through 2027, according to the NHE, due partly to faster projected drug price growth, particularly for costlier specialty drugs. Although that growth rate would be a reduction from the recent pace, drugs would be expected to grow faster than other areas of health care spending. For example, the NHE accounts project that physician services and hospital care will grow 5% and 5.5% on average, respectively, over the same time period.13
During the 114th and 115th Congresses, a series of hearings have been held on prescription drugs in response to the mid-2010’sto the acceleration in spending and continued, sharp increases in prices for specific certain drugs. (See partial list of hearings in Appendix. The list focuses on hearings most relevant to drug pricing issues.)
What Is Behind the Recent Volatility in Retail Drug Spending?
Retail As discussed below, retail prescription drug spending can be affected by (1) changes in the mix of available drugs in the marketplace, (2) changes in the price of drugs, and (3) changes in the volume of drugs used. The rapid increase in retail drug spending in 2014 and 2015 was driven largely by the introduction of new high-cost drugs, price increases for existing drugs, and the diminishing impact of generic substitution, as fewer brand-name drugs lost patent protection than in previous years. Implementation of the Patient Protection and Affordable Care Act (ACA; ACA (P.L. 111-148, as amended) also helped to propel boost drug demand.14 The rate16 The slower pace of prescription drug spending since 2015 is due to factors that include reduced use and prices for expensive hepatitis C drugs.17
Looking forward, CMS expects retail prescription drug spending to be propelled by faster drug price increases and higher growth in use and intensity. Other factors contributing to this projected increase include the aging of the population and the expected introduction of new drugs for such conditions as cancer, diabetes, and Alzheimer’s disease.18
of prescription drug spending slowed in 2016, even though overall utilization rose during that year, due to factors that included fewer new drug approvals than in previous years, less use of high-cost hepatitis C drugs, and a deceleration in spending for drugs to treat diabetes.15
Changes in Drug Mix
Changes in Drug Mix
Drug mix refers to the composition of the different types of drugs being utilized in the retail marketplace, specifically focused on the availability and Drug mix refers to the cost of new drugs versus the costthose of older drugs being used. New, innovator brand-name drugs often are more expensive than older drugs and do not have lower-cost equivalents. Likewise, newly introduced generic drugs, which are less expensive than brand-name products, can reduce the cost of certain therapies.
During the past several years, the U.S. Food and Drug Administration (FDA) has approved a large number of novel new drugs,16 including expensive specialty drugs for treating hepatitis C, cancer, diabetes, and heart disease.17 In 2016 alone, more than half of the growth in U.S. prescription drug spending was from drugs that had been available for less than two years.18 The introduction of new hepatitis C drugs, which can cure the disease, played a large role in increased drug spending in 2014 and 2015, accounting including a number of specialty drug products.19 The 15 Sean Keehan et al., “National Health Expenditure Projections, 2019–28: Expected Rebound in Prices Drives Rising Spending Growth,” Health Affairs, March 24, 2020, https://www.healthaffairs.org/doi/full/10.1377/hlthaff.2020.00094. (CMS updated its historic spending data after the Health Affairs article was published to provide actual data, rather than projections, for 2019. This report uses the most updated historic data for prescription drug spending.)
16 Anne B. Martin et al., “National Health Spending In 2014: Faster Growth Driven by Coverage Expansion and Prescription Drug Spending,” Health Affairs, vol. 35, no.1 (December 2, 2015), pp. 150-160, at https://www.healthaffairs.org/doi/full/10.1377/hlthaff.2015.1194; and Anne Martin et al., “National Health Spending: Faster Growth In 2015 As Coverage Expands and Utilization Increases,” Health Affairs, vol. 26, no. 1 (January 2017). 17 Sean Keehan et al., “National Health Expenditure Projections, 2019–28: Expected Rebound in Prices Drives Rising Spending Growth,” Health Affairs, March 24, 2020, https://www.healthaffairs.org/doi/full/10.1377/hlthaff.2020.00094.
18 Andrea Sisko et al., “National Health Expenditure Projections, 2018-27: Economic and Demographic Trends Drive Spending and Enrollment Growth,” Health Affairs, February 20, 2019, at https://www.healthaffairs.org/doi/full/10.1377/hlthaff.2018.05499.
19 FDA approved 53 novel drugs in 2020, 48 novel drugs in 2019, 59 novel drugs in 2018, 46 novel drugs in 2017, 22 in 2016, and 45 in 2015. See FDA, “Novel Drug Approvals for 2020,” at https://www.fda.gov/drugs/new-drugs-fda-
Congressional Research Service
7
link to page 13 Frequently Asked Questions About Prescription Drug Pricing and Policy
introduction of a new generation of hepatitis C drugs alone, which can cure the disease, accounted for nearly 40% of the net growth in total U.S. drug spending in 2014 and two-thirds of increased brand-name prescription drug spending by employer-sponsored health plans that year.1920 The outsized impact of the hepatitis C drugs, while still large,drugs is diminishing as fewer new patients are treated with the products and new competing products come on the market, affecting prices. However, growth in the number of newly introduced drugs and increased use of high-cost specialty drugs, continue to have an outsized impact on spending.
For example, according to the analytics and consulting firm IQVIA, U.S. net pharmaceutical revenues rose from $300 billion in 2014 to $356 billion in 2019. There were partially offsetting trends in pricing and utilization during that period. For example, new drug launches contributed $68 billion to net manufacturer revenue growth during the period, price increases for brand drugs with marketing or patent protection21 contributed $21 billion, and volume growth for protected brands contributed $40 billion. At the same time, a loss of marketing and patent exclusivity, paving the way for generic production, and changes in the volume and price of generics reduced manufacturer net revenues by $73 billion.22 Many protected brand drugs are specialty drugs.
the products and net prices drop for the drugs.20
At the same time that these expensive new drugs were coming to the market, new generic substitution was playing a smaller role in reducing total drug spending. Since 2009, patents for a number of best-selling brand-name drugs have expired, paving the way for manufacturers to produce new generic versions.21 In 2012, at the peak of the so-called patent cliff, spending for brand-name drugs subject to generic competition fell by $32.6 billion. However, annual savings from brands that have lost patent protection has been lower since then.22
Changes in drug mix will continue to play an important role in spending going forward. Many drugs now in the development pipeline are biologics,23 which often have a high introductory price and initially may not have many lower-cost alternatives. 23 Although the FDA has approved nearly 30FDA has begun to approve biosimilar substitutes for biologics that have lost patent and marketing protection, so far these biosimilars are not significantly lower-priced than the original biologics.24
Changes in Drug Prices
Prescriptionthere has been a lag in bringing many of these biosimilars to the market.24 In addition, biosimilars so far have not reduced prices for biologic products as significantly as lower-priced generics have done for traditional, chemical drugs.
Changes in Drug Prices
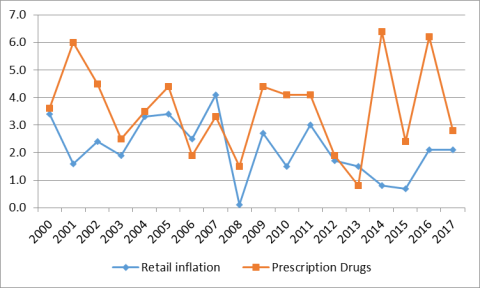
Although there have been annual fluctuations, prescription drug prices have risen faster than prices for overall U.S. goods and services since 2014in most years from 2000 to 2020, according to the U.S. Department of Labor's Consumer Price Index (CPI), which measures retail inflation.25 The gap between prescription drug and overall inflation narrowed significantly in 2017. (See Figure 3.)
25 (See Figure
cders-new-molecular-entities-and-new-therapeutic-biological-products/novel-drug-approvals-2020.
20 Murray Aitken et al., “Has the Era of Slow Growth for Prescription Drug Spending Ended?” Health Affairs, vol. 35, no. 9 (September 2016), p. 1601. The study looked at retail and institutional drug spending. Health Care Cost Institute, 2014 Health Care Cost and Utilization Report, October 2015, p. ii, at https://www.healthcostinstitute.org/research/annual-reports. The report, based on claims data from three major commercial insurers, found that per capita brand-name drug spending in employer-sponsored plans rose by $45 from 2013 to 2014. About two-thirds of the increase, $29.60, was for newly introduced drugs for hepatitis C.
21 Most often driven by brands in the three-to-five-year period since their launch. 22 IQVIA Institute, “Medicine Spending and Affordability in the United States,” p. 7, August 2020. Available for download at https://www.iqvia.com/insights/the-iqvia-institute/reports/medicine-spending-and-affordability-in-the-us.
23 CRS Report RL34045, FDA Regulation of Follow-On Biologics, and CRS Report R42890, The Role of Patents and Regulatory Exclusivities in Pharmaceutical Innovation. Federal law has provided 12 years of marketing exclusivity for certain biologic drugs, which limits manufacturers’ initial market competition and increases their pricing power. Lawmakers also have attempted to spur development of lower-cost biosimilar products, similar to earlier efforts to stimulate development of generic products. Congress and the President enacted the Biologics Price Competition and Innovation Act of 2009 (BPCIA) as Title VII of the Patient Protection and Affordable Care Act (ACA; P.L. 111-148, as amended). The ACA/BPCIA gives the FDA authority to license products shown to be biosimilar to or interchangeable with an FDA-licensed biological product.
24 FDA, “Biosimilar Product Information,” https://www.fda.gov/drugs/biosimilars/biosimilar-product-information. 25 Retail inflation is a measure of the average change over time in prices for a set list of consumer goods and services. The Consumer Price Index (CPI) is based on a market basket of goods and services. For prescription drugs, Department of Labor analysts survey a sample of drug stores and a list of the last 20 drugs dispensed. See BLS, “Measuring Price
Congressional Research Service
8
link to page 13 link to page 11
Frequently Asked Questions About Prescription Drug Pricing and Policy
3.) U.S. retail drug inflation, as measured by the CPI-U,26 has fluctuated from annual increases of greater than 6% to a 2020 price decline.
Figure 3. U.S. Retail Prescription Drug Price Inflation
(Annual
|
 |
Source: U.S. Department of Labor, Bureau of Labor Statistics, Consumer Price Index, All Urban Consumers (CPI-U). Notes: Non-seasonally adjusted data are for 12 months ending in December. The data do not include drugs dispensed through Medicaid or workers |
U.S. retail drug inflation, as measured by the CPI-U,26 was 6.4% in 2014, compared to general consumer inflation of 0.8%. Drug prices rose 6.2% in 2016, compared to a 2.1% consumer inflation rate, and 2.8% in 2017, compared to consumer inflation of 2.1%.
Drug inflation has been driven mainly by price increases for existing brand-name drugs and adoption of expensive new innovator brand-name drugs.2727 (See "“Changes in Drug Mix.”) Within the brand-name drug category, biologics and specialty drugs have driven much of the price inflation.28
Change in the CPI: Medical care,” https://www.bls.gov/cpi/factsheets/medical-care.htm#A3.
26 The CPI-U is the CPI value for urban consumers. It excludes rural populations and represents approximately 80% of the population.
27 Murray Aitken et al., “Has the Era of Slow Growth for Prescription Drug Spending Ended?” Health Affairs, vol. 35, no. 9 (September 2016), pp. 1595-1603. The study looked at retail and institutional drug spending.
28 Ibid. There is wide variation in estimates of specialty drug spending depending on how the specialty drug category is defined. For example, see HHS, Office of the Assistant Secretary for Planning and Evaluation, “Observations on Trends in Prescription Drug Spending,” March 8, 2016, at https://aspe.hhs.gov/pdf-report/observations-trends-prescription-drug-spending.
Congressional Research Service
9
Frequently Asked Questions About Prescription Drug Pricing and Policy
Changes in Drug Mix," above.)
Manufacturers also have raised prices for a number of existing generic drugs in the past several years. However, a 2016 HHS study found that generic price increases were not a major contributor to inflation.28 Likewise, pharmacy benefits manager (PBM) Express Scripts, in an analysis of prescription drug claims data, has found that the average price for commonly used brand-name drugs rose 10.7% from 2015 to 2016, and average prices for generic drugs declined by 8.7% over the same time period.29 Within the brand-name drug category, biologics and specialty drugs have driven much of the price inflation.30
Drug Price Transparency Drug Price Transparency It can be difficult to determine the final price of a prescription drug due to a lack of transparency in the marketplace. Drug companies price discriminate, meaning they sell the same drug to different buyers (wholesalers, health plans, pharmacies, hospitals, government purchasers, and other providers) at different prices. The final price of a drug may include rebates and discounts to health plans and pharmacy benefit managers that are not publicly disclosed. Market participants, such as wholesalers, add their own markups and fees. Complicating the picture even more, pharmaceutical manufacturers offer direct consumer discounts, such as prescription drug coupons that can be redeemed when filling a prescription at a pharmacy. Drug companies also offer charitable aid through patient assistance programs for individuals who cannot afford their prescriptions. Eligibility is often based on
income. The most commonly published drug prices do not include these discounts and rebates, which appear to be growing in size and importance according to government and private analyses. Source: CRS Report R44264, Prescription Drug Discount Coupons and Patient Assistance Programs (PAPs); IQVIA Institute, “Medicines Use and Spending in the U.S. A Review of 2018 and Outlook to 2023,” May 2019, Exhibit 14, p. 20, HHS OIG, “Increases in Reimbursement for Brand-Name Drugs in Part D,” June 2018, https://oig.hhs.gov/oei/reports/oei-03-15-00080.asp.
Drug Utilization
Total prescription drug use has been rising in recent years. According to the Centers for Disease Control and Prevention (CDC), the percentage of people in the United States using at least one prescription drug in the previous 30 days rose to 48.4% from 2013 to 2016, compared with 39.1% from 1988 to 1994.29 Total U.S. prescriptions, adjusted for length, rose to 6.4 billion in 2019 from 6.02 billion in 2017.30
The ACA expansion of prescription drug coverage has helped to boost demand for prescription drugs. Beginning in 2014, the ACA provided tax credits for the purchase of ACA exchange-based health plans and required many private insurance plans to cover prescription drugs as part of a package of essential health benefits.31 Studies of health insurance plans sold through ACA exchanges showed a nearly 15% annual increase in drug spending for those insured consumers from 2014 to 2015, driven mainly by higher utilization.32 Medicaid coverage was also expanded under the ACA, providing more drug coverage for non-elderly, low-income individuals.33 In
29 CDC, “Health United States, 2018,” Table 38, https://www.cdc.gov/nchs/fastats/drug-use-therapeutic.htm. 30 IQVIA Institute, “Medicine Spending and Affordability in the United States,” Exhibit 29, p. 32, August 2020. Available for download at https://www.iqvia.com/insights/the-iqvia-institute/reports/medicine-spending-and-affordability-in-the-us. According to IQVIA, prescription counts are adjusted for length of prescriptions and are reaggregated. Prescriptions referred to as 90-day are calculated based on transactions with 84 days supply or more to include medicines with up to one week fewer treatment days. Prescriptions for 84 days supply or more are factored by three, and those under 84 days are unchanged. The figure includes both retail and long-term care prescriptions.
31 The essential health benefits are 10 categories of services required by private plans offered in the nongroup and small-group markets. The requirement to offer the essential health benefits does not apply to large-group plans, self-insured plans, or grandfathered plans. CRS Report R44163, The Patient Protection and Affordable Care Act’s Essential Health Benefits (EHB).
32 Express Scripts, “Exchange Pulse,” June 2016, https://docplayer.net/126670164-Exchange-pulse-public-health-exchanges-report-june-2016.html.
33 The ACA raised the income threshold used to qualify individuals for the Medicaid program, thereby expanding coverage to more people. The ACA originally made the state Medicaid expansion mandatory, but the Supreme Court found that the enforcement mechanism for the expansion was unconstitutional, basically rendering it voluntary. Although prescription drug coverage is an optional Medicaid benefit, all states include drug coverage. See CRS In Focus IF10399, Overview of the ACA Medicaid Expansion.
Congressional Research Service
10
link to page 16 Frequently Asked Questions About Prescription Drug Pricing and Policy
An analysis of the most recent National Health Expenditures prescription drug forecast for 2017-2026 included a special section on rebates. According to the analysis, increased rebates "contributed to lower net prices for many prescription drugs in recent years and are expected to have dampened prescription drug spending growth in 2017. In 2018 and beyond, the share of total prescription drug spending affected by rebates is not expected to increase as rapidly as in the recent past. As a result, the outlook for such spending reflects somewhat stronger growth in drug prices." Source: CRS Report R44264, Prescription Drug Discount Coupons and Patient Assistance Programs (PAPs); IQVIA Institute, "Medicines Use and Spending in the U.S. A Review of 2016 and Outlook to 2021," Chart 1, May 2017; and "National Health Expenditure Projections, 2017–26: Despite Uncertainty, Fundamentals Primarily Drive Spending Growth," Health Affairs, vol. 37, no. 3 (March 2018). |
Drug Utilization
During the past several years, the ACA expansion of prescription drug coverage has helped to boost demand for prescription drugs. Beginning in 2014, the ACA provided tax credits for the purchase of ACA exchange-based health plans and required many private insurance plans to cover prescription drugs as part of a package of essential health benefits.31 Studies of health insurance plans sold through ACA exchanges show a nearly 15% annual increase in drug spending for those insured consumers from 2014 to 2015, driven mainly by higher utilization.32 Medicaid coverage also expanded under the ACA, including drug coverage for non-elderly, low-income individuals.33 In 2014, the ACA changes to Medicaid contributed to an 8% jump in Medicaid prescription drug claims and a 20% rise in gross Medicaid prescription drug spending.34
34
The aging of the baby boomers also has contributed to increased demand. According to IQVIA, patients aged 50 and older accounted for 70% of dispensed prescriptions in 2016 and 77% of the increase in drug dispensing since 2011.35
, as Americans over age 65 have significantly higher rates of prescription drug use than their younger counterparts.35
During the past several years, utilization has been affected by government and health payer efforts to reduce abuse of prescription opioids. For example, opioid use in the Medicare Part D program has been declining due to tighter program controls, although it still remains at high levels. According to the HHS Office of the Inspector General (OIG), Part D covered nearly 67 million opioid prescriptions in 2019—an average of 5.3 prescriptions per beneficiary receiving opioids. By comparison, Part D covered 71 million opioid prescriptions in 2018, 76 million in 2017, and 79 million in 2016.36
Are U.S. Consumer Out-of-Pocket Drug Costs Rising? Are U.S. Consumer Out-of-Pocket Drug Costs Rising?
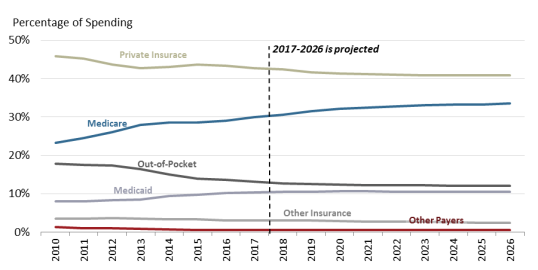
As recently as 1990, consumer out-of-pocket spending—cash payments, health plan deductibles, coinsurance, and co-payments—for filled prescriptions made up 57% of U.S. retail drug spending, whereas commercial payers and taxpayer-financed health programs accounted for about 43%, according to NHE data. However, in the ensuing years, commercial payers and taxpayer-financed health programs have covered a growing share of the nation'’s retail prescription drug bill. The(See Figure 4.) According to the latest NHE data forecast that, out-of-pocket spending declined to 13.2% of about 14% of retail drug spending in 20172019, versus 86.2about 86% for these other payers.36 In 202637 By 2028, out-of-pocket spending is forecast to account for 12.1% of retail drug costs. (See Figure 4.)
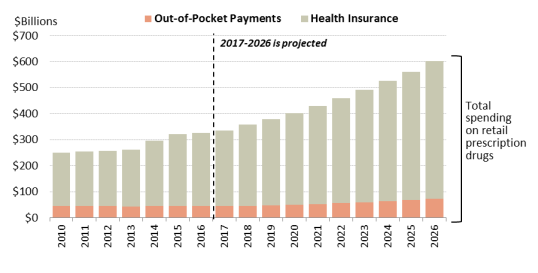
Although consumer cost sharing represents a smaller share of overall prescription drug spending than in the past, consumers can still face high out-of-pocket expenses depending on the specific drugs they are prescribed (generic versus brand -name), whether they have insurance, the policies of their health plans, and their eligibility for manufacturer drug discount coupons or charitable assistance programs.
During the past several years
In general, health plans have been imposing higher levels of cost sharing for more expensive or less preferred prescription drugs in an effort to control spending and costs. From 2012 to 2015, the share of commercial health plans with a prescription drug deductible rose to 46% from 23%, according to an IQVIA analysis.37 Drug deductibles are especially prevalent in health plans sold on ACA state exchanges.38 There has been a continued increase in the use of formulary tiered pricing and in the practice of imposing coinsurance, as opposed to flat co-payments, for more expensive or less preferred drugs. In tiered pricing, a consumer may pay a $10 co-payment for a generic drug on a formulary low-cost price tier; the same consumer may be charged 30% coinsurance for an expensive specialty drug on a high-priced tier. The differential between health plan price tiers has been widening, imposing a greater financial burden on consumers who use higher-priced drugs.39 For example, in 201738
In 2020, enrollees in employer-sponsored health plans with three or more drug tiers had an average co-payment of $110116 for a high-priced tier-four drug, compared towith an $11 co-payment for a tier-one generic drug.
The cost-sharing increases appear toCoinsurance for covered workers in plans with three or more tiers averaged 18% for first-tier drugs, 25% second-tier preferred drugs, 37% third-tier nonpreferred drugs, and 28% for fourth-tier drugs.39 Nearly all covered workers at large firms had coverage for
38 Kaiser Family Foundation, 2020 Employer Health Benefits Survey, Section 9, at https://www.kff.org/report-section/ehbs-2020-section-9-prescription-drug-benefits/. The Kaiser data indicate that the differential has increased, but 2018 is not directly comparable to some previous years due to a change in methodology.
39 Ibid., Kaiser. According to Kaiser, preferred drugs are drugs included on a formulary or preferred drug list; for example, a brand-name drug without a generic substitute. Nonpreferred drugs are drugs not included on a formulary or preferred drug list; for example, a brand-name drug with a generic substitute. Fourth tier drugs refer to new types of cost-sharing arrangements that typically build additional layers of higher co-payments or coinsurance for specifically
Congressional Research Service
12
Frequently Asked Questions About Prescription Drug Pricing and Policy
specialty drugs, including 45% of workers who are in a plan with at least one cost-sharing tier just for specialty drugs. Insurers often base enrollee coinsurance on a list price for a drug, rather than the insurer’s net price after accounting for manufacturer rebates and other price discounts. Some health plans have begun to base enrollee co-insurance on net prices. 40 However, insurers may increase premiums or set higher deductibles to make up for lost revenue from such a change.
Increases in prescription drug cost-sharing for specific drugs have been partially moderated by other developments. The ACA capped total annual out-of-pocket spending in many commercial health plans, eliminated cost sharing for contraceptives, and reduced average cost sharing for Part D enrollees.4041 (There is no annual cap on out-of-pocket spending in Part D.) Pharmaceutical manufacturers have expanded patient assistance via discount coupons (which cover a portion of required health plan cost sharing) and patient assistance programs (which provide aid based on health condition and annual income).4142 Generic drug-use rates, for which cost sharing is low, have continued to increase.
According to some recent studies of insured consumers, average out-of-pocket spending for retail drugs has declined in the past several years. However, the number of consumers with high out-of-pocket costs—such as those with serious conditions or those prescribed specialty drugs—has increased.43
Caps on Annual Out-of-Pocket Spending
Many private health insurance plans place an annual cap, or maximum, on enrollee out-of-pocket spending for covered health care services, after which the payer covers the cost. For Source: Healthcare.gov, https://www.healthcare.gov/glossary/out-of-pocket-maximum-limit/, and CRS Report R40611, Medicare Part D Prescription Drug Benefit. Notes: Only certain grandfathered private plans do not have to comply with the out-of-pocket cap. |
A
There are differing reports regarding trends in consumer out-of-pocket spending. For example, a 2016 study of enrollees in large employer-sponsored health plans found that average out-of-pocket spending on prescription drugs declined to $144 in 2014 from a recent high of $167 in 2009.42 identified types of drugs, such as lifestyle drugs or biologics.
40 Unitedhealthcare, “Successful Prescription Drug Discount Program Expands to Benefit More Consumers at Point-of-sale,” March 12, 2019, https://www.unitedhealthgroup.com/newsroom/2019/2019-03-12-prescription-drug-program-expands-to-benefit-consumers-point-of-sale.html.
41 Departments of Labor, HHS, and the Treasury, “FAQS about Affordable Care Act Implementation Part 36,” January 9, 2017, at https://www.cms.gov/CCIIO/Resources/Fact-Sheets-and-FAQs/Downloads/ACA-FAQs-Part36_1-9-17-Final.pdf .
42 See IQVIA Institute, “Medicine Spending and Affordability in the United States,” p. 18, available at https://www.iqvia.com/insights/the-iqvia-institute/reports/medicine-spending-and-affordability-in-the-us; and CRS Report R44264, Prescription Drug Discount Coupons and Patient Assistance Programs (PAPs).
43 Ibid., IQVIA, p. 3. According to the IQVIA Institute, Part D enrollees paid $16.1 billion out of pocket in 2019, up 27% over the previous five years. The change included an 8.3 million (18.2%) increase in the over-65 population and a 13.7% increase due to greater use of medicines and shifts to drugs that may have higher out of-pocket costs. The higher spending was offset 5.2% by lower per-prescription costs. Patients covered by commercial insurance paid $36 billion out of pocket in 2019, down 5% from 2014, reflecting mix and volume changes, as well as greater use of coupons and vouchers provided by manufacturers. By law, coupons are not allowed to be used by patients using government programs.
Congressional Research Service
13
link to page 19 link to page 19 Frequently Asked Questions About Prescription Drug Pricing and Policy
2009.44 But nearly 3% of enrollees had out-of-pocket costs of more than $1,000 in 2014, accounting for about one-third of drug spending and also one-third of all out-of-pocket spending. The share of people with high drug costs grew 2.5 times between 2004 and 2014. More recently in Medicare Part D, the unit cost of a specialty drug claim rose from $1,151 in 2007 to $4,455 in 2018. Beneficiaries can pay up to 33% coinsurance for Part D specialty drugs.45
A separate 2020 study by HHS on spending for outpatient prescription drugs found that from 2009 to 2018, median annual out-of-pocket spending per user in the United States declined to $54 from $93. The general finding held across different age groups and across different forms of insurance coverage, with some differences in degree.46
According to the NHE dataThe share of people with high drug costs has tripled since 2004.
A separate study of drug claims in commercial health plans found that median out-of-pocket spending for outpatient specialty drugs (those costing $600 or more per month) rose from $24 per month in 2003 to $35 per month in 2014, a 46% increase. During the same period, median out-of-pocket spending for nonspecialty drugs declined 57%, from $14 to $6 per month.43
According to the NHE, per person out-of-pocket spending for retail prescription drugs declinedfluctuated from $146 in 2010 to $140 in 2016. It is forecast to dip to $137 in 2017 and then145 in 2012 to $148 in 2016, before declining to $144 in 2018. Out of pocket spending is forecast to gradually increase to $207 by 2026.44 (See190 by 202847 (see Figure 5.)). Because out-of-pocket spending is expected to rise more slowly than overall U.S. retail drug spending in the next decade, out-of-pocket spending is forecast to continue to decline as a share of retail drug expenditures.
expenditures (see Figure 5).
44 Peterson-Kaiser Health System Tracker, “Examining High Prescription Drug Spending for People with Employer Sponsored Health Insurance,” October 27, 2016, at http://www.healthsystemtracker.org/insight/examining-high-prescription-drug-spending-for-people-with-employer-sponsored-health-insurance/. The 2009 figure of $167 is about $185 in 2014 dollars.
45 MedPAC, Report to the Congress: Medicare Payment Policy, March 2019, p. 414, http://medpac.gov/docs/default-source/reports/mar19_medpac_ch14_sec.pdf?sfvrsn=0. Part D specialty drugs are defined as those with a negotiated price of $670 or more per month. If a Part D enrollee has sufficient out-of-pocket spending to reach the catastrophic portion of the benefit, cost-sharing is reduced to a maximum of 5% coinsurance.
46 William Carroll, G. Edward Miller, and Steven Hill, “Out-of-Pocket Spending for Retail Prescribed Drugs by Age and Type of Prescription Drug Coverage, 2009 to 2018,” HHS Agency for Healthcare Research and Quality (AHRQ), December, 2020, https://meps.ahrq.gov/data_files/publications/st532/stat532.pdf. Study based on data from the Medical Expenditure Panel Survey, Household Component, 2009–2018. Annual figures were inflated to 2018 dollars using the all-item Consumer Price Index.
47 CMS, “National Health Expenditure Projections 2019-2028,” Table 11, at https://www.cms.gov/Research-Statistics-Data-and-Systems/Statistics-Trends-and-Reports/NationalHealthExpendData/NationalHealthAccountsProjected.html.
Congressional Research Service
14
link to page 20
Frequently Asked Questions About Prescription Drug Pricing and Policy
Figure 5. Per Capita Out-of-Pocket Spending for Retail Prescription Drugs
(projected increases in out-of-pocket spending) |
 |
|
Source: CMS, National Health Expenditure forecast data. |
Source: CMS, National Health Expenditure, Projected Data. Government Role in Prescription Drug Spending
How Much U.S. Drug Spending Is Paid by Government Programs?
Congress and presidential administrations have expanded subsidized drug coverage to tens of millions of consumers during the past decade by implementing Medicare Part D (Medicare Modernization Act, 2003) and expanding eligibility for Medicaid as part of the ACA.4548 As a result, the government share of U.S. retail prescription drug spending (federal, state and local) rose from about 25% in 2005—the year before Part D took full effect—to an estimated 44.141% in 20172019. The government share of drug spending is forecast to rise to 4753% by 2028.49 % by 2026.46 (See Figure 6.)
How Does the Federal Government Pay For Prescription Drugs?
Unlike many other industrialized nations,47 the United States does not operate a single, centralized system for administering government-sponsored drug benefits, procuring pharmaceuticals, or setting drug prices.50 Instead, the various departments and agencies that oversee federal health programs operate a range of congressionally mandated drug discount and contracting systems, including market-based negotiations in Medicare Part D, direct procurement in the Veterans Health Administration, and a combination of mandatory rebates and negotiations in Medicaid. Separately, FDA regulates the safety and effectiveness of prescription drugs.48 51 Congress has not given FDA authority to set drug prices or to consider prices as part of its drug approval process.
Federal agencies can secure substantial discounts for prescription drugs under this decentralized system. However, price discounts vary widely among federal programs. For example, according to a recent Congressional Budget Office (CBO) report on the prices of 176 drugs (net of applicable rebates and discounts), the average price ranged from $118 in Medicaid to $343 in Medicare Part D. According to CBO, the lower net prices in Medicaid were due to higher manufacturer rebates for that program than for Medicare Part D. 52 The Department of Veterans Affairs (VA) and Department of Defense had average prices between the average prices in 50 See “Is U.S. Prescription Drug Spending Higher Than in Other Nations?” 51 Beginning with the Food and Drugs Act of 1906, Congress has incrementally refined and expanded FDA’s responsibilities regarding drug approval and regulation. CRS Report R41983, How FDA Approves Drugs and Regulates Their Safety and Effectiveness. See, in particular, Federal Food, Drug, and Cosmetic Act (FFDCA) §§505 (new drugs), 501 (adulteration), and 502 (misbranding).
52 Congressional Budget Office, “A Comparison of Brand-Name Drug Prices Among Selected Federal Programs,” February 18, 2021, https://www.cbo.gov/publication/56978.
Congressional Research Service
16
link to page 22 link to page 21 link to page 22 link to page 22 link to page 22 link to page 22 link to page 21 Frequently Asked Questions About Prescription Drug Pricing and Policy
Medicaid and Medicare Part D. CBO also found a wide range of prices for specialty drugs. The CBO report builds on previous studies, including a 2015 HHS OIG report, which found that to a 2015 HHS Office of Inspector General report, Medicaid rebates were equal to 47% of Medicaid spending in 2012, while rebates made up a smaller 15% of Part D spending that same year.4953 Medicaid rebates for some drugs were more than 10 times larger than Part D rebates for the same products. Members of Congress have introduced legislation to give the HHS Secretary more power to negotiate Medicare Part D drug prices. (See "“Can the HHS Secretary Negotiate Medicare Part D Drug Prices?," below.)
Following is a table that ”)
Table 2 outlines prescription purchasing systems for four federal health care programs: Medicare Part D, Medicare Part B, Medicaid, and the Veterans Health Administration health system.50 (See Table 2.) 54 These programs were chosen because they are among the largest federal health programs. The table is not a complete list of federal prescription drug coverage.
Table 2. Selected Federal Programs Providing Prescription Drug Coverage
(overview of drug purchasing and payment methods by government programs)
|
Medicare
Medicare Part D is a voluntary drug benefit offered through private health care plans that
Part D
contract with HHS. The Part D program relies on market competition to limit spending. Plan sponsors, which compete for enrollees, negotiate rebates, discounts, and other price concessions with manufacturers. The ACA amended Part D to require additional price discounts from manufacturers. |
| , according to available data.a
Medicare
Medicare Part B covers physician services and durable medical equipment, as well injectable or
Part B
intravenous drugs administered as part of a service in a doctor |
|
Medicaid |
Medicaid is a federal-state entitlement program that pays for health care services on behalf of certain low-income |
|
Veterans Health Administration |
340B program.d
Veterans
The Department of Veterans Affairs (VA) through the Veterans Health Administration (VHA)
Health
operates the nation |
Source: CRS Analysis of federal agency information, including contracts, and federal statutes.
Notes: ACA = Patient Protection and Affordable Care Act (P.L. 111-148, as amended); CMS = Centers for Medicare & Medicaid Services; HHS = Department of Health and Human Services.
a. CMS, "“Coverage Gap Discount Program,"” at http://www.cms.gov/Medicare/Medicare-Advantage/Plan-
Payment/CGDP.html. The Bipartisan Budget Act of 2018, P.L. 115-123, increased the manufacturer discount.
b.
b. See CRS Report R40425, Medicare Primer.
c. See CRS Report R43778, Medicaid Prescription Drug Pricing and Policy.
d. Ibid. Under the 340B program, manufacturers agree to provide outpatient drugs to covered entities,
including qualifying hospitals, at significantly reduced prices.
e.
e. See CRS Report R42747, Health Care for Veterans: Answers to Frequently Asked Questions.
Can the HHS Secretary Negotiate Medicare Part D Drug Prices?
Congress designed Medicare Part D as a market-oriented program in which commercial health payers compete for enrollees based on the price and scope of their drug coverage.5155 Part D plan sponsors, which include health plans, unions, employers, and PBMspharmacy benefit managers (PBMs), negotiate drug rebates and discounts with manufacturers and contract with retail pharmacies to dispense drugs to Part D enrollees at set reimbursement rates.52
56
To bolster market competition, the Medicare Prescription Drug, Improvement, and Modernization Act of 2003 (MMA; P.L. 108-173), which created Medicare Part D, contains a "“noninterference provision."53”57 This provision prohibits the HHS Secretary (Secretary) from intervening in negotiations between Part D plan sponsors, drug manufacturers, and pharmacies or from requiring a specific Part D formulary.54
58
In the years since Part D was enacted, Congress has debated whether the market-based model has been effective in controlling drug prices and enrollee costs. Proponents of the current approach point out that program spending to date has been well below initial budget projections.55 Total Part D drug rebates have risen from 9.6% of annual Part D drug spending in 2007, the second year the program was in effect, and is forecast to be 24% in 2018.56 Further, a 2014 Congressional Budget Office (CBO) study found that Part D premiums were lower in areas of the country where there was the most robust competition among Part D plans.57
However, CBO also has found that Part D plans have higher average drug prices than the Medicaid program, which imposes mandatory federal drug rebates.58 Separate studies by the HHS Office of Inspector General and the Government Accountability Office likewise have found that Medicaid secures lower drug prices than Part D.59
Some lawmakers have proposed modifyingPart D plan sponsors have been successful in increasing drug rebates. Part D direct and indirect remuneration (which consists mainly of prescription drug rebates but also includes other remuneration that affects net drug prices, such as certain pharmacy fees) rose from 11.1% of total Part D drug costs in 2008 to an estimated 28.4% in 2020.59 However, HHS, the Medicare Payment Advisory Commission
55 Part D plans must provide coverage that is at least equivalent to a set standard benefit, which is set and updated annually by HHS. Part D plans also may offer more generous coverage.
56 CRS Report R40611, Medicare Part D Prescription Drug Benefit. Unions and employers may sponsor special Part D Employee Group Waiver Plans to provide retiree drug coverage.
57 The noninterference provision is§1860D-11(i) of the Social Security Act. The actual wording of the noninterference provision states, “In order to promote competition under this part and in carrying out this part, the Secretary (1) may not interfere with the negotiations between drug manufacturers and pharmacies and PDP sponsors; and (2) may not require a particular formulary or institute a price structure for the reimbursement of covered Part D drugs.” A PDP is a stand-alone Part D drug plan. Medicare beneficiaries also may obtain Part D benefits as part of a Medicare Advantage plan, or an MA-PD.
58 Although Part D does not have a central formulary, Part D plans are required to cover at least two distinct drugs in each class and category, as defined by U.S. Pharmacopeial Convention (USP), an independent scientific organization, or a like organization. In addition, all Part D plans must cover substantially all drugs in six protected classes: immunosuppressant, antidepressant, antipsychotic, anticonvulsant, antiretroviral, and antineoplastic.
59 CMS, “The 2020 Annual Report of the Boards of Trustees of the Federal Hospital Insurance and Federal
Congressional Research Service
18
Frequently Asked Questions About Prescription Drug Pricing and Policy
(MedPAC) and other analysts say the higher rebates may not be indicative of successful price negotiations. Manufacturers have continued to increase list prices or set high list prices for brand-name drugs in Part D. Rebates have grown, but not as fast as prices, and the gap between Part D reimbursement for brand-name drugs and total rebates to plan sponsors has increased. For example, the HHS OIG found total reimbursement for Part D brand-name drugs, net of rebates, rose 62% from 2011 to 2015, even as the number of brand-name prescriptions fell 17%.60 In addition, a series of studies have found that Part D pays higher average net prices for brand-name drugs than other federal programs.61
Lawmakers have made repeated proposals to repeal or modify the noninterference provision to give the Secretary the authority to negotiate drug prices, saying that Part D drug prices. Supporters of Secretarial negotiation maintain that by leveraging the combined purchasing power of tens of millions of Medicare beneficiaries would allow HHS toPart D enrollees, the Secretary could secure larger discounts and rebates than can be obtained by individual Part D plan sponsors.60 plan sponsors. Opponents note that Part D enrollment is concentrated among a few large insurers that already have substantial bargaining power, and that changing the noninterference provision could result in more limited plan formularies.
In 2007, the House approved H.R. 4, the Medicare Prescription Drug Price Negotiation Act of 2007, which would have allowed the Secretary to negotiate Part D drug prices but not to craft a formulary.61 62 The measure was not approved by the Senate. A CBO analysis said that the bill would produce negligible savings unless the Secretary were given authority to create a central formulary, set prices administratively, or take other regulatory actions against firms that failed to offer price reductions.62 63 A number of patient and consumer groups have opposed proposals to give the Secretary more control of the Part D formulary, contending it could lead to reductions in drug coverage.64
In a May 2019 letter to the Chairman of the Senate Finance Committee regarding Part D price negotiation, CBO continued to conclude that “(n)egotiation is likely to be effective only if it is accompanied by some source of pressure on drug manufacturers ... providing broad negotiating
Supplementary Medical Insurance Trust Funds,” April 22, 2020, Table IV.B8, p. 142, at https://www.cms.gov/files/document/2020-medicare-trustees-report.pdf. Direct and Indirect Remuneration (DIR) is an accounting system that Part D plans use to report to CMS all prescription drug price concessions that take place after the point of sale. Rebates are the vast majority of reported DIR, but various Part D plan sponsor-imposed fees on pharmacies have been growing rapidly.
60 HHS OIG, “Increases in Reimbursement for Brand-Name Drugs in Part D,” June 2018, https://oig.hhs.gov/oei/reports/oei-03-15-00080.asp.
61 CBO, “A Comparison of Brand-Name Drug Prices Among Selected Federal Programs,” February 18, 2021, https://www.cbo.gov/publication/56978; “Prices for and Spending on Specialty Drugs in Medicare Part D and Medicaid,” June 2018, https://www.cbo.gov/publication/53929; and “Competition and the Costs of Medicare’s Prescription Drug Program,” July 2014, p. 29, at https://www.cbo.gov/sites/default/files/113th-congress-2013-2014/reports/45552-PartD.pdf. See also HHS OIG, “Medicaid Rebates for Brand-Name Drugs Exceeded Part D Rebates by a Substantial Margin,” April 2015, at http://oig.hhs.gov/oei/reports/oei-03-13-00650.pdf; and Government Accountability Office, “Comparison of DOD, Medicaid, and Part D Retail Reimbursement Prices,” June 2014, at http://www.gao.gov/assets/670/664521.pdf.
62 The House passed the measure by a vote of 255-170 on January 12, 2007. See http://clerk.house.gov/evs/2007/roll023.xml. For a text of the bill, see https://www.congress.gov/bill/110th-congress/house-bill/4/text.
63 CBO Letter to Rep. John Dingell, January 10, 2007, at https://www.cbo.gov/sites/default/files/cbofiles/ftpdocs/77xx/doc7722/hr4.pdf. See also CBO letter to Senator Ron Wyden, April 10, 2007, at https://www.cbo.gov/sites/default/files/110th-congress-2007-2008/reports/drugpricenegotiation.pdf.
64 Letter to Congress from Coalition of Consumer and Health Care Groups, March 18, 2013, at http://www.nam.org/Issues/Health-Care/Letter-to-Congress-to-Protect-Medicare-Part-D(1)/. See also https://www.cbo.gov/sites/default/files/110th-congress-2007-2008/costestimate/s30.pdf.
Congressional Research Service
19
Frequently Asked Questions About Prescription Drug Pricing and Policy
authority by itself would likely have a negligible effect on federal spending.” 65 CBO indicated that the Secretary might achieve savings by negotiating prices for select drugs, such as those with no close substitutes or with relatively high prices that are needed to address a public health emergency; however, such negotiations may have only a modest impact on federal spending.
During the 116th and 117th Congresses, a number of bills were introduced to allow the Secretary to negotiate Part D drug prices. The bills have varied widely in approach. Some would retain noninterference provision language barring a central Part D formulary, while others would repeal the entire noninterference opening the way for the Secretary to take a more active role in setting plan formularies. Some bills were prescriptive regarding possible price negotiation, such as directing the Secretary to prioritize negotiations on Part D drugs with the highest cost, the largest price increase, or the least market competition.
Still another approach has been to set fallback pricing and/or penalties to be triggered if the Secretary and manufacturers could not reach agreement. Examples include basing Part D prices on (1) prices charged to the VHA, (2) prices in selected industrialized nations, or (3) Medicaid’s best price, which is the lowest price that a manufacturer offers to a U.S. buyer. One bill using fallback pricing and penalties, H.R. 3, would require the Secretary to negotiate prices for certain single-source drugs in Part D and commercial plans, which could not exceed a benchmark based on prices in six countries.66 Manufacturers would be subject to an excise tax on drug sales if they declined to negotiate or failed to agree on a price. CBO estimated this approach would result in significant changes in drug prices and reductions in federal spending.67
coverage.63
During recent sessions of Congress, lawmakers introduced a variety of bills to modify the noninterference provision.64 The Obama Administration also recommended giving the Secretary authority to negotiate prices for Medicare Part D high-cost and biologic drugs, although the proposals were not scored as producing cost savings.65 The Trump Administration has recommended additional approaches, including requiring Part D plans to pass on more negotiated drug rebates to enrollees at the point of sale and moving some Part B-covered drugs to Part D, based on the idea that Part D plans would be able to negotiate lower prices for the products.66
In a similar vein, lawmakers have introduced legislation to apply some of Medicaid's mandatory rebates to Part D drugs prescribed for low-income enrollees.67 CBO has said that such a policy could lower the cost of Part D brand-name drugs in the first decade after the policy was adopted. Savings could erode over time as drug manufacturers raised prices to counteract the rebates. CBO also said the change could reduce the incentive for manufacturers to invest in research and development.68
What Are U.S. States Doing to Address Drug Costs?
What Are U.S. States Doing to Address Drug Costs? State governments play an active role in regulating prescription drug use and pricing. States are the main regulators of health insurance, administer and fund Medicaid jointly with the federal government, and offer health insurance plans to state employees. Some states have their own patient assistance programs that provide free prescription drugs to low-income residents.
States are using various approaches to address prescription drug spending and access, with a focus on limiting spending for high-priced drugsincluding passing laws to allow for importation of drugs from abroad, limiting consumer cost-sharing for high-priced drugs, and requiring transparency in drug pricing by requiring manufacturers to justify drug price increases or provide data about research, advertising and other costs.68 States are also imposing additional regulation on pharmacy benefit managers, such as requiring them to register with the state as third party benefit administrators; prohibiting so-called gag clauses in pharmacy contracts with PBMs that bar pharmacists from telling consumers about less expensive options for filling a prescription; and making public PBM bids for services to provide more transparency.69
65 CBO, “Effects of Drug Price Negotiation Stemming From Title 1 of H.R. 3, the Lower Drug Costs Now Act of 2019, on Spending and Revenues Related to Part D of Medicare,” October 11, 2019. https://www.cbo.gov/publication/55722.
66 An earlier version of H.R. 3 passed in the House in December 2019. The bill was reintroduced in the 117th Congress. 67 For spending estimate, see CBO, H.R. 3, Elijah E. Cummings Lower Drug Costs Now Act, December 6, 2019, https://www.cbo.gov/publication/55936.
68 For directories of state legislation on prescription drugs, see National Conference of State Legislatures, “Prescription Drug Policy Research Center,” http://www.ncsl.org/research/health/ncsl-prescription-drug-policy-resources-center.aspx; and Deloitte, “State Drug Pricing Policies: Drug Companies and PBMs Should Prepare for Continued Activity,” July 16, 2020, https://www2.deloitte.com/us/en/insights/industry/life-sciences/state-drug-pricing-legislation.html.
69 LaVita Tuff, “Trending Now: State Legislation that Bans Pharmacy Benefit Managers’ ‘Gag Clauses,’” National
Congressional Research Service
20
link to page 41 link to page 26 Frequently Asked Questions About Prescription Drug Pricing and Policy
For example, in 2016 and requiring transparency in drug prices.69 A 2015 California statute sets a $250 cap on cost sharing for a 30-day supply of drugs for enrollees in individual and small-group plans.70 Similar laws have been passed in Delaware and other states.71 In 2016, Vermont approved a first-in-the nation law requiring manufacturer disclosure for drugs that underwent large percentage price increases.72 .70 Each year, this law requires state regulators to compile a list of 15 drugs used by Vermont residents that experience the largest annual price increases. Manufacturers will beare required to justify the price increase to the state attorney general. The idea behind the Vermont act, and similar bills, is to force drug companies to justify prices, based on costs.
justify prices, based on costs. Another type of legislation gaining traction in state legislatures prohibits so-called gag clauses in pharmacy contracts with PBMs that bar pharmacists from telling consumers about less expensive options for filling a prescription.73
Maine in 2013 enacted a law allowing its citizens to import prescription drugs from Canada, New Zealand, Australia, and the United Kingdom. A federal district court ruled the law unconstitutional in 2015.74 (See "71 Six states have laws that would allow for importation of drugs through state-run drug wholesaling operations.72 (See “May U.S. Consumers Import Drugs from Abroad?," below.)
” for information on federal policy.) Is U.S. Prescription Drug Spending Higher Than in Other Nations?
The United States spends more for prescription drugs than other industrialized nations, as measured by both total spending and spending per person. The U.S. share of global drug spending was estimated at about 34% in 2016 and is projected to rise to about 4541% in 20212019, according to one forecast.7573 By comparison, the top five European nations combined are projected to account for 12%-1314% of global drug spending by 2021.76
in 2019.74
Similarly, a study by the Organisation for Economic Co-operation and Development (OECD) found that U.S. per capita spending for retail prescription drugs was $1,162 in 2015220 in 2017, compared to the OECD average of $553564. U.S. spending was higher than spending in any of the other 30 industrialized nations examined.77 75 (See Figure 7.)
Academy for State Health Policy, January 30, 2018, at https://nashp.org/trending-now-state-legislation-that-bans-pharmacy-benefit-managers-gag-clauses/. See also from the National Academy for State Health Policy: “States Save on Rx Spending by Using Reverse Auctions for Pharmacy Benefit Manager Service Procurement,” August 24, 2020, https://www.nashp.org/states-save-on-rx-spending-by-using-reverse-auctions-for-pharmacy-benefit-manager-service-procurement/; “2020 State Legislative Action to Lower Pharmaceutical Costs,” updated December 8, 2020, https://www.nashp.org/rx-legislative-tracker/; and State Drug Pricing Laws: 2017-2020, updated December 3, 2020, https://www.nashp.org/rx-laws/. There are also recent federal laws banning gag clauses in Medicare and commercial insurance: P.L. 115-262 and P.L. 115-263.
70 Ed Silverman, “Vermont Becomes First State to Require Drug Makers to Justify Price Hikes,” Pharmalot/ STAT, June 6, 2016, at https://www.statnews.com/pharmalot/2016/06/06/vermont-drug-prices-transparency/. See also http://legislature.vermont.gov/bill/status/2016/S.216. The law directs the state to identify up to 15 prescription drugs annually on which the state spends significant health care dollars and for which the wholesale acquisition cost has increased by 50% or more over the previous five years, or by 15% or more over the previous 12 months.
71 Eric Russell, “Judge Strikes Down Maine Law Allowing Residents to Buy Drugs from Foreign Pharmacies,” Portland Press Herald, February 25, 2015, at http://www.pressherald.com/2015/02/24/maine-residents-cant-order-drugs-from-foreign-pharmacies-judge-rules/. See also State of Maine, An Act to Facilitate the Personal Importation of Prescription Drugs from International Mail Order Prescription Pharmacies, at http://www.mainelegislature.org/legis/bills/getPDF.asp?paper=SP0060&item=4&snum=126.
72 National Academy for State Health Policy, “With Federal Rule Issued, States Advance Prescription Drug Importation Programs,” October 19, 2020, https://www.nashp.org/with-federal-rule-issued-states-advance-prescription-drug-importation-programs/.
73 IQVIA, Global Medicine Spending and Usage Trends, March 2020, at https://www.iqvia.com/insights/the-iqvia-institute/reports/global-medicine-spending-and-usage-trends. The data include drugs dispensed in retail pharmacies and drugs used in hospital or clinic settings. Adoption of specialty medicines is driving spending increases globally as well, with such products account for 36% of global spending.
74 Ibid. 75 Organisation for Economic Co-operation and Development (OECD), Health at a Glance 2017, Chapter 10, at https://www.oecd-ilibrary.org/docserver/4dd50c09-en.pdf?expires=1614023061&id=id&accname=ocid195520&
Congressional Research Service
21
Frequently Asked Questions About Prescription Drug Pricing and Policy
Other studies have found large differences in the price for specific drugs in the United States and other countries.76 In one recent study, researchers at the University of Liverpool examined a class of cancer drugs known as tyrosine kinase inhibitors and found that the U.S. price in most cases was at least double that charged in the European Union (EU).78
77
Academic studies have posited a number of reasons for the higher U.S. spending and prices. These reasons include the faster adoption of breakthrough, or newly introduced, drugs in the United States and patent and other protections that give U.S. manufacturers market exclusivity during the early years a product is on the market.79
78
Another difference is that OECD countries may operate government-run health care systems that are the main purchasers of drugs and that set price limits for the products they buy. Most EU nations use external reference pricing, defined by the European Commission as using the price of a medicine in one or several countries to derive a benchmark, or reference price, for setting or negotiating the price of that medicine in another country.80
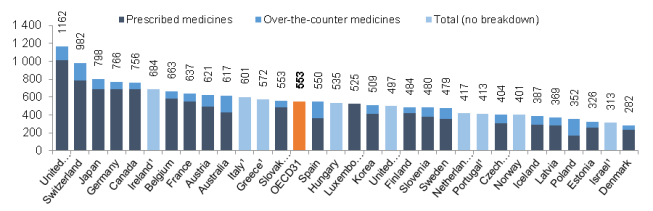
National health programs may use value-based pricing, which bases payment for a drug on evidence of its effectiveness or therapeutic value.8180 In Canada, the Common Drug Review assesses the clinical and economic effectiveness of new drugs and of existing drugs approved for new uses.8281 The assessments are passed on to federal, territorial, and provincial drug plans to use in setting reimbursement.
U.S. government and commercial payers are experimenting experimenting with alternative forms of pricing. For example, Harvard Pilgrim Health Care, a regional private health insurer, in June 2016 announced a deal with drugmakers Novartis and Eli Lilly has announced deals with pharmaceutical firms under which the insurer will receive discounts if certain drugs do not meet specified goals for improving health or reducing hospitalizations.8382 CMS has encouraged state Medicaid programs to move toward value-based purchasing and has offered guidance on addressing some associated technical issues.84
83 There are questions about how far outcomes-based pricing can go in addressing drug price issues given difficulties in negotiating and administering such systems.84
The Institute for Clinical and Economic Review (ICER), a private research organization, is producing public reports on the comparative effectiveness, cost-effectiveness, and potential budget impact of drugs that are newly approved by FDA.85
Pharmaceutical Development and Marketing
How Much Does Publicly Funded Research Contribute to Drug Development? In general, federally funded biomedical research tends to focus more on the early stages of drug development, including basic or preclinical research conducted or supported by the National Institutes of Health (NIH). In contrast, the pharmaceutical industry tends to concentrate more of its research funding on late-stage drug development, such as clinical trials, rather than on early-stage research activity.86 When trying to assign credit for specific therapeutic advancements,
80 Vallerie Paris and Annalisa Belloni, “Value in Pharmaceutical Pricing,” OECD Health Working Papers, No. 63, 2013, at http://dx.doi.org/10.1787/5k43jc9v6knx-en.
81 CADTH Common Drug Review (CDR), at https://www.cadth.ca/about-cadth/what-we-do/products-services/cdr. 82 Harris Meyer, “As a Cure for High Drug Prices, Outcomes-Based Deals Aren't Delivering Yet,” Modern Healthcare, March 23, 2019, https://www.modernhealthcare.com/insurance/cure-high-drug-prices-outcomes-based-deals-arent-delivering-yet.
83 CMS, “Medicaid Drug Rebate Program Notice,” Release No. 99, July 14, 2016, at https://www.medicaid.gov/Medicaid-CHIP-Program-Information/By-Topics/Prescription-Drugs/Downloads/Rx-Releases/MFR-Releases/mfr-rel-099.pdf. Also see John Armstrong and Colleen Becker, “Value-based Pricing to Address Drug Costs,” Legis Brief, National Conference of State Legislatures, vol. 27, no. 15, April 2019, https://www.ncsl.org/research/health/value-based-pricing-to-address-drug-costs.aspx.
84 Harris Meyer, “As a cure for high drug prices, outcomes-based deals aren't delivering yet,” Modern Healthcare, March 23, 2019, https://www.modernhealthcare.com/insurance/cure-high-drug-prices-outcomes-based-deals-arent-delivering-yet.
85 Institute for Clinical and Economic Review (ICER), https://icer.org/. 86 Hamilton Moses et al., “The Anatomy of Medical Research: U.S. and International Comparisons,” Journal of the American Medical Association, vol. 313, no. 2 (January 13, 2015), pp. 174-189.
Congressional Research Service
23
Frequently Asked Questions About Prescription Drug Pricing and Policy
drawing a line between basic and applied research can be challenging. For example, without major underlying basic scientific advances, such as recombinant DNA technology, the development of whole new classes of drugs would not have taken place. 87
Although the line can blur, public sector contributions to new drugs can generally be categorized as direct or indirect. Public funding directly contributes to drug development when publicly funded scientists—either through intramural or extramural research88—develop a chemical compound or other invention specific to a particular drug. The intellectual property arrangements for these direct contributions to new drugs vary based on (1) the applicable laws and policies, (2) the nature of the funding or other agreement between the federal agency and the research institution, (3) whether the intellectual contribution is patentable, and (4) the research institution’s decision to patent the invention, among other factors.89 Because of these factors, publicly funded researchers do not always seek or hold patents to the inventions they develop.90 Government agencies also fund some clinical research (mostly early stage clinical trials) on new or existing drugs to assess their safety and effectiveness for purposes of FDA approval, but typically do not actually apply for FDA approval of the drug.91 In recent years, federal agencies and public research institutions have engaged in an increasing number of public-private research partnerships to facilitate the development of new drugs—most visibly during the COVID-19 pandemic. These partnerships further complicate the assessment of public sector contributions to new drugs, as they involve combined efforts by both the public and private sectors to jointly develop new drugs.92
Since much of federal medical and health research funding supports basic research on fundamental mechanisms of biology and behavior (rather than applied research on specific products), much of publicly funded research generates scientific knowledge that indirectly aids in drug development.93 NIH-funded research can lead to innovations in fundamental science that enable the development of new types of drugs. Federal science agencies also support the education and training of some biomedical scientists who then work for the pharmaceutical industry. It is difficult to assess and measure the indirect contribution of federal research and
87 Recombinant DNA technology is the joining of DNA molecules from different sources in a host organism to produce a new genetic combination. Publicly funded research played an instrumental role in the development of recombinant DNA beginning in the 1970s. See Rajendra K. Bera, “The Story of the Cohen-Boyer Patents,” Current Science, vol. 96, no. 6 (March 2009), pp. 760-763.
88 An example of intramural research is research performed by federal NIH scientists in the NIH-operated laboratories and Clinical Center. An example of extramural research is research performed by nonfederal scientists using NIH grant or contract funding.
89 CRS Legal Sidebar LSB10422, COVID-19 Medical Countermeasures: Intellectual Property and Affordability. 90 Rahul K Nayak, Jerry Avorn, and Aaron S. Kesselheim, “Public Sector Financial Support for Late-Stage Discovery of New Drugs in the United States,” The BMJ, vol. 367, no. 15766 (September 23, 2019).
91 Gillian K. Gresham, Stephan Ehrhardt, and Jill L Meinhert, “Characteristics and Trends of Clinical Trials Funded by the National Institutes of Health Between 2005 and 2015,” Clinical Trials, vol. 15, no. 1 (2018), pp. 65-74.
92 CRS Report R46427, Development and Regulation of Medical Countermeasures for COVID-19 (Vaccines, Diagnostics, and Treatments): Frequently Asked Questions, and section on “Public-Private Partnerships” in CRS Report R41705, The National Institutes of Health (NIH): Background and Congressional Issues.
93 CRS Report R46341, Federal Research and Development (R&D) Funding: FY2021, and GAO, Drug Industry: Profits, Research and Development Spending, and Merger and Acquisition Deals, GAO-18-40, November 2017, pp. 34-37, https://www.gao.gov/assets/gao-18-40.pdf. Specifically, GAO reported that “federal spending consistently funded a greater amount of basic research…. NIH obligated 54 percent, or $13.6 billion of its total $25 billion of drug related spending, for basic research in fiscal year 2014. This is more than twice as much as the $6.3 billion that the NSF [National Science Foundation] data show pharmaceutical companies reported spending domestically for basic research that year.”
Congressional Research Service
24
Frequently Asked Questions About Prescription Drug Pricing and Policy
training to new drugs, though several studies have found that it is greater than the direct contribution of public research funding to drug development.94
Various studies have attempted to quantify the contribution of publicly funded research to the discovery of new drugs. Studies have characterized these contributions in several ways, including by quantifying (1) the number of FDA-approved drugs that are developed relying on federally owned or licensed intellectual property, (2) the number of drugs developed with key intellectual property or contributions from publicly funded research, (3) the contribution of publicly funded research to certain “innovative” drugs as defined in the studies, or (4) the total effect of public research funding on pharmaceutical drug development. These studies characterize publicly funded research differently—some focus on NIH funding (the largest government biomedical research agency in the United States and the world), others focus on all federally funded research, while others account for publicly funded research more broadly (e.g., funded by the philanthropic sector, foreign government agencies, and state governments). In summary, available research shows that a fraction (9%-25%) of new drugs approved by FDA in recent decades are based on patents or specific intellectual contributions of publicly funded researchers. Some studies find that drugs developed with public support tend to be more innovative and/or have a greater therapeutic impact (as defined by the researchers) than those drugs developed solely by the private sector. When accounting for broader indirect scientific contributions to new drugs, virtually all FDA-approved drugs are associated with NIH-funded research.
Federal intellectual property. For scientists and researchers employed by federal agencies (i.e., those conducting intramural research), federal law authorizes federal agencies to apply for patents and to grant licenses for inventions developed in the course of federal research.95 While federal agencies, such as NIH, maintain websites and reports on their intellectual property broadly, commentators have noted a lack of consolidated and complete information by federal agencies about patents held by federal agencies specific to pharmaceutical drugs.96 In October 2020, the Government Accountability Office (GAO) reported on NIH’s licensing of its intramural inventions. GAO found that “NIH provides limited information to the public about its licensing activities.” Based on an analysis of patents owned by HHS (NIH’s parent department), GAO found that HHS-funded research had led to 4,446 patents between 1980 through 2019, of which NIH had 93 patents (2%) that contributed to the successful development and FDA approval of 34 drugs. These 34 drugs were developed by drug companies and were associated with 32 NIH-granted licenses. GAO recommended that NIH make information about licensing of its inventions more publicly available; NIH concurred with the recommendation and committed to developing a plan for greater transparency of its licensed inventions.97
Drugs with patents or key intellectual contributions from publicly funded research. For extramural research or federal partnerships through a funding or other agreement (e.g., a grant or contract), several laws allow for nonfederal institutions to seek and gain primary ownership of
94 See section on “Publicly Funded Research and Pharmaceutical Drug Development” in CRS Report R41705, The National Institutes of Health (NIH): Background and Congressional Issues.
95 35 U.S.C. §§ 207-209. 96 For federal agency information, see NIH Office of Intramural Research Office of Technology Transfer, “Reports/Stats,” https://www.ott.nih.gov/ and National Institute of Standards and Technology (NIST), “Federal Laboratory (Interagency) Technology Transfer Summary Reports,” nist.gov/tpo/reports-and-publications/annual-reports. Commentary on transparency around drug patents: Arti K. Rai and Bhaven N. Sampat, “Accountability in Patenting of Federally Funded Research,” Nature Biotechnology, vol. 30 (10 2012), pp. 953-956.
97 U.S. Government Accountability Office, Biomedical Research: NIH Should Publicly Report More Information about the Licensing of its Intellectual Property, GAO-21-52, November 20, 2020, https://www.gao.gov/products/GAO-21-52.
Congressional Research Service
25
link to page 30 Frequently Asked Questions About Prescription Drug Pricing and Policy
patents to inventions developed in the course of federally funded or supported research.98 Given that much of federal health research funding is extramural, patents or inventions held by extramural research institutions account for a greater share of public sector inventions used in pharmaceutical drugs than those held by federal agencies discussed above. Various studies have sought to measure and characterize the number of new drugs that originated from or were invented through publicly funded research (including both intramural and extramural federal research as well as nonfederal public research, depending on the study). Some studies have focused on drugs covered by patents held by publicly funded research institutions. Other studies sought to characterize critical intellectual contributions to new drugs beyond patents—particularly to account for issues with underreporting of government funding on patent information or because publicly funded researchers do not always seek patents for inventions derived from their research, among other factors.99
Table 3 provides an overview of five studies that assessed direct contributions of public sector research institutions to new pharmaceutical drugs—mostly in the form of patents—but some also accounted for other direct involvement in development or discovery of a specific drug.100 Most of the studies focused on new molecular entities (NMEs, i.e., new chemical compounds that FDA had not previously approved) approved by FDA within the study period, though the Stevens et al. study also explored all FDA-approvals (e.g., existing drugs for new clinical indications or uses). In summary, the studies generally show that when looking at mostly patents, about 9%-14% of drugs approved in recent decades (the percentage varies by time period and definition used) involve a patent or other critical intellectual property linked to a public sector research institution or publicly funded researcher, as shown in the Sampat and Lichtenberg (2011), Stevens et al., (2011), Long (2019), and Clearly et al. (2020) studies. When looking more broadly, as in the Nayak et al. (2019) study, about 25% of all FDA-approved drugs in recent decades were developed with public sector contributions (accounting for “spin-off” companies based on public sector research). The studies use different definitions for public sector research, characterizations of public sector research contributions to new drugs, and time periods; therefore, the studies are not directly comparable.
Table 3. Findings from Studies on Direct Public Sector Contributions to New Drugs
Presented in order of publication date
Definition of “Public
Time Period and
Sector Research
Drugs Linked to Public
Study
Selection Criteria
Contribution” Used
Sector Contribution
Sampat and Lichtenberg,
Drugs approved
Patents assigned to a
34 out of 379 (9.0%) new
2011
from1988 to 2005
government agency or
molecular entities (NME)
with government interest
approved by FDA.
statements (public sector patent).
98 CRS Legal Sidebar LSB10422, COVID-19 Medical Countermeasures: Intellectual Property and Affordability. 99 Arti K. Rai and Bhaven N. Sampat, “Accountability in Patenting of Federally Funded Research,” Nature Biotechnology, vol. 30 (10 2012), pp. 953-956, and Rahul K Nayak, Jerry Avorn, and Aaron S. Kesselheim, “Public Sector Financial Support for Late-Stage Discovery of New Drugs in the United States,” The BMJ, vol. 367, no. 15766 (September 23, 2019).
100 These studies were identified through a CRS literature review. They are shown to reflect findings based on different study methodologies, but may not comprehensively reflect all relevant studies.
Congressional Research Service
26
Frequently Asked Questions About Prescription Drug Pricing and Policy
Definition of “Public
Time Period and
Sector Research
Drugs Linked to Public
Study
Selection Criteria
Contribution” Used
Sector Contribution
Stevens et al., 2011
Drugs approved from
Public sector research
143 out of 1541 (9.3%) of
1990 to 2007
institution (universities,
all FDA-approved drugs.
research hospitals, etc.)
solely or jointly created intellectual property
64 of 483 (13.6%) of
specific to the drug,
NMEs.
mostly but not entirely in the form of patents.
Long, 2019
Top-selling drugs in the
Top-selling drugs from
20 of 197 (10.2%) of top-
United States from 2013
2013-2017 (based on
selling drugs (2013-2017)
to 2017 (based on sales
sales data) assigned to
with patents listed in the
data)
government agency or
Annual Editions of the
government interest
FDA Orange Book for the
statement
period of 1985–2016.
Nayak et al., 2019
Drugs approved from
Major research
48 of 248 (19%) of FDA-
2008 to 2017
contribution in late stage
approved drugs containing
of development: public
NMEs had major public
sector patent, or late
sector research
stage development
contributions late in
occurred in public sector
development.
research based on analysis
of development history. Also included drugs
14 of 248 (6%) were
developed in “spin-off”
developed by spin-off
companies that originated
companies based “wholly
from public sector
or in part” on publicly
research.
supported research.
Cleary et al., 2020 [pre-
Drugs approved from
Drugs with patents listed
27 of 256 (8.7%) of FDA-
print]
2010 to 2019
in FDA’s Orange Book
approved drugs containing
associated with NIH-
NMEs.
funded projects and acknowledged in publications on the NME or biological target.
Source: Bhaven B. Sampat and Frank R. Lichtenberg, “What are the Respective Roles of the Public and Private Sectors in Pharmaceutical Innovation?,” Health Affairs, vol. 30, no. 2 (2011), pp. 332-339; Ashley J. Stevens, Jonathan J. Jensen, and Katrine Wyller, “The Role of Public-Sector Research in the Discovery of Drugs and
Vaccines,” New England Journal of Medicine, vol. 364 (February 2011), pp. 535-541; Genia Long, "Federal Government-Interest Patent Disclosures,“ Journal of Medical Economics, vol. 22, no. 12 (2019), pp. 1261-67; Rahul K Nayak, Jerry Avorn, and Aaron S. Kesselheim, “Public Sector Financial Support for Late-Stage Discovery of New Drugs in the United States,” The BMJ, vol. 367, no. 15766 (September 23, 2019); and Ekaterina Galkina Cleary, Matthew J. Jackson, and Fred D. Ledley, “Government as the First Investor in Biopharmaceutical Innovation: 2010-2019,” Institute for New Economic Thinking- Working Papers, August 5, 2020. Notes: The studies use different definitions for public sector research, characterizations of public sector research contributions to new drugs, and time periods; therefore, the studies are not directly comparable.
Public sector contributions to “innovative” drugs. Several studies have focused on the relative contribution of public sector research in developing the most “innovative” subset of drugs, characterized either as drugs that meet a previously unmet medical or health need or that have been determined to have a groundbreaking effect on patient care. For example, several studies explore the proportion of drugs developed by public sector researchers that received FDA priority review—a mechanism for expediting the review of certain drugs that treat serious conditions and
Congressional Research Service
27
link to page 30 Frequently Asked Questions About Prescription Drug Pricing and Policy
would provide a significant improvement in safety or effectiveness.101 The Stevens et al. 2011 study (see Table 3) found that 46% of new drug applications (NDAs) for drugs developed at public sector research institutions from 1990 to 2007 received priority review by the FDA, compared with 20% of NDAs for drugs developed solely by the private sector.102 A 2014 study on the NIH intramural research program found that 94% of drugs licensed by NIH intramural researchers had received FDA priority review (17 NDAs total).103 These studies are consistent with the view that public sector contributions are particularly important for innovative drugs.
Some studies have focused on the public sector’s role in developing a subset of drugs with the greatest health impact. A 2015 study focused solely on the public sector’s role in “transformative” drug development from 1984 to 2009. The researchers defined a transformative drug as both innovative and having a groundbreaking effect on patient care, identified by surveying physicians from the top 30 U.S. academic medical centers. The researchers focused on 21 drugs and five drug classes that were identified as transformative and followed their development history through FDA documents and interviews with scientists and drug developers. The authors found that academic researchers played a central role in developing most of these transformative drugs, often by conceptualizing a therapeutic approach in basic research or by jointly developing the drug with commercial institutions.104
Total direct and indirect contribution of publicly funded research to drug development. Given that much of publicly funded research is basic research that indirectly aids in the development of new drugs, a few studies have aimed to ascertain the total impact of NIH funding on drug development (accounting for both direct and indirect contributions). A 2020 study found that NIH research funding contributed to every NME approved by the FDA from 2010 to 2019. The study determined that the 356 new drugs approved by the FDA, as well as their biological targets, in this time period were associated with a body of research comprising 2 million publications—494,000 of which were supported by NIH. The total NIH funding contribution to this body of research was determined to be $230 billion.105 Another 2019 study used patenting as an economic measure for the impact of NIH research funding on industry productivity from 1980 through 2012. The study determined that NIH investments in a particular research area increase subsequent private-sector patenting: a $10 million increase in NIH funding for a given research area ultimately resulted in 2.7 additional patents. Alternatively phrased, one private-sector patent ultimately results from every two to three NIH grants. Though the authors faced difficulty measuring the economic value of such patents, they stated that “one rough calculation suggests that $1 in NIH funding generates around $2.34 in drug sales.”106
101 FDA, “Expedited Programs for Serious Conditions – Drugs and Biologics,” Guidance for Industry, May 2014, pp. 24-25, https://www.fda.gov/media/86377/download. Specific statutory provisions may qualify drugs for priority review in other cases.
102 Priority review means that FDA aims to take action on an NDA 6 months after filing, compared to 10 months for standard review. Ashley J. Stevens, Jonathan J. Jensen, and Katrine Wyller, “The Role of Public-Sector Research in the Discovery of Drugs and Vaccines,” New England Journal of Medicine, vol. 364 (February 2011), pp. 535-541. 103 Sabarni K. Chatterjee and Mark L. Rohrbaugh, “NIH Inventions Translate to Drugs and Biologics with High Public Health Impact,” Nature Biotechnology, vol. 32, no. 1 (January 2014), pp. 52-58. 104 Aaron S. Kesselheim, Yongtian T. Tian, and Jerry Avorn, “The Roles Of Academia, Rare Diseases, And Repurposing In the Development of The Most Transformative Drugs,” Health Affairs, vol. 34, no. 2 (2015), pp. 286-293.
105 Ekaterina Galkina Cleary, Matthew J. Jackson, and Fred D. Ledley, “Government as the First Investor in Biopharmaceutical Innovation: 2010-2019,” Institute for New Economic Thinking- Working Papers, August 5, 2020.
106 Pierre Azoulay, Joshua S. Graff Zivin, Danielle Li, et al., “Public R&D Investments and Private-Sector Patenting: Evidence from NIH Funding Rules,” Review of Economic Studies, vol. 86 (2019), pp. 117-152.
Congressional Research Service
28
Frequently Asked Questions About Prescription Drug Pricing and Policy
How Much Does It Cost to Develop New Drugs? Although publicly traded pharmaceutical manufacturers release aggregate research and development (R&D) spending information, detailed information about the cost of developing specific drugs is generally not available. Many institutions (academic and nongovernmental organizations) have attempted to estimate the average R&D spending for a single representative FDA-approved drug. Different methodologies for the studies have led to conflicting estimates of drug R&D expenditures at every stage of drug development. Commonly cited estimates include the following:
A 2016 Tufts Center for the Study of Drug Development report, based on
proprietary data on 106 products from 10 large drug manufacturers, estimated that the pretax and preapproval cost of developing an FDA-approved prescription drug was $2.6 billion, which included $1.4 billion in clinical spending and $1.2 billion in time costs (2013 dollars), where time costs were defined as “the cost of the delay between when R&D expenditures are incurred and when returns to the successes can first be realized (date of marketing approval).”107
A 2016 HHS study noted that estimates for new drug development range from
$1.2 billion to $2.6 billion per drug and are highly sensitive to factors such as assumptions about development time, cost of capital, and whether the study includes orphan drugs, which are likely to have smaller trial sizes, higher success rates and which receive special federal tax breaks.108
A 2020 paper from the Journal of the American Medical Association (JAMA)
found that the median capitalized R&D investment was estimated at $985.3 million, and the mean investment was estimated at $1,335.9 million, using publicly available industry financial and clinical trial data. These estimates changed based on the therapeutic area evaluated (e.g., nervous system agents differed from immunomodulating agents). As with the Tufts study, the authors accounted for the costs of failed trials and the time cost for development.109
The different estimates reflect differences in the types of data used and study methodology. They also underscore the difficulty in measuring industry drug development costs. The 2016 estimate from Tufts Center for the Study of Drug Development, a partially industry backed initiative,110
107 Joseph A. DiMasi, Henry G. Gabrowski, and Ronald W. Hansen, “Innovation in the Pharmaceutical Industry: New Estimates of R&D Costs,” Journal of Health Economics, vol. 47 (2016), pp. 20-33. The study was based on data provided by 10 pharmaceutical companies on 106 randomly selected drugs that were first tested in human subjects anywhere in the world from 1995 to 2007. The figure rises to $2.9 billion when FDA-mandated post-approval costs (such as additional testing and monitoring) are added, according to Tufts.
108 HHS, Prescription Drugs: Innovation, Spending and Patient Access, Chapter 2, December 7, 2016, at http://apps.who.int/medicinedocs/en/m/abstract/Js23128en/. Also see FDA “Developing Products for Rare Diseases & Conditions,” at http://www.fda.gov/ForIndustry/DevelopingProductsforRareDiseasesConditions/ucm2005525.htm. 109 Olivia Wouters, Martin McKee, and Jeroen Luyten, “Estimated Research and Development Investment Needed to Bring a New Medicine to Market, 2009-2018,” Journal of the American Medical Association, vol. 323, no. 9 (March 3, 2020), pp. 844-853.
110See Tufts Center for the Study of Drug Development, “Financial Disclosure,” 2021, https://csdd.tufts.edu/financial-disclosure. “The Tufts Center for the Study of Drug Development (Tufts CSDD) at Tufts University School of Medicine is an independent, academic, nonprofit research center. Tufts CSDD receives unrestricted grants from pharmaceutical and biotechnology firms, as well as companies that provide related services to the research-based industry (e.g., contract research, consulting, and technology firms). These grants represent approximately 25% of Tufts CSDD’s operating expenses. The remainder comes from government and foundation support, grants for commissioned projects, registration fees for courses and conferences, and subscription fees for Tufts CSDD publications. Sponsoring
Congressional Research Service
29
Frequently Asked Questions About Prescription Drug Pricing and Policy
used data from 10 manufacturers to estimate R&D spending, based on the manufacturers’ out-of-pocket clinical trial costs of drug development and time costs of development. The former cost is inclusive of the cost of compounds discontinued at any point during animal or human clinical trials (e.g., due to drug failure), while the second cost represents the “cost of the delay between when R&D expenditures are incurred and when returns to the successes can first be realized (date of marketing approval).”111 The 2016 figure is an update of previous studies by the same authors, including a 2002 analysis that estimated the total cost at $1.046 billion, and a 1991 study that estimated the total cost at $415 million (in comparable 2013 dollars). The Tufts group concluded that these increases in R&D costs were due to “increases in the real out-of-pocket costs of development for individual drugs and by much higher failure rates for drugs that are tested in human subjects, but not particularly by changes in development times or the cost-of-capital.” The study indicates that the cost of developing a new drug has risen in the past few decades. Some observers attribute this increase, at least in part, to increased length and costs of both preclinical and clinical research,112 while other researchers have found that length of clinical testing has remained stable over time. For example, Darrow et al. (2020) found that from 1983 through 2017, the time from the authorization of clinical testing to FDA approval remained at approximately eight years.113
Some experts and observers have questioned or critiqued the Tufts study’s estimates, including its assumptions, small sample size, and lack of transparency about data used for analysis.114 Some have additionally criticized the integrity of the estimates given the fact the organization is partially funded by pharmaceutical industry partners, and its estimates are occasionally referenced by pharmaceutical firms to justify drug prices.115 Many also note that the estimates do not account for tax credits and deductions for R&D costs, such as the federal R&D tax credit or the Orphan Drug Tax credit.116 While detailed data on the use of R&D-related tax credits are not available, CRS analysis suggests that it can be significant—resulting in negative tax rates for
companies have no direct access to any of the Tufts Center’s proprietary databases. Whereas sponsoring companies, regulators, academics, and others outside of Tufts CSDD may suggest topics for investigation, the research agenda of Tufts CSDD is set by the group’s director and its research staff.”
111 Joseph A. DiMasi, Henry G. Grabowski, and Ronald W. Hansen, “Innovation in the Pharmaceutical Industry: New Estimates of R&D Costs,” Journal of Health Economics, vol. 47 (2016), pp. 20-33. The study was based on data provided by 10 pharmaceutical companies on 106 randomly selected drugs that were first tested in human subjects anywhere in the world from 1995 to 2007.
112 Stuart O. Schweitzer and Z. John Lu, “Chapter 1: The Industry,” in Pharmaceutical Economics and Policy: Perspectives, Promises, and Problems, 3rd ed. (New York, NY: Oxford University Press, 2018), p. 47.
113 Johnathan Darrow, Jerry Avon, and Aaron Kesselheim, “FDA Approval and Regulation of Pharmaceuticals, 1983-2018,” Journal of the American Medical Association, vol. 323, no. 2 (January 14, 2020), pp. 164-179. 114 Vinay Prasad and Sham Mailankody, “Research and Development Spending to Bring a Single Cancer Drug to Market and Revenues After Approval,” JAMA Intern Med, vol. 177, no. 11 (2017), pp. 1569-1575; Narcyz Ghinea, Wendy Lipworth, and Ian Kerridge, “Propaganda or the Cost of Innovation? Challenging the High Price of New Drugs,” BMJ, March 11, 2016; and Stuart O. Schweitzer and Z. John Lu, “Chapter 1: The Industry,” in Pharmaceutical Economics and Policy: Perspectives, Promises, and Problems, 3rd ed. (New York, NY: Oxford University Press, 2018), p. 47-48.
115 See, for example, New York Times, “$2.6 Billion to Develop a Drug? New Estimate Makes Questionable Assumptions,” press release, November 18, 2014, https://www.nytimes.com/2014/11/19/upshot/calculating-the-real-costs-of-developing-a-new-drug.html.
116 Wendy Lipworth, and Ian Kerridge, “Propaganda or the Cost of Innovation? Challenging the High Price of New Drugs,” BMJ, March 11, 2016, and Aaron E. Carroll, “$2.6 Billion to Develop a Drug? New Estimates Makes Questionable Assumptions,” New York Times, November 18, 2014, https://www.nytimes.com/2014/11/19/upshot/calculating-the-real-costs-of-developing-a-new-drug.html.
Congressional Research Service
30
Frequently Asked Questions About Prescription Drug Pricing and Policy
pharmaceutical manufacturers in some cases.117 A 2017 GAO report also found rising use of both tax credits by the industry in recent years.118
In the more recent 2020 JAMA study, the authors used U.S. Securities and Exchange Commission (SEC) filings, the Drugs@FDA database, and ClinicalTrials.gov, alongside published data on clinical trial success rates to evaluate the mean and median R&D investment to bring a new drug to market.119 The authors noted that SEC filings are not available for “private US drug firms and foreign companies listed on non-US stock exchanges.” Products from these firms were thus excluded from the study estimates. Even if a firm did file with the SEC, however, this did not guarantee precise R&D data. For example, some firms reported aggregate R&D expenditures across all their drug candidates or therapeutic areas, instead of detailing individual drug candidates. An additional data barrier is that “certain companies only started tracking costs at late stages of preclinical development or at the start of phase 1 of development, resulting in an underreporting of preclinical costs.” The authors noted that the combination of these factors most likely led to “an overrepresentation of smaller firms, which may have run leaner operations than larger ones,” and thus may lead to a lower estimate of total development costs. The study authors used statistical methods to try to adjust for these issues.
The 2020 JAMA study noted that differences in its conclusions from previous studies could be explained by “the spectrum of products analyzed, the restricted availability of data in the public domain, and differences in underlying assumptions in the cost calculations.”120 This JAMA study and the Tufts study both point out that difficulties in estimating R&D costs are primarily due to issues of transparency in drug development costs. The Tufts study notes that “some firms were not able to provide full phase cost data for every new drug sampled.” Phase I data in particular was missing most often, compared proportionally with Phase II and III reporting.121 The authors conclude that the result of this data gap is that their “cost estimates are likely to be somewhat conservative.” The JAMA study notes that in addition to SEC reporting issues, not every pharmaceutical firm records “cost” in the same way. For example, some firms choose to include overhead, administrative costs, and preclinical costs in their figures for direct R&D spending, while others separate out two or all of these as distinct line items.122 Still others report “costs associated with licensing deals, drug acquisitions, and collaboration agreements differently,”123 leading to further complications in analysis of industry data and increased likelihood that such analysis will be inconsistent with real values.
117 See CRS Report R44522, A Patent/Innovation Box as a Tax Incentive for Domestic Research and Development, and CRS Report R45186, Issues in International Corporate Taxation: The 2017 Revision (P.L. 115-97).
118 U.S. Government Accountability Office, Drug Industry: Profits, Research and Development Spending, and Merger and Acquisition Deals, GAO-18-40, November 2017, https://www.gao.gov/assets/690/688472.pdf.
119 Olivia Wouters, Martin McKee, and Jeroen Luyten, “Estimated Research and Development Investment Needed to Bring a New Medicine to Market, 2009-2018,” Journal of the American Medical Association, vol. 323, no. 9 (March 3, 2020), pp. 844-853.
120 Ibid. 121 Joseph A. DiMasi, Henry G. Gabrowski, and Ronald W. Hansen, “Innovation in the Pharmaceutical Industry: New Estimates of R&D Costs,” Journal of Health Economics, vol. 47 (2016), pp. 20-33. “[P]hase I cost data were available for 97 of the 106 new drugs in the dataset (92%). Of the 82 compounds in the dataset that had entered phase II, cost data were available for 78 (95%). For phase III, cost data were available for 42 of the 43 compounds that entered the phase (98%).”
122 Olivia Wouters, Martin McKee, and Jeroen Luyten, “Estimated Research and Development Investment Needed to Bring a New Medicine to Market, 2009-2018,” Journal of the American Medical Association, vol. 323, no. 9 (March 3, 2020), pp. 844-853.
123 Ibid.
Congressional Research Service
31
Frequently Asked Questions About Prescription Drug Pricing and Policy
A 2017 report by GAO examined aggregate pharmaceutical industry spending on R&D. This report found that on average, R&D spending by the entire industry increased from 2008 to 2014. This increase represented an 8% change, from $82 billion to $89 billion, respectively.124 At the same time as spending on R&D increased, however, the amount of R&D conducted within individual firms fell, and the amount of R&D paid for by the company and conducted by others (“purchased R&D services”)125 increased. Many of the pharmaceutical firms surveyed in this report described a decrease over time in NIH spending on biomedical research as one of the driving factors of increasing development costs.126 A 2021 Congressional Budget Office (CBO) publication also examined pharmaceutical industry spending on R&D, and found that in 2019 this number was $83 billion.127 This report indicates this number is nearly a 10 times real dollar value increase from the 1980 value. This change was accompanied by increases in the share of manufacturer revenue invested back into R&D and an increase in the number of new drugs approved by the FDA.
Transparency and more standardized accounting and reporting practices could allow for a better understanding of industry R&D spending to develop new drugs. Legislation has in the past been proposed to require detailed manufacturer reporting of pharmaceutical R&D,128 but it is unclear how successful such efforts could be. As such, Congress may consider additional legislative action directed toward increasing transparency in pharmaceutical firm reporting. Congress may also consider specifying what costs should and should not be included in R&D figures reported in SEC filings, so that reporting may be uniform across pharmaceutical firms.
Is There a Relationship Between Development Costs and Drug Prices? Many analyses have noted the lack of a relationship between the cost to develop a specific drug and its price.129 Some experts contend there is strong economic evidence that drug prices are primarily influenced by demand-side factors—such as availability and price of competing or generic drugs for the same clinical indication, the size of the patient population, and drug payment or price regulation policies. Supply-side factors, such as the cost to develop drugs, are not as strongly associated with drug prices. This is because the cost to develop a drug is incurred
124 U.S. Government Accountability Office, DRUG INDUSTRY: Profits, Research and Development Spending, and Merger and Acquisition Deals, GAO-18-40, November 17, 2017, https://www.gao.gov/assets/690/688472.pdf. These values were calculated based on “worldwide R&D spending by U.S.-owned pharmaceutical companies and U.S.-based R&D by foreign companies.” This 8% change was based on a real-dollar calculation (which accounts for inflation). 125 Ibid. 126 Ibid. GAO found that direct federal spending on biomedical research, primarily through NIH, aggregately decreased from “$27 billion in fiscal year 2008 to $26 billion in fiscal year 2014, after a peak of $32 billion in 2010.” The 2014 value is 3.8% less than the 2008 value, and the calculation was based on real-dollar amounts (accounting for inflation).
127 David Austin and Tamara Hayford, Research and Development in the Pharmaceutical Industry, Congressional Budget Office, April 2021, https://www.cbo.gov/publication/57126#_idTextAnchor036.
128 H.R. 1391. See, for example, S. 1801 (116th Congress) Section 101, Drug Manufacturer Reporting. This would require drug manufacturers to submit annual reports to the HHS Secretary and to Congress their itemized R&D costs, including such costs related to marketing, preclinical research, and patenting and licensing.
129 Salomeh Keyhani, Marie Diener-West, and Neil Powe, “Are Development Times for Pharmaceuticals Increasing or Decreasing?,” Health Affairs, vol. 25, no. 2 (March/April 2006), pp. 461-468; Sydney Costantini and Rochelle P. Walensky, “The Costs of Drugs in Infectious Diseases: Branded, Generics, and Why We Should Care,” The Journal of Infectious Diseases, March 19, 2019, pp. 1-7; and Vinay Prasad and Kevin R. De Jesus-Morales, “The High Price of Anticancer Drugs: Origins, Implications, Barriers, Solutions,” Nature Reviews Clinical Oncology, October 2017.
Congressional Research Service
32
Frequently Asked Questions About Prescription Drug Pricing and Policy
before a drug is ever sold, and therefore represents a “sunk cost” to the company. 130 CBO notes that such sunk costs (already incurred in developing the drug) do not influence drug prices; instead, “when drug companies set the prices of a new drug, they do so to maximize future revenues net of manufacturing and distribution costs.”131
A 2017 GAO report on drug development costs identifies market factors associated with drug prices.132 The report notes that the biggest factor influencing drug prices is the level of competition that a given drug may face. For example, based on economic principles of supply and demand, a brand-name drug with little or no competition essentially experiences more “inelastic demand,” where there are few or no alternatives (less competition), and these products are often able to be priced at the discretion of the pharmaceutical firm. Brand-name drugs with competition (i.e., therapeutic alternatives for treating the same condition) and/or generic drugs, on the other hand, may experience more “elastic demand,” where there are many alternatives (more competition) so products are priced based on consumer willingness to pay for a particular therapeutic and the prices of substitutable products.133 This pricing consideration is described in GAO’s 2017 report, which states that
[b]rand-name companies producing drugs under patent or exclusivity protection have monopoly pricing power unless alternative drugs that treat the same condition are available. For brand-name products that face competition from such therapeutic alternatives, companies compete on price, differentiation from competitors, or both.134
Generic drugs, on the other hand, compete with other brand-name and generic alternatives primarily on the basis of price when they are first introduced to a market. For these generic drugs, price tends to fall as more competitors enter the market. A 2019 FDA report further describes this phenomenon, finding that after the entry of a generic product to market, as competition increases, generic prices decrease.135 This phenomenon is more pronounced based on the number of drug competitors in the generic market, such that the more competitors enter the market, the lower the generic Average Manufacturing Price (AMP) will be compared with brand drug prices.136 This study found that
130 Stuart O. Schweitzer and Z. John Lu, “The Pharmaceutical Industry,” in Pharmaceutical Economics and Policy: Perspectives, Promises, and Problems, 3rd ed. (New York , NY: Oxford University Press, 2018), pp. 8-11; and David H. Howard, Peter B. Bach, Ernst R. Berndt, et al., “Pricing in the Market for Anticancer Drugs,” Journal of Economic Perspectives, vol. 29, no. 1 (Winter 2015), pp. 139-162.
131 David Austin and Tamara Hayford, Research and Development in the Pharmaceutical Industry, Congressional Budget Office, April 2021, https://www.cbo.gov/publication/57126#_idTextAnchor036.
132 U.S. Government Accountability Office, DRUG INDUSTRY: Profits, Research and Development Spending, and Merger and Acquisition Deals, GAO-18-40, November 17, 2017, https://www.gao.gov/assets/690/688472.pdf.
133 Other things equal, given two equally substitutable products, consumers are more likely to purchase the cheaper commodity.
134 U.S. Government Accountability Office, DRUG INDUSTRY: Profits, Research and Development Spending, and Merger and Acquisition Deals, GAO-18-40, November 17, 2017, https://www.gao.gov/assets/690/688472.pdf.
135 Ryan Conrad and Randall Lutter, Generic Competition and Drug Prices: New Evidence Linking Greater Generic Competition and Lower Generic Drug Prices, Food and Drug Administration, Silver Spring, MD, December 2019, https://www.fda.gov/media/133509/download. This study evaluated “average manufacturer prices (AMP) reported to the Centers for Medicare and Medicaid Services (CMS) and invoice-based wholesale prices reflecting pharmacy acquisitions from IQVIA’s National Sales Perspective database (NSP)” to draw conclusions on generic drug pricing relative to increases in competition.
136 The average manufacturer price (AMP) is the average price paid to the manufacturer by wholesalers for drugs distributed to retail community pharmacies. The AMP, which is used for payment purposes in the federal Medicaid program, is a statutory measure that is calculated based on actual sales transactions. The AMP is defined at 42 CFR §447.504.
Congressional Research Service
33
Frequently Asked Questions About Prescription Drug Pricing and Policy
for products with a single generic producer, the generic AMP is 39% lower than the brand AMP before generic competition, compared to a 31% reduction using invoice prices. With two competitors, AMP data show that generic prices are 54% lower than the brand drug price before generic competition, compared to 44% when calculated using invoice-based drug prices. With four competitors, AMP data show that the generic prices are 79% less than the brand drug price before generic entry, compared to 73% when calculated using invoice-based drug prices. With six or more competitors, generic prices using both AMP and invoice prices show price reductions of more than 95% compared to brand prices. 137
Competition in biologics markets may behave differently than in small molecule prescription drug markets, in part, due to differing regulatory requirements.138 Generic drugs need only prove bioequivalence to an existing brand name product to receive FDA approval.139 This circumvents the need to conduct expensive clinical trials. In contrast, generic biological products, called biosimilars, typically must undergo clinical trials to prove biosimilarity to an existing brand-name biologic. In addition, a generic drug is presumed to be therapeutically equivalent to, and thus interchangeable with, the brand-name drug of which it is a copy. All states have enacted laws that allow or require a pharmacist to substitute a generic for the brand-name drug without the intervention of the prescriber. A biosimilar, however, is not structurally identical to the brand-name biologic, and assessing interchangeability is a separate and more demanding process, which may come at a significant expense to a firm. To date, FDA has not approved any interchangeable biosimilars.140 Given these considerations, market entry of biosimilars may not result in the same price decreases as seen with generic drugs.
Along with market competition, various other factors contribute to prescription drug competition and thus prices, including raw material shortages, the market demand for the drug (e.g., size of patient population), FDA review times, and consolidation among drug manufacturers and buyers (such as retail pharmacies), among others.141 There is some evidence that the relationship between drug pricing and drug development is bidirectional, meaning that overall drug prices may also influence industry R&D investments. For example, a 2005 paper found that a “10 percent increase in the growth of real drug prices is associated with nearly a 6 percent increase in the growth of R&D intensity.”142 This paper used both a theoretical microeconomic model and publically unavailable pharmaceutical R&D data, reported in the aggregate and not by individual firms,143 from the Pharmaceutical Research and Manufacturers Association (PhRMA, pharmaceutical industry association). This theoretical model was based in part on the authors’ observation that “the variable costs of manufacturing drugs are very low. The sunk costs
137 Ibid. 138 Compared with small molecule drugs, which are typically chemically synthesized, biologics are relatively large and complex molecules. They may be composed of proteins (and/or their constituent amino acids), carbohydrates (such as sugars), nucleic acids (such as DNA), or combinations of these substances.
139 CRS Report R46221, Drug Pricing and Pharmaceutical Patenting Practices, coordinated by Kevin T. Richards. 140 See CRS Report R44620, Biologics and Biosimilars: Background and Key Issues, by Agata Bodie. 141 U.S. Government Accountability Office, Generic Drugs Under Medicare: Part D Generic Drug Prices Declined Overall, but Some Had Extraordinary Price Increases, 16-706, August 12, 2016, https://www.gao.gov/products/gao-16-706.
142 Carmelo Giaccotto, Rexford E. Santerre, and John A. Vernon, “Drug Prices and Research and Development Investment Behavior in the Pharmaceutical Industry,” Journal of Law and Economics, vol. 48, no. 1 (April 2005), pp. 195-214. The authors define R&D intensity as “pharmaceutical R&D expenditure as a percentage of sales.”
143 Ibid. The authors write, “These R&D data are a measure of comprehensive R&D outlays and include the domestic and foreign R&D expenditures of U.S.-owned PhRMA member companies, the domestic (U.S.) R&D expenditures of foreign-owned PhRMA member companies, and the foreign R&D expenditures made by the U.S. divisions of non-U.S.-owned PhRMA member companies.”
Congressional Research Service
34
link to page 24 Frequently Asked Questions About Prescription Drug Pricing and Policy
associated with R&D make up a large proportion of overall costs; thus, rising drug prices reflect growing profit margins and greater internal cash flow, where, “[i]nternal cash flow represents a major source of financing for R&D.”144 The results of this study support the conclusion that drug prices have a direct influence on R&D spending by industry.
Any analysis involving drug prices in the United States is complicated by many factors, the first of which is that list pricing does not always reflect what is actually paid for the drug. This is because wholesalers, retailers, and payers may receive rebates or discounts from manufacturers at different points along the distribution chain.145 This consideration is similar to that of drug development, in that the lack of transparency in drug pricing may inhibit understanding of actual prices paid by consumers.
As part of the Consolidated Appropriations Act, 2021, Congress required commercial health plans to report information on prescription drug costs to the federal government. 146 Additional action through so-called transparency legislation, however, is being debated in Congress and a number of state legislatures (see “What Are U.S. States Doing to Address Drug Costs?”). This legislation would compel drug makers to provide data about research, marketing, and other costs for drugs that have a high price or have experienced a large price increase.147 Price transparency legislation assumes a direct relationship between a drug’s development cost and its resulting price. Given that demand-side factors (competition) are considered more indicative of drug development prices, transparency legislation may shed some light on the business model of pharmaceutical companies, but may not be as useful in understanding the pricing rationale for a specific drug.148
Can the FDA Regulate Prescription Drug Prices? The FDA, pursuant to its authorities under the Federal Food, Drug, and Cosmetic Act (FFDCA) and the Public Health Service Act (PHSA), regulates the marketing of drugs (including biological products or biologics) in the United States.149 Before a new drug can be marketed, it must be approved by the FDA. To obtain approval, a manufacturer must submit an application for marketing approval (i.e., a new drug application [NDA], an abbreviated NDA [ANDA], or a biologics license application [BLA]). A marketing application includes the required clinical data on a drug’s safety and effectiveness (or in the case of a generic drug, bioequivalence data),
144 The authors specifically note that, “internal cash flow represents a major source of financing for R&D given external capital market imperfections such that the cost of using internal funds tends to be less than that of acquiring external funds.”
145 The Medical Letter on Drugs and Therapeutics, “Prescription Drug Prices in the US,” JAMA Network, vol. 319, no. 10 (March 13, 2018), pp. 1042-1043.
146 P.L. 116-260. See “Reporting on Pharmacy Benefits and Drug Costs” in Section 204 of Title II of Division BB in the Consolidated Appropriations Act, 2021.
147 For example, S. 1391 (116th Congress), which would have required drug manufacturers to notify the HHS Secretary and provide cost data before increasing the price of certain drugs by more than 10%. In states, see National Conference of State Legislatures, “Recent Approaches and Innovations in State Prescription Drug Laws,” at https://www.ncsl.org/research/health/rx-costs.aspx.
148 For more information on drug pricing, see CRS Report R46221, Drug Pricing and Pharmaceutical Patenting Practices, coordinated by Kevin T. Richards.
149 FDA approves drugs under the authority of the FFDCA and licenses biologics under the authority of the PHSA. Biologics are subject to most FFDCA drug provisions, and FDA regulations often consider drugs and biologics together and refer to the group as drugs.
Congressional Research Service
35
Frequently Asked Questions About Prescription Drug Pricing and Policy
information about manufacturing procedures (supported by FDA inspection), and proposed labeling.150
The FFDCA, PHSA, and FDA regulations specify the required contents of a premarket application,151 provide for the conditions under which the FDA may deny approval of an application,152 and prohibit certain acts with respect to drugs.153 FDA law and regulations do not expressly require an application to include information about a drug’s price, do not authorize FDA to deny approval of an application because of price, and do not prohibit the marketing of a drug whose price may be considered too high. While the FDA is not explicitly prohibited in statute from requiring drug manufacturers to submit pricing information as part of the approval process, the agency has consistently indicated that it does not have the authority to control or investigate drug prices.154
Instead, the FDA (and Congress) have attempted to help reduce drug prices indirectly by facilitating competition, specifically by (1) increasing access to generic drugs and (2) decreasing so-called “gaming” of existing statutory and regulatory requirements.155 For example, the FDA prioritizes review of certain generic drugs, thus allowing lower-priced alternatives onto the market more quickly. In its manual of policies and procedures, the FDA specifies which generic drug applications (i.e., ANDAs) it will prioritize for review, including those for “sole source” drugs or for drugs that are in shortage. The cost of the brand-name drug is not listed as a consideration for prioritization of generic drug review.156 The FDA also publishes on its website a list of off-patent, off-exclusivity drugs for which there are no approved generics and aims to expedite the review of ANDAs for drugs on this list.157 However, the generic drugs trade association has noted that the drugs on this list are not necessarily good candidates for development for a variety of reasons, including the capital investment required and low volume of sales because the drug treats a small population or is no longer the standard of care.158 To further promote competition, the FDA has issued a final rule and guidance to allow for the importation of certain drugs intended for foreign markets. As described in the next section, the
150 See, in particular, FFDCA §§505 (new drugs), 501 (adulteration), and 502 (misbranding), as well as PHSA §351. For an easier-to-read description, see CRS Report R41983, How FDA Approves Drugs and Regulates Their Safety and Effectiveness, and CRS Report R44620, Biologics and Biosimilars: Background and Key Issues.
151 The requirements for an NDA are specified in FFDCA §505(b) and 21 C.F.R. §314.50; the requirements for an ANDA are specified in FFDCA §505(j)(2) and 21 C.F.R. §314.94; and the requirements for a BLA are specified in 21 C.F.R. §601.2 and additional requirements specific to a BLA for a biosimilar are in PHSA §351(k)(2).
152 The requirements for denial of approval of an NDA are specified in FFDCA §505(d) and 21 C.F.R. §314.125; the requirements for denial of approval of an ANDA are specified in FFDCA §505(j)(4) and 21 C.F.R. §314.127; and the requirements for denial of licensure of a BLA are specified in 21 C.F.R. §601.3 and §601.4.
153 Prohibited acts are listed in FFDCA §301. 154 FDA, Frequently Asked Questions about CDER, https://www.fda.gov/AboutFDA/CentersOffices/OfficeofMedicalProductsandTobacco/CDER/FAQsaboutCDER/default.htm.
155 CRS In Focus IF11075, FDA and Drug Prices: Facilitating Access to Generic Drugs. 156 FDA, Center for Drug Evaluation and Research, Office of Generic Drugs, Manual of Policies and Procedures (MAPP) 5240.3 Rev. 4, “Prioritization of the Review of Original ANDAs, Amendments, and Supplements,” https://www.fda.gov/media/89061/download.
157 FDA initially published a list of off-patent, off-exclusivity drugs with no approved generics and announced its intent to expedite the review of ANDAs for drugs on this list until in June 2017 as part of the agency’s Drug Competition Action Plan. These actions were codified by Section 801 of the FDA Reauthorization Act of 2017 (FDARA; P.L. 115-52) [FFDCA §505(j)(11) & (12)].
158 Comments from the Association for Accessible Medicines (AAM) to Docket No. FDA-2017-N-3615: Administering the Hatch-Waxman Amendments: Ensuring a Balance Between Innovation and Access; Public Meeting; Request for Comments, November 17, 2017, pp. 8-9.
Congressional Research Service
36
Frequently Asked Questions About Prescription Drug Pricing and Policy
importation of unapproved drugs—including unapproved versions of FDA-approved drugs—has generally been prohibited.
The FDA and Congress also have taken action to address alleged practices used by brand companies to delay approval of generic competitors, including misuse of FDA-mandated risk evaluation and mitigation strategies (REMS). The FDA may require a REMS for certain drugs that it otherwise may have kept off the market due to safety risks.159 As part of a REMS, a drug manufacturer may be required to impose restrictions on a drug’s distribution via one or more elements to ensure safe use (ETASU). A brand drug and its generic must use a single, shared system of ETASU, with some exceptions. The FFDCA prohibits a brand company from using ETASU to block or delay approval of a generic application.160 However, FDA and the Federal Trade Commission (FTC) have reported that some brand companies have used REMS and self-imposed restricted distribution systems to prevent or delay generic drugs from entering the market, primarily by withholding or refusing to sell samples of the brand drug to the generic company for testing.161 Although FDA has attempted to address misuse of REMS through guidance, stakeholders have described these efforts as ineffective.162 In December 2019, Congress passed legislation creating a private right of action to allow a generic product developer to bring a civil lawsuit against a brand-name drug manufacturer for failing to provide the generic developer with sufficient quantities of the drug on “commercially reasonable, market-based terms.” The law also provides the FDA with additional flexibility to waive the requirement for a single shared system of ETASU.163 While the impact of this legislative change is not yet clear, CBO had scored similar legislation, estimating that its enactment would decrease the deficit by $3.9 billion over 2019-2029.164
May U.S. Consumers Import Drugs from Abroad? Under current law, the importation of unapproved drugs, including foreign-made versions of FDA-approved drugs, is generally prohibited, with limited exceptions. As mentioned, before a drug may be sold in the United States, it must be approved by FDA. Because FDA’s premarket approval requirements are so detailed and explicit, no drug that a consumer might import would technically fulfill all the approval elements. (For example, a drug must include labeling that FDA has approved for U.S. sales; the labeling of a physically identical drug packaged for foreign sale would not have the U.S.-relevant packaging codes.) The Prescription Drug Marketing Act of 1987 (PDMA; P.L. 100-293) clarified that even for a drug that FDA had approved for U.S. sales that had been sold or transferred to a foreign country, only the manufacturer of that FDA-approved prescription drug may legally bring the drug back into the United States.165
159 FFDCA §505-1[21 U.S.C. §355-1]. 160 FFDCA §505-1(f)(8) [21 U.S.C. §355-1(f)(8)]. 161 For additional information, see CRS In Focus IF11075, FDA and Drug Prices: Facilitating Access to Generic Drugs, and CRS Report R44810, FDA Risk Evaluation and Mitigation Strategies (REMS): Description and Effect on Generic Drug Development.
162 Comments from the Association for Accessible Medicines (AAM) to Docket No. FDA-2017-N-3615: Administering the Hatch-Waxman Amendments: Ensuring a Balance Between Innovation and Access; Public Meeting; Request for Comments, November 17, 2017, p. 23.
163 §610 of P.L. 116-94; 21 U.S.C. §355–2. 164 Congressional Budget Office (CBO), H.R. 965, CREATES [Creating and Restoring Equal Access to Equivalent Samples] Act of 2019, https://www.cbo.gov/system/files/2019-05/hr965_Judiciary.pdf.
165 FFDCA §801(d)(1)(A). The law was enacted to reduce the risk of adulterated or subpotent drugs entering the United States after concern about the resale of manufacturer drug samples and other situations. For additional information, see
Congressional Research Service
37
Frequently Asked Questions About Prescription Drug Pricing and Policy
The FDA has exercised enforcement discretion to permit personal importation of unapproved drugs on a case-by-case basis. As outlined in the agency’s personal importation policy (PIP), the FDA generally allows individuals to bring into the United States a 90-day supply of unapproved drugs for personal use where effective treatment is not available in the United States, the drug is for the treatment of a serious medical condition, and there is no commercialization of the drug to U.S. residents.166 While FDA’s PIP is not intended to allow consumers to bring lower-priced prescription drugs into the United States,167 the policy is used by consumers seeking lower foreign prices for FDA-approved drugs.
Over the years, Congress has introduced legislation that would authorize both personal and commercial importation of unapproved prescription drugs, subject to specified requirements, from countries where they may be less expensive. In the early 2000s, during a period of high prescription drug inflation, Congress enacted the Medicine Equity and Drug Safety Act (MEDS Act; P.L. 106-387), and subsequently the Medicare Prescription Drug, Improvement, and Modernization Act of 2003 (MMA; P.L. 108-173), to allow pharmacists and wholesalers to import unapproved versions of FDA-approved prescription drugs from Canada.168 Despite outlining procedures to do so, the law, in practice, has not allowed such importation. This is because the statute requires that before this provision (FFDCA §804) can take effect, the Secretary must first certify to Congress “that the implementation of this section will (1) pose no additional risk to the public’s health and safety; and (2) result in a significant reduction in the cost of covered products to the American consumer.”169 Until recently, no HHS Secretary has been willing to make such certification.
However, on September 23, 2020, former HHS Secretary Alex Azar made the requisite certification in a letter to Congress. HHS and FDA subsequently promulgated a final rule to implement the MEDS Act provision and allow for the importation of certain prescription drugs from Canada, specifically Health Canada-approved versions of U.S.-approved drugs (i.e., drugs marketed under an NDA or ANDA).170 The rule allows states and tribes to submit so called Section 804 Importation Program (SIP) proposals to FDA for review and authorization. Consistent with the statutory language, certain drugs are ineligible for importation, including biologics (e.g., insulin, monoclonal antibodies) and intravenously injected drugs, among others.171 While Secretary Azar made the necessary certification in a letter to Congress, the final rule requires SIP sponsors (i.e., states, tribes, and, in certain future circumstances, pharmacies and wholesalers) to demonstrate that their program will pose no additional risk to the public’s health and safety and to explain how they will ensure their SIP will result in a significant reduction in the cost of covered products to consumers. Proposals must specify the eligible drugs to be included in the SIP, which would have to bear the required U.S. labeling and undergo testing for
CRS In Focus IF11056, Prescription Drug Importation.
166 FDA, “Personal Importation Policy (PIP) Frequently Asked Questions (FAQs),” https://www.fda.gov/media/83411/download.
167 Ibid. 168 FFDCA §804 [21 U.S.C. §384], as added by §745 of the Medicine Equity and Drug Safety Act (MEDS Act; P.L. 106-387) and subsequently amended by §1121 of the Medicare Prescription Drug, Improvement, and Modernization Act of 2003 (MMA; P.L. 108-173).
169 FFDCA §804(l) [21 U.S.C. §384(l)]. 170 FDA, “FDA Takes Actions to Help Lower U.S. Prescription Drug Prices,” September 24, 2020, https://www.fda.gov/news-events/press-announcements/fda-takes-actions-help-lower-us-prescription-drug-prices. HHS, FDA, “Importation of Prescription Drugs,” 85 Federal Register 62094, published October 1, 2020. 171 FFDCA §804(a)(3) [21 U.S.C. §384(a)(3)].
Congressional Research Service
38
Frequently Asked Questions About Prescription Drug Pricing and Policy
quality and authenticity, in addition to meeting other supply chain security requirements. SIP proposals also must identify the foreign seller in Canada that will purchase the eligible prescription drug directly from its manufacturer, as well as the U.S. importer that will purchase the drug directly from the foreign seller. Both the foreign seller and importer would be subject to applicable U.S. registration and licensure requirements, as well as FFDCA supply chain security requirements.
Concurrent with promulgation of the final rule, FDA also published a guidance to facilitate the importation by drug manufacturers of prescription drugs that are FDA-approved, manufactured abroad, and originally intended and authorized for sale in a foreign country (i.e., “multi-market approved [MMA] products”).172 Among other things, the guidance describes procedures for a drug manufacturer to obtain a National Drug Code (NDC) for an MMA product. According to FDA, “the use of an additional NDC for these products may allow greater flexibility for drug companies to offer these products at a lower price than what their current distribution contracts require.”173 The guidance applies to drug manufacturers, offering them an option to import drugs that may provide lower cost alternatives to consumers. This is in contrast to the SIP final rule, which creates a mechanism for importation by entities other than the drug manufacturer and does not require the manufacturer to authorize the importation. Also unlike the SIP final rule, the policy outlined in the guidance applies to small molecule prescription drugs and biologics and is not limited to importation of drugs from Canada.
It is not clear how or if expanding legal drug importation would affect costs for U.S. consumers and payers. With respect to FDA’s final rule, to date, the agency has not authorized any SIPs, and at least one lawsuit has been filed challenging the rule.174 Notably, high-cost biologics such as insulin are excluded from the program. With respect to the guidance, it provides an option for manufacturers, but it is not clear how many manufacturers are interested in importing drugs and biologics intended for foreign markets in order to offer them at a lower cost to U.S. consumers. Further, other countries may be reluctant to support U.S. importation policies, as it may affect their own domestic supply of drugs. For example, Canadian officials reportedly have opposed U.S. importation proposals, and in November 2020, the Canadian government announced that certain drugs intended for the Canadian market may not be sold outside of Canada if such sale would cause or worsen a drug shortage.175 Proposals to expand drug importation also have been opposed by several former FDA Commissioners and HHS Secretaries, as well as by the pharmaceutical industry, citing safety concerns. Given these concerns and the change in Administration, the implementation of these importation policies remains uncertain.
In addition to the FDA rulemaking and guidance, some members of Congress have introduced legislation to authorize importation of unapproved prescription drugs, subject to specified
172 FDA, “Importation of Certain FDA-Approved Human Prescription Drugs, Including Biological Products, and Combination Products under Section 801(d)(1)(B) of the Federal Food, Drug, and Cosmetic Act Guidance for Industry,” September 2020, https://www.hhs.gov/sites/default/files/importation-guidance.pdf. 173 FDA, “FDA Takes Actions to Help Lower U.S. Prescription Drug Prices,” September 24, 2020, https://www.fda.gov/news-events/press-announcements/fda-takes-actions-help-lower-us-prescription-drug-prices.
174 Pharmaceutical Research and Manufacturers of America v. U.S. Department of Health and Human Services, 1:20-cv-03402 (United States District Court for the District of Columbia), filed November 23, 2020.
175 Health Canada, “Canada announces new measures to prevent drug shortages,” November 28, 2020, https://www.canada.ca/en/health-canada/news/2020/11/canada-announces-new-measures-to-prevent-drug-shortages.html. Allison Martell, “Exclusive: Canada warns U.S. against drug import plans, citing shortage concerns,” Reuters, July 18, 2019, https://www.reuters.com/article/us-canada-pharmaceuticals-exports-exclus/exclusive-canada-warns-u-s-against-drug-import-plans-citing-shortage-concerns-idUSKCN1UD2LN.
Congressional Research Service
39
link to page 24 Frequently Asked Questions About Prescription Drug Pricing and Policy
requirements.176 Some states have attempted to enact their own laws allowing prescription drug importation. (See “What Are U.S. States Doing to Address Drug Costs?)
How are Prescription Drug Ads Regulated? The United States is one of two nations (along with New Zealand) that allow direct-to-consumer (DTC) advertising of prescription drugs.177 Congress has given FDA the authority to regulate DTC ads to ensure they are not false or misleading, fairly balance the benefits and risks of the specific drugs, and contain facts relevant to a drug’s intended uses.178 Under current law, businesses, including pharmaceutical companies, may take a federal tax deduction for advertising expenses. Advertising expenditures generally are treated as ordinary and necessary business expenses in the tax code and can be fully deducted in the year they are incurred.
DTC advertising is just one facet of the industry’s promotion efforts. Pharmaceutical firms also market to physicians and other health care providers via professional journals, conferences, marketing calls, and samples.179
Pharmaceutical advertising has evolved since 1962, when Congress gave FDA (rather than the Federal Trade Commission) authority (within limits) over prescription drug advertising. In 1969, when FDA issued regulations requiring manufactures to provide true and balanced information in drug advertising, most ads were in print journals directed at physicians.180 During the 1980s, pharmaceutical firms began advertising to consumers; FDA addressed this in a 1985 Federal Register notice. In 1999, FDA issued guidance on broadcast ads.181 Since that time, FDA has published updated guidance on relevant issues, including internet advertising.182
DTC prescription drug advertising expanded steadily over the decades, reaching more than $5 billion in 2006.183 Advertising dipped during the 2007 recession and did not rebound to the 2006 peak until about 2014. Recent data indicate that DTC advertising has been increasing at a more rapid pace during the past several years. 184 According to Kantar Media, a market research and
176 See, for example, S. 920 (117th Congress), Affordable and Safe Prescription Drug Importation Act, H.R. 832 and S. 259 (117th Congress), Safe and Affordable Drugs from Canada Act of 2021.
177budget impact of drugs that are newly approved by FDA.85 The effort raised concerns in the pharmaceutical industry, with manufacturing trade group PhRMA saying that some of the research is designed to limit reimbursement and, as a result, would limit patients' access to treatments.86 ICER has reached out to different segments of the health care industry as it has refined its methodology for valuing prescription drugs.87
Pharmaceutical Development and Marketing
How Much Does Publicly Funded Research Contribute to Drug Development?
In general, the federal government tends to focus on basic or preclinical research—such as the work conducted or supported by the National Institutes of Health—and the pharmaceutical industry tends to concentrate more of its research funding on clinical trials rather than on discovery activity.88 When trying to assign credit for specific therapeutic advancements, drawing a line between basic and applied research can be challenging. For example, without a major underlying basic advance, such as recombinant DNA,89 the development of whole new classes of drugs would not exist.
Various studies have attempted to quantify the contribution of publicly funded research to the discovery of new drugs, as compared to the contribution from private industry. A study published in 2003 found that of the 284 new drugs approved by FDA from 1990 through 1999, only 6.7% originated from sources other than private industry.90 A 1993 study found that 7.6% of new drugs approved from 1981 through 1990 originated from nonindustry sources.91 However, rather than focusing on all drug approvals—including many "me-too" drugs (see Table 1, above)—another way to answer this question is to look at the origin of truly innovative new drugs, what FDA calls new molecular entities (NMEs). NMEs are drugs that have not been approved by FDA previously and frequently provide important new therapies for patients.92 A 2010 study found that of the NMEs and new biologics that received FDA approval between 1998 and 2007, 24.1% originated from work that was publicly funded.93
A study by Ashley J. Stevens et al. published in 2011 claims to take a more comprehensive look at the contribution of publicly funded research to the discovery of new drugs than these earlier investigations.94 The Stevens study found that of the 1,541 drugs approved by FDA from 1990 through 2007, 143, or 9.3%, resulted from work conducted in publicly funded labs. Of the 1,541 total drug applications, FDA granted priority review to 348 applications, and 66 of these (19%) resulted from publicly funded research. The authors stated that "viewed from another perspective, 46.2% of the new-drug applications from PSRIs [public-sector research institutions] received priority reviews, as compared with 20.0% of applications that were based purely on private-sector research, an increase by a factor of 2.3."95 An FDA designation of priority review is for "the evaluation of applications for drugs that, if approved, would be significant improvements in the safety or effectiveness of the treatment, diagnosis, or prevention of serious conditions when compared to standard applications."96 According to the authors, their data "suggest that PSRIs tend to discover drugs that are expected to have a disproportionately important clinical effect."97
The 2011 Stevens study considered a PSRI "to have participated in the applied phase of research that led to discovery of a drug if it, solely or jointly, created intellectual property specific to the drug that was subsequently transferred to a company through a commercial license." The methodology used by the Stevens study "excluded the role of PSRIs in the development of platform technologies that have contributed to the development of whole new classes of drugs." These platform technologies enabled the development of many of the products approved by FDA during the period evaluated in the study. The platform technologies were excluded "because the PSRI scientists who developed the platforms generally did not use them to develop specific drug candidates."98 For example, the following platform technologies were all developed with public funds and were excluded from the study:
- recombinant DNA technology (Cohen-Boyer patents);
- bacterial production methods for recombinant DNA (Riggs-Itakura patents);
- production and chimerization methods for antibodies (Cabilly patents);
- methods to produce glycosylated recombinant proteins in mammalian cells (Axel patents); and,
- methods of gene silencing with the use of small interfering RNAs (Mello-Fire patents).
Many new drugs were developed using these platform technologies; if these technologies did not exist, the result may have been a vastly different economic outlook for the pharmaceutical industry.
A 2018 study found that public funding contributed to every NME approved by the FDA from 2010 to 2016.99 The study, which looked at peer-reviewed literature and public data on NIH grant funding, determined that funding from NIH was "directly or indirectly associated with every one of 210 NMEs approved from 2010-2016." Almost a third (29%) of the publications identified were directly associated with NIH-funded projects. The analysis in this study captured basic research, in addition to applied research on NMEs. The study found that up to 20% of the NIH budget allocation from 2000 to 2016, or about $100 billion, "was associated with published research that directly or indirectly contributed to NMEs approved from 2010-2016."100 The authors concluded that their results suggest that "the NIH contribution to research associated with new drug approvals is greater than previously appreciated."
How Much Does It Cost to Develop New Drugs?
Publicly traded pharmaceutical manufacturers release information about aggregate corporate research and development spending, but detailed information about the cost of developing specific drugs generally is not available. Over the years, academic researchers have attempted to estimate average spending for drug development.
The most often-cited academic study, by the Tufts Center for the Study of Drug Development, is based on information voluntarily provided by 10 large drug manufacturers. The study uses the manufacturers' data to estimate average spending for clinical research on new drugs (including experimental drugs that fail) and the time costs of development, meaning the expected returns that investors do not realize during the years a drug is moving toward approval. According to a 2014 Tufts estimate, the pretax cost of developing an FDA-approved prescription drug was $2.6 billion,101 which included $1.4 billion in clinical spending and $1.2 billion in time costs.102 The 2014 figure is an update of other Tufts studies, including a 2002 analysis that put the cost at $802 million.103 (The 2014 estimates are expressed in 2013 dollars, and the 2003 study is in 2000 dollars.)
Academic and government research has challenged the Tufts study.104 Specifically, there are questions about the study's assumption that drug companies must pay an effective 10.5% rate of return to attract capital during the years that drugs are in development, the mix of drugs sampled, and whether the report captures the positive impact of federal tax breaks for research and development spending. A 2016 HHS study noted that estimates for new drug development range from $1.2 billion to $2.6 billion and are highly sensitive to such factors as assumptions about development time; cost of capital; and whether the study includes orphan drugs, which are likely to have smaller trial sizes and higher success rates and which receive special federal tax breaks.105
So-called transparency legislation being debated in Congress and a number of state legislatures would compel drugmakers to provide data about research, marketing, and other costs for drugs that have a high price or have experienced a large price increase.106 (See "What Are U.S. States Doing to Address Drug Costs?")
Price transparency legislation assumes that research and development costs are, or should be, a main factor used by drugmakers in setting prices. Several studies of specific drugs indicate that research cost was not a primary factor in pricing. A 2015 Senate Finance Committee investigation of Gilead Pharmaceutical's hepatitis C drugs Sovaldi and Harvoni found that Gilead's research and development costs, and its expected return for buying Pharmasset, Inc., which originally developed the products, "were not key considerations in determining the pricing of these drugs." Gilead's "own documents and correspondence show its pricing strategy was focused on maximizing revenue—even as the company's analysis showed a lower price would allow more patients to be treated."107 Similarly, an examination of the Pfizer breast cancer drug Ibrance found the main factors used by Pfizer to set the drug's list price were the price of existing drugs in the same therapeutic category, likely reimbursement from insurance companies and federal programs and feedback from prescribers.108
Does Congress Regulate Prescription Drug Ads?
The United States is one of two nations (along with New Zealand) that allow direct-to-consumer (DTC) advertising of prescription drugs.109 Congress has given FDA the authority to regulate DTC ads to ensure they are not false or misleading, fairly balance the benefits and risks of the specific drugs, and contain facts relevant to a drug's intended uses.110 Under current law, businesses, including pharmaceutical companies, may take a federal tax deduction for advertising expenses. Advertising expenditures generally are treated as ordinary and necessary business expenses in the tax code and can be fully deducted in the year they are incurred.
DTC advertising is just one facet of the industry's promotion efforts. Pharmaceutical firms also market to physicians and other health care providers via professional journals, conferences, marketing calls, and samples.111
Pharmaceutical advertising has evolved since 1962, when Congress gave FDA (rather than the Federal Trade Commission) authority (within limits) over prescription drug advertising. In 1969, when FDA issued regulations requiring manufactures to provide true and balanced information in drug advertising, most ads were in print journals directed at physicians.112 During the 1980s, pharmaceutical firms began advertising to consumers; FDA addressed this in a 1985 Federal Register notice. In 1999, FDA issued guidance on broadcast ads.113 Since that time, FDA has published updated guidance on relevant issues, including internet advertising.114
DTC prescription drug advertising expanded steadily over the decades, reaching more than $5 billion in 2006.115 Advertising dipped during the 2007 recession and did not rebound to the 2006 peak until about 2014. Recent data indicate that DTC advertising has been increasing at a more rapid pace during the past several years. (See Figure 8.) According to Kantar Media, a market research and marketing firm, pharmaceutical advertising rose 56% to more than $6 billion from 2012 to 2015,116 as companies increased the number of drugs with large dedicated advertising budgets and directed more money toward advertising newly introduced drugs.117
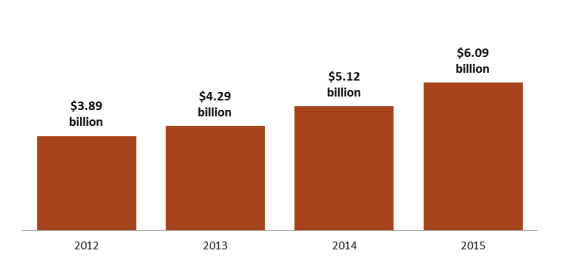
Television and newspaper advertisements account for the majority of spending on pharmaceutical DTC advertising. However, internet-based drug ads—which are less expensive than television, magazine, or newspaper ads—appear to be the fastest-growing area of DTC promotion.
Federal regulations require that at the same time a drug company disseminates a prescription drug ad, it also submits the ad to FDA, which assesses whether it is fair, balanced, and meets other regulatory standards. According to an FDA analysis of materials submitted from 2001 to 2014, the number of internet prescription drug promotions is increasing, whereas television promotions are flat.118 (The data tell how often ads are submitted to FDA but not how often the ads actually appear in different media outlets.) (See Figure 9.)
(review classified by type of media) |
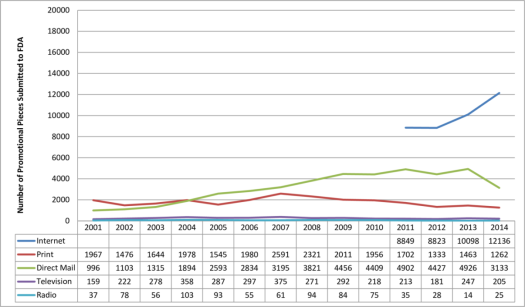 |
|
Source: U.S. Food and Drug Administration (FDA), Office of Prescription Drug Promotion. |
Supporters of pharmaceutical advertising say it contributes to more informed consumers who then visit their doctors and become more involved in their own treatment, leading to better and earlier diagnosis of undertreated illnesses. Critics say the industry's presentation of the balance of drug benefit and risk information may encourage inappropriate prescribing of advertised products and ultimately may lead to higher drug spending. Advertising for new brand-name drugs with higher prices may lead consumers to seek brand-name products, substituting them for lower-priced brand or generic drugs or beginning a course of treatment where previously no drug had been used. It is not clear, in some cases, that the new drugs are more effective or safer than other drugs or that they confer enough additional benefits compared to existing treatments to justify paying their higher prices.
Recent studies suggest a link between drug advertising and increased use of prescription drugs. A 2015 study suggested that a 10% rise in drug advertising views leads to a 5.4% increase in filled prescriptions for the advertised drugs.119 A 2006 Government Accountability Office report found that advertising may have direct benefits but also may encourage use of advertised drugs even if alternatives may be more appropriate.120 A recent government survey found that 46% of the public did not think the DTC advertisements included enough information about the benefits of the drugs and 52% thought they did not include enough information about the risks.121
Congress has debated restricting DTC drug advertising in the past. The issue has received new attention with two distinct goals: protecting the public's health from unsafe or ineffective drugs and protecting the public's pocketbook from unnecessary higher spending. In November 2015, the American Medical Association voted to recommend a ban on DTC drug ads.122 In January 2016, the American Society of Health-System Pharmacists followed suit.123 A ban could raise constitutional issues, given that courts in the past have ruled that product advertisements are "commercial speech" protected by the First Amendment.124
Legislation introduced in the 114th Congress would have imposed a moratorium on advertising for new drugs.125 The Kantar data indicating that manufacturers are focusing ad dollars on newly introduced products underscores a long-standing concern that new drugs are being promoted to consumers before there is long-term evidence about their safety and effectiveness.126 In 2006, the Institute of Medicine recommended that FDA restrict DTC advertising of new drugs for two years after introduction.127 Over the years, Congress has debated, but has not approved, a moratorium on advertising for new drugs.128
Likewise, lawmakers during the 114th Congress introduced legislation to disallow federal tax deductions for pharmaceutical DTC advertising as a means to reduce drug spending.129 Congress also has debated the issue in the context of broader tax reform.130
May U.S. Consumers Import Drugs from Abroad?
FDA, under the authority of the Federal Food, Drug, and Cosmetic Act, regulates the sale of pharmaceuticals in the United States.131 Without an approved marketing application (new drug application, abbreviated new drug application, or biologics license application), a manufacturer may not sell a drug in the U.S. market.132 An approved marketing application has included the required clinical data on safety and effectiveness, manufacturing procedures (supported by an inspection) and reporting processes, and labeling, including packaging. Because the requirements are so detailed and explicit, no drug that a consumer might import would technically fulfill all the approval elements. (For example, a drug must include labeling that FDA has approved for U.S. sales; the labeling of a physically identical drug packaged for foreign sale would not have the U.S.-relevant packaging codes.) The Prescription Drug Marketing Act of 1987 (PDMA; P.L. 100-293) clarified that, even for a drug that FDA had approved for U.S. sales that had been sold or transferred to a foreign country, only the manufacturer of that FDA-approved prescription drug may legally bring the drug back into the United States.133
In 2000, during a period of high prescription drug inflation, the 106th Congress enacted the Medicine Equity and Drug Safety Act (MEDS Act; P.L. 106-387) to allow pharmacists and wholesalers to import FDA-approved prescription drugs. Despite outlining procedures to do so, the act, in practice, has not allowed such importation. The MEDS Act required that, before publishing implementing regulations to put the import provisions into effect, the HHS Secretary must first certify to Congress "that the implementation of this section will (1) pose no additional risk to the public's health and safety; and (2) result in a significant reduction in the cost of covered products to the American consumer."134 Congress included a reworking of the MEDS Act provision in 2003 in the Medicare Modernization and Prescription Drug Act of 2003 (MMA; P.L. 108-173, which also created Medicare Part D). Because no HHS Secretary has ever made the necessary certifications, the importation provision has never been carried out and consumers, pharmacists, and wholesalers are prohibited from importing prescription drugs from abroad.135
The PDMA, MEDS Act, and MMA legislation addressed importation by entities other than the manufacturer that held the approved marketing application. If the importation provision were implemented, therefore, a company could produce and package a drug outside the United States according to manufacturing processes, facility inspections, and U.S.-audience designed labeling as outlined in its FDA approval and then bring the drug into the United States for sale.
Lawmakers have tried several times to use the annual agriculture appropriations bill (which funds FDA) to get around administrative roadblocks to prescription drug importation by individuals, pharmacies, and wholesalers. For example, the House has passed versions of the agriculture spending bill that would prohibit FDA from using funds to prevent individuals, pharmacists, or wholesalers from importing prescription drugs that comply with the core requirements of the FDA drug approval system.136
FDA has chosen to be lenient in its enforcement of personal importation restrictions and has allowed individuals to bring into the United States a small amount (i.e., a 90-day supply) of non-FDA-approved drugs for personal use. FDA requires that individuals affirm in writing that the drugs are for their own use and provide the name and address of their treating physician. When FDA's personal-use import policy began, it was not envisioned as a way for consumers to bring lower-priced prescription drugs into the United States. According to FDA's policy statement on importing drugs for personal use,
the intent of the personal use importation guidance is to save FDA resources and to generally permit, through the exercise of enforcement discretion, medical treatments sought by individuals that are not otherwise available in the United States (where such treatments are not promoted/commercialized in the United States). Thus foreign-made chemical versions of drugs available in the United States are not intended to be covered by the policy.137
But where the policy once let a few people import—for personal use—cancer or AIDS drugs that were not available for sale in the United States, today that policy is used by consumers seeking lower foreign prices for FDA-approved drugs available in the United States.138 Some states have attempted to enact their own laws allowing prescription drug importation. (See "What Are U.S. States Doing to Address Drug Costs?")
Appendix. Relevant Congressional Drug Pricing Hearings in the 114th and 115th Congresses
Senate Committee on Appropriations
Prioritizing Public Health: The FDA's Role in the Generic Drug Marketplace, 114th Cong., 2nd sess., September 21, 2016, at http://www.appropriations.senate.gov/hearings/prioritizing-public-health_the-fdas-role-in-the-generic-drug-marketplace.
Senate Special Committee on Aging
Valeant Pharmaceuticals' Business Model: the Repercussions for Patients and the Health Care System, 114th Cong., 2nd sess., April 27, 2016, at http://www.aging.senate.gov/hearings/valeant-pharmaceuticals-business-model-the-repercussions-for-patients-and-the-health-care-system.
Sudden Price Spikes in Decades-Old Rx Drugs: Inside the Monopoly Business Model, 114th Cong., 2nd sess., March 17, 2016, at http://www.aging.senate.gov/hearings/sudden-price-spikes-in-decades-old-rx-drugs-inside-the-monopoly-business-model.
Sudden Price Spikes in Off-Patent Drugs: Perspectives from the Front Lines, 114th Cong., 1st sess., December 9, 2015, at http://www.aging.senate.gov/hearings/sudden-price-spikes-in-off-patent-drugs_perspectives-from-the-front-lines.
Senate Committee on Finance
Examining the Proposed Medicare Part B Drug Demonstration, 114th Cong., 2nd sess., June 28, 2016; at http://www.finance.senate.gov/hearings/examining-the-proposed-medicare-part-b-drug-demonstration.
Senate Committee on Health, Education, Labor, and Pensions
The Cost of Prescription Drugs: An Examination of The National Academies of Sciences, Engineering, and Medicine Report "Making Medicines Affordable: A National Imperative"115th Cong., 1st sess., December 12, 2017, at https://www.help.senate.gov/hearings/the-cost-of-prescription-drugs-an-examination-of-the-national-academies-of-sciences-engineering-and-medicine-report-making-medicines-affordable-a-national-imperative.
The Cost of Prescription Drugs: How the Drug Delivery System Affects What Patients Pay, Part II, 115th Cong., 1st sess., October 17, 2017, at https://www.help.senate.gov/hearings/the-cost-of-prescription-drugs-how-the-drug-delivery-system-affects-what-patients-pay-part-ii.
The Cost of Prescription Drugs: How the Drug Delivery System Affects What Patients Pay, 115th Cong., 1st sess., June 13, 2017, at https://www.help.senate.gov/hearings/the-cost-of-prescription-drugs-how-the-drug-delivery-system-affects-what-patients-pay.
EpiPen Price Increases: How Regulatory Barriers Inhibit Pharmaceutical Competition, field hearing, 114th Cong., 2nd sess., October 7, 2016, at http://www.help.senate.gov/hearings/epipen-price-increases-how-regulatory-barriers-inhibit-pharmaceutical-competition/.
Generic Drug User Fee Amendments: Accelerating Patient Access to Generic Drugs, 114th Cong., 2nd sess., January 28, 2016, at http://www.help.senate.gov/hearings/generic-drug-user-fee-amendments-accelerating-patient-access-to-generic-drugs.
Biosimilar Implementation: A Progress Report from FDA, 114th Cong., 1st sess., September 17, 2015, at http://www.help.senate.gov/hearings/biosimilar-implementation-a-progress-report-from-fda.
Continuing America's Leadership: Advancing Research and Development for Patients, 114th Cong., 1st sess., March 24, 2015, at http://www.help.senate.gov/hearings/continuing-americas-leadership-advancing-research-and-development-for-patients.
House Energy and Commerce Committee
Examining the Drug Supply Chain, 115th Cong., 2nd sess., December 13, 2017, at https://energycommerce.house.gov/hearings/examining-drug-supply-chain/.
Examining How Covered Entities Utilize the 340B Drug Pricing Program, 115th Cong., 1st sess., October 11, 2017, https://energycommerce.house.gov/hearings/examining-covered-entities-utilize-340b-drug-pricing-program/.
Examining Patient Access to Investigational Drugs, 115th Cong., 1st sess., October 3, 2017, at https://energycommerce.house.gov/hearings/examining-patient-access-investigational-drugs/.
Modernizing FDA's Regulation of Over-the-Counter Drugs, 115th Cong., 1st sess., September 13, 2017, https://energycommerce.house.gov/hearings/modernizing-fdas-regulationof-counter-drugs/.
Examining FDA's Prescription Drug User Fee Program, 115th Cong., 1st sess., March 22, 2017, at https://energycommerce.house.gov/hearings-and-votes/hearings/examining-fda-s-prescription-drug-user-fee-program.
Examining FDA's Generic Drug and Biosimilar User Fee Program, 115th Cong., 1st sess., March 2, 2017, at https://energycommerce.house.gov/hearings-and-votes/Hearing.
The Obama Administration's Medicare Drug Experiment: The Patient and Doctor Perspective, 114th Cong., 2nd sess., May 17, 2016, at https://energycommerce.house.gov/hearings-and-votes/hearings/obama-administration-s-medicare-drug-experiment-patient-and-doctor.
House Judiciary Committee
Antitrust Concerns and the FDA Approval Process, 115th Cong., 1st sess., July 27, 2017, at https://judiciary.house.gov/hearing/antitrust-concerns-fda-approval-process/.
The State of Competition in the Pharmacy Benefit Manager and Pharmacy Marketplaces, 114th Cong., 1st sess., November 17, 2015, at https://judiciary.house.gov/hearing/the-state-of-competition-in-the-pharmacy-benefit-manager-and-pharmacy-marketplaces/.
House Committee on Oversight and Government Reform
Federally Funded Cancer Research: Coordination and Innovation, 115th Cong., 1st sess., March 29, 2017, at https://oversight.house.gov/hearing/federally-funded-cancer-research-coordination-innovation/.
Examining the Impact of Voluntary Restricted Distribution Systems in the Pharmaceutical Supply Chain, 115th Cong., 1st sess., March 22, 2017, at https://oversight.house.gov/hearing/examining-impact-voluntary-restricted-distribution-systems-pharmaceutical-supply-chain/.
Reviewing the Rising Price of EpiPens, 114th Cong., 2nd sess., September 21, 2016, at https://oversight.house.gov/hearing/reviewing-rising-price-epipens-2/.
Developments in the Prescription Drug Market: Oversight, 114th Cong., 2nd sess., February 4, 2016, at https://oversight.house.gov/hearing/developments-in-the-prescription-drug-market-oversight/.
Author Contact Information
Footnotes
| 1. |
Centers for Medicare & Medicaid Services (CMS), "National Health Expenditure Projections 2017-2026," at https://www.cms.gov/Research-Statistics-Data-and-Systems/Statistics-Trends-and-Reports/NationalHealthExpendData/NationalHealthAccountsProjected.html. Also see CMS, "CMS Office of the Actuary Releases 2017-2026 Projections of National Health Expenditures," February 14, 2018, at https://www.cms.gov/Newsroom/MediaReleaseDatabase/Press-releases/2018-Press-releases-items/2018-02-14.html. |
| 2. |
CMS, "National Health Expenditure Projections 2017-2026," at https://www.cms.gov/Research-Statistics-Data-and-Systems/Statistics-Trends-and-Reports/NationalHealthExpendData/NationalHealthAccountsProjected.html. The National Health Expenditures (NHE) data incorporate information from the U.S. Census Bureau and IQVIA (formerly IMS Health), a private firm that provides consulting, technology, and other services for the health care industry. The figures include retail sales of prescription drugs, subtract manufacturer rebates, and add in government spending for drugs provided by government-owned mail-order facilities. |
| 3. |
Although spending for drugs in institutional settings is not included in the NHE retail prescription drug category, it is included in other categories of spending and in overall national health care spending. For example, drugs dispensed in hospitals are included in the NHE hospital spending category. |
| 4. |
Many over-the-counter products originally were prescription products, such as some antihistamines. See U.S. Food and Drug Administration (FDA), "Now Available Without a Prescription," at http://www.fda.gov/Drugs/ResourcesForYou/Consumers/ucm143547.htm. |
| 5. |
CMS, "National Health Expenditure Projections 2017-2026," at https://www.cms.gov/Research-Statistics-Data-and-Systems/Statistics-Trends-and-Reports/NationalHealthExpendData/NationalHealthAccountsProjected.html. The NHE projects national health care spending of $5.7 trillion in 2026, including $605 billion in retail prescription drug spending. |
| 6. |
According to the NHE, retail prescription drug spending was 10% of national health expenditures in 1960. Retail drug spending declined to less than 5% of national health expenditures from 1960 to 1982. During this period, other areas of medical spending were increasing more quickly than drug spending due to the creation of government health programs such as Medicare and Medicaid and the expansion of private health insurance. Retail drug spending began to increase as a share of national health spending in the mid-1980s, due to price inflation and growing consumption. By the early 2000s, retail drug spending had once again reached about 10% of national health care expenditures. See Cynthia Smith, "Retail Prescription Drug Spending in the National Health Accounts," Health Affairs, vol. 233, no. 1 (January/February 2004), pp. 160-167, at https://www.healthaffairs.org/doi/full/10.1377/hlthaff.23.1.160. |
| 7. |
Department of Health and Human Services (HHS), Office of the Assistant Secretary for Planning and Evaluation, "Observations on Trends in Prescription Drug Spending," March 8, 2016, at https://aspe.hhs.gov/sites/default/files/pdf/187586/Drugspending.pdf. The HHS estimate is based on NHE retail prescription drug data and an outside analysis by the Altarum Institute, a nonprofit health systems research and consulting organization. According to Altarum, nonretail, or institutional, drug spending accounts for 28% of prescription drug spending and retail drugs account for 72% The HHS study provided estimates of total prescription drug spending as a share of U.S. personal health expenditures. Personal health expenditures are a subset of the NHE accounts that measure the amount spent each year to treat people with specific medical conditions. Personal health expenditures do not include some areas of spending included in the broader definition of national health expenditures, such as industry investment and public health activity. According to HHS, total prescription drug spending was projected to account for nearly 17% of personal health expenditures in 2016. The comparable measure for retail prescription drugs was 12%. |
| 8. |
IQVIA (formerly IMS Health) estimates that drug spending, based on invoice prices, increased by 5.8% to $450 billion in 2016, which was less than half the rate of increase of the previous two years. After adjusting spending for estimated rebates and other price concessions by manufacturers, IQVIA found that net spending was $323 billion, up 4.8% from comparable 2015 levels. See IQVIA Institute, "Medicines Use and Spending in the U.S., a Review of 2016 and Outlook to 2021," May 2017. Available for download at https://www.iqvia.com/institute/reports/medicines-use-and-spending-in-the-us-a-review-of-2016. Also see Glen Schumock et al, "National Trends in Prescription Drug Expenditures and Projections for 2017," American Journal of Health System Pharmacies, vol. 74 (August 1, 2017), at http://www.ajhp.org/content/73/14/1058.full.pdf+html http://www.ajhp.org/content/early/2017/05/17/ajhp170164/tab-article-info. |
| 9. |
Aaron Catlin and Cathy Cowan, History of Health Spending in the United States, 1960-2013, CMS, p. 23, at https://www.cms.gov/Research-Statistics-Data-and-Systems/Statistics-Trends-and-Reports/NationalHealthExpendData/Downloads/HistoricalNHEPaper.pdf. The implementation of Medicare Part D in 2006 caused a spike in prescription drug spending that year. |
| 10. |
Ibid., p. 23. |
| 11. |
CMS, "National Health Expenditure Projections 2017-2026," at https://www.cms.gov/Research-Statistics-Data-and-Systems/Statistics-Trends-and-Reports/NationalHealthExpendData/NationalHealthAccountsProjected.html. |
| 12. |
Ibid and CMS, "National Health Expenditure Data: Historical," Table 2, at https://www.cms.gov/Research-Statistics-Data-and-Systems/Statistics-Trends-and-Reports/NationalHealthExpendData/NationalHealthAccountsHistorical.html. |
| 13. |
Ibid, and Gigi Cuckler et al., "National Health Expenditure Projections, 2017–26: Despite Uncertainty, Fundamentals Primarily Drive Spending Growth," Health Affairs, vol. 37, no. 3 (March 2018), pp. 1-11, at https://www.cms.gov/Research-Statistics-Data-and-Systems/Statistics-Trends-and-Reports/NationalHealthExpendData/NationalHealthAccountsProjected.html. |
| 14. |
Anne B. Martin et al., "National Health Spending In 2014: Faster Growth Driven by Coverage Expansion and Prescription Drug Spending," Health Affairs, vol. 35, no.1 (December 2, 2015), pp. 150-160, at https://www.healthaffairs.org/doi/pdf/10.1377/hlthaff.2015.1194; and Anne Martin et al., "National Health Spending: Faster Growth In 2015 As Coverage Expands and Utilization Increases," Health Affairs, vol. 26, no. 1 (January 2017). |
| 15. |
Micah Hartman et al., "National Health Care Spending In 2016: Spending and Enrollment Growth Slow after Initial Coverage Expansions," Health Affairs, vol. 37, no.1 (January 2018), at https://www.healthaffairs.org/doi/abs/10.1377/hlthaff.2017.1299. |
| 16. |
FDA approved 46 novel drugs in 2017, 22 in 2016, and 45 in 2015. See FDA, "Novel Drug Approvals for 2017," January 2017, at https://www.fda.gov/Drugs/DevelopmentApprovalProcess/DrugInnovation/ucm537040.htm. |
| 17. |
CRS Report R44132, Specialty Drugs: Background and Policy Concerns. |
| 18. |
IQVIA Institute, "Medicines Use and Spending in the U.S., a Review of 2016 and Outlook to 2021," May 2017. Available for download at https://www.iqvia.com/institute/reports/medicines-use-and-spending-in-the-us-a-review-of-2016. |
| 19. |
Murray Aitken et al., "Has the Era of Slow Growth for Prescription Drug Spending Ended?" Health Affairs, vol. 35, no. 9 (September 2016), p. 1601. The study looked at retail and institutional drug spending. Health Care Cost Institute, 2014 Health Care Cost and Utilization Report, October 2015, p. ii, at http://www.healthcostinstitute.org/files/2014%20HCCUR%2010.29.15.pdf. The report, based on claims data from three major commercial insurers, found that per capita brand-name drug spending in employer-sponsored plans rose by $45 from 2013 to 2014. About two-thirds of the increase, $29.60, was for newly introduced drugs for hepatitis C. Analysts expect new innovator drugs to account for an increasing share of spending going forward. Pharmacy benefits manager Express Scripts estimates that specialty drugs made up more than one third of drug spending in 2016. Specialty drug spending grew 13.3% during the year, whereas traditional drug spending declined by 1%. Express Scripts, Express Scripts 2016 Drug Trend Report, p. 9, at http://lab.express-scripts.com/lab/drug-trend-report. |
| 20. |
IQVIA Institute, "Medicines Use and Spending in the U.S. A Review of 2016 and Outlook to 2021," May 2017. See Charts 4 and 13. Available for download at https://www.iqvia.com/institute/reports/medicines-use-and-spending-in-the-us-a-review-of-2016. |
| 21. |
Among the drugs losing patent protection was Pfizer's blockbuster Lipitor. |
| 22. |
IQVIA Institute, "Medicines Use and Spending in the U.S. A Review of 2016 and Outlook to 2021," May 2017. See Chart 6. Available for download at https://www.iqvia.com/institute/reports/medicines-use-and-spending-in-the-us-a-review-of-2016. See also Catamaran, 2015 Informed Trends: Moments of Opportunity, April, 2014, at https://trendreport.catamaranrx.com/pdf/2014_Trend_Analysis_Report.pdf. |
| 23. |
CRS Report RL34045, FDA Regulation of Follow-On Biologics, and CRS Report R42890, The Role of Patents and Regulatory Exclusivities in Pharmaceutical Innovation. Federal law has provided 12 years of marketing exclusivity for certain biologic drugs, which limits manufacturers' initial market competition and increases their pricing power. Lawmakers also have attempted to spur development of lower-cost biosimilar products, similar to earlier efforts to stimulate development of generic products. Congress and the President enacted the Biologics Price Competition and Innovation Act of 2009 (BPCIA) as Title VII of the Patient Protection and Affordable Care Act (ACA; P.L. 111-148, as amended). The ACA/BPCIA gives the FDA authority to license products shown to be biosimilar to or interchangeable with an FDA-licensed biological product. |
| 24. |
Jonathan Rockoff, "Knockoffs of BioTech Drugs Bring Paltry Savings," The Wall Street Journal, May 5, 2016, at http://www.wsj.com/articles/knockoffs-of-biotech-drugs-bring-paltry-savings-1462458209. |
| 25. |
Retail inflation is a measure of the average change over time in prices for a set list of consumer goods and services The Consumer Price Index (CPI) is based on a market basket of goods and services. For prescription drugs, Department of Labor analysts survey a sample of drug stores and a list of the last 20 drugs dispensed. See http://www.bls.gov/cpi/cpifact4.htm. |
| 26. |
The CPI-U is the CPI value for urban consumers. It excludes rural populations and represents approximately 80% of the population. |
| 27. |
Murray Aitken et al., "Has the Era of Slow Growth for Prescription Drug Spending Ended?," Health Affairs, vol. 35, no. 9 (September 2016), pp. 1595-1603. The study looked at retail and institutional drug spending. |
| 28. |
HHS, "Understanding Recent Trends in Generic Drug Prices," January 27, 2016, at https://aspe.hhs.gov/pdf-report/understanding-recent-trends-generic-drug-prices. The study found that although some parts of the market had recently experienced large price increases, about two-thirds of generic products had price declines in 2014. |
| 29. |
Express Scripts, 2016 Drug Trend Report, Executive Summary, February 2017, p. 6. The Express Scripts drug price index is based on fixed baskets of commonly used brand-name and generic drugs, which are based on the top 80% of utilized drugs. |
| 30. |
Ibid. There is wide variation in estimates of specialty drug spending depending on how the specialty drug category is defined. For example, see HHS, Office of the Assistant Secretary for Planning and Evaluation, "Observations on Trends in Prescription Drug Spending," March 8, 2016, at https://aspe.hhs.gov/sites/default/files/pdf/187586/Drugspending.pdf. |
| 31. |
The essential health benefits are 10 categories of services required by private plans offered in the nongroup and small-group markets. The requirement to offer the essential health benefits does not apply to large-group plans, self-insured plans, or grandfathered plans. CRS Report R44163, The Patient Protection and Affordable Care Act's Essential Health Benefits (EHB). |
| 32. |
Express Scripts, "Exchange Pulse," June 2016, at http://lab.express-scripts.com/lab/publications/exchange-pulse-public-exchanges-report-june-2016. |
| 33. |
The ACA raised the income threshold used to qualify individuals for the Medicaid program, thereby expanding coverage to more people. The ACA originally made the state Medicaid expansion mandatory, but the Supreme Court found that the enforcement mechanism for the expansion was unconstitutional, basically rendering it voluntary. Although prescription drug coverage is an optional Medicaid benefit, all states include drug coverage. See CRS In Focus IF10399, Overview of the ACA Medicaid Expansion. |
| 34. |
Medicaid and CHIP Payment and Access Commission (MACPAC), "Medicaid Spending for Prescription Drugs," January 2016, p. 6, at https://www.macpac.gov/wp-content/uploads/2016/01/Medicaid-Spending-for-Prescription-Drugs.pdf. Drug spending rose 24.6% in expansion states compared to 14.1% in non-expansion states in 2014. Also see "National Health Spending: Faster Growth In 2015 As Coverage Expands and Utilization Increases," Health Affairs, vol. 26, no. 1 (January 2017). |
| 35. |
IQVIA Institute, "Medicines Use and Spending in the U.S., a Review of 2016 and Outlook to 2021," May 2017. Available for download at https://www.iqvia.com/institute/reports/medicines-use-and-spending-in-the-us-a-review-of-2016. |
| 36. |
CMS, "National Health Expenditure Projections 2017-2026," Table 11, at https://www.cms.gov/Research-Statistics-Data-and-Systems/Statistics-Trends-and-Reports/NationalHealthExpendData/NationalHealthAccountsProjected.html. The NHE accounts spell out how much consumers pay each year to fill retail prescriptions including cash purchases and insurance deductibles, co-payments, and coinsurance. Annual insurance premiums are not included in out-of-pocket spending. |
| 37. |
IMS, "Emergence and Impact of Pharmacy Deductibles: Implications for Patients in Commercial Health Plans," November 2015, at https://www.iqvia.com/-/media/iqvia/pdfs/institute-reports/emergence-and-impact-of-pharmacy-deductibles.pdf?la=uk-ua&hash=4F79107A4E0D959A57B8A3383691F7B4C6F6EE98. |
| 38. |
Jon Gabel et al., Commonwealth Fund, "Changes in Consumer Cost-Sharing for Health Plans Sold in the ACA's Insurance Marketplaces, 2015 to 2016," Exhibit 6, May 20, 2016, at http://www.commonwealthfund.org/~/media/files/publications/issue-brief/2016/may/1875_gabel_changes_cost_sharing_marketplaces_rb_v2.pdf. In 2016, 26% of exchange-based platinum plans, 44% of gold plans, 54% of silver plans, and 82% of bronze plans required enrollees to meet a deductible before prescription drug coverage began. Plans are listed in order from most comprehensive (platinum) to least comprehensive (bronze). |
| 39. |
Kaiser Family Foundation, Employer Health Benefits: 2017 Annual Survey, Chapter 9, at https://www.kff.org/report-section/ehbs-2017-section-9-prescription-drug-benefits/. The Kaiser data indicate that the differential has increased, but 2017 is not directly comparable to some previous years due to a change in methodology. |
| 40. |
Departments of Labor, HHS, and the Treasury, "FAQS About Affordable Care Act Implementation Part 36," January 9, 2017, at https://www.cms.gov/CCIIO/Resources/Fact-Sheets-and-FAQs/Downloads/ACA-FAQs-Part36_1-9-17-Final.pdf. |
| 41. |
See IMS, Medicines Use and Spending in the U.S.: A Review of 2015 and Outlook to 2020, p. 28, April 2016, at http://www.imshealth.com/en/thought-leadership/ims-institute/reports/medicines-use-and-spending-in-the-us-a-review-of-2015-and-outlook-to-2020. |
| 42. |
|
| 43. |
Stacie B. Dusetzina1, "Share Of Specialty Drugs In Commercial Plans Nearly Quadrupled, 2003–14," Health Affairs, vol. 35 no. 7, July 2016 , pp. 1241-1246. Dollar figures were inflation-adjusted to 2014 levels. Mean spending for specialty drugs rose from $41 in 2003 to $77 in 2014, while mean spending on nonspecialty medications decreased from $19 to $11. |
| 44. |
CMS, "National Health Expenditure Projections 2017-2026," Table 11, at https://www.cms.gov/Research-Statistics-Data-and-Systems/Statistics-Trends-and-Reports/NationalHealthExpendData/NationalHealthAccountsProjected.html. |
| 45. |
For example, the federal government subsidizes about 75% of the basic Medicare Part D benefit. See CRS Report R40611, Medicare Part D Prescription Drug Benefit. |
| 46. |
CMS, "National Health Expenditure Projections 2017-2026," Table 11, at https://www.cms.gov/Research-Statistics-Data-and-Systems/Statistics-Trends-and-Reports/NationalHealthExpendData/NationalHealthAccountsProjected.html. |
| 47. |
See "Is U.S. Prescription Drug Spending Higher Than in Other Nations?" |
| 48. |
Beginning with the Food and Drugs Act of 1906, Congress has incrementally refined and expanded FDA's responsibilities regarding drug approval and regulation. CRS Report R41983, How FDA Approves Drugs and Regulates Their Safety and Effectiveness. See, in particular, Federal Food, Drug, and Cosmetic Act (FFDCA) §§505 (new drugs), 501 (adulteration), and 502 (misbranding). For an easier-to-read description, see CRS Report R41983, How FDA Approves Drugs and Regulates Their Safety and Effectiveness. |
| 49. |
HHS, Office of Inspector General (OIG), "Medicaid Rebates for Brand-Name Drugs Exceeded Part D Rebates by a Substantial Margin," April 2015, at http://oig.hhs.gov/oei/reports/oei-03-13-00650.pdf. Medicare Part D rebates were a smaller 15% of drug spending in 2012, according to the HHS OIG. |
| 50. |
|
| 51. |
Part D plans must provide coverage that is at least equivalent to a set standard benefit, which is set and updated annually by HHS. Part D plans also may offer more generous coverage. |
| 52. |
CRS Report R40611, Medicare Part D Prescription Drug Benefit. |
| 53. |
§1860D-11(i) of the Social Security Act. The actual wording of the noninterference provision is that "In order to promote competition under this part and in carrying out this part, the Secretary (1) may not interfere with the negotiations between drug manufacturers and pharmacies and PDP sponsors; and (2) may not require a particular formulary or institute a price structure for the reimbursement of covered Part D drugs." A PDP is a stand-alone Part D drug plan. Medicare beneficiaries also may obtain Part D benefits as part of a Medicare Advantage plan, or an MA-PD. |
| 54. |
Although Part D does not have a central formulary, Part D plans are required to cover at least two distinct drugs in each class and category, as defined by U.S. Pharmacopeial Convention (USP), an independent scientific organization. In addition, all Part D plans must cover substantially all drugs in six protected classes: immunosuppressant, antidepressant, antipsychotic, anticonvulsant, antiretroviral, and antineoplastic. The HHS Secretary may change the six protected classes through formal rulemaking, based on scientific evidence. |
| 55. |
For a more detailed discussion, see CRS Report R40611, Medicare Part D Prescription Drug Benefit. In general, the lower spending has been due to less robust enrollment than predicted, as well slower growth in national drug spending. Spending is forecast to accelerate in coming years. The Congressional Budget Office (CBO) has said that it is not possible to determine whether the competitive structure of Part D was more or less successful than originally expected in affecting program spending. |
| 56. |
Boards of Trustees, Federal Hospital Insurance and Federal Supplementary Medical Insurance Trust Funds, 2017 Annual Report of the Boards of Trustees of the Federal Hospital Insurance and Federal Supplementary Medical Insurance Trust Funds, Table IV.B8, p. 144, at https://www.cms.gov/Research-Statistics-Data-and-Systems/Statistics-Trends-and-Reports/ReportsTrustFunds/index.html. Note that an HHS OIG report put Part D rebates at 15% of Part D spending in 2012, which differs slightly from the trustees data. |
| 57. |
CBO, Competition and the Costs of Medicare's Prescription Drug Program, July 2014, at https://www.cbo.gov/sites/default/files/113th-congress-2013-2014/reports/45552-PartD.pdf. |
| 58. |
CBO found that net Medicaid prices were lower than Part D prices due largely to Medicaid statutory rebates on brand-name drugs, including required rebates when prices rise faster than the rate of retail inflation. CBO, Competition and the Costs of Medicare's Prescription Drug Program, July 2014, at https://www.cbo.gov/sites/default/files/113th-congress-2013-2014/reports/45552-PartD.pdf; HHS OIG, "Medicaid Rebates for Brand-Name Drugs Exceeded Part D Rebates by a Substantial Margin," April 2015, at http://oig.hhs.gov/oei/reports/oei-03-13-00650.pdf; and Government Accountability Office, "Comparison of DOD, Medicaid, and Medicare Part D Retail Reimbursement Prices," June 30, 2014, at http://www.gao.gov/products/GAO-14-578. |
| 59. |
HHS OIG, "Medicaid Rebates for Brand-Name Drugs Exceeded Part D Rebates by a Substantial Margin," April 2015, at http://oig.hhs.gov/oei/reports/oei-03-13-00650.pdf; and Government Accountability Office, "Comparison of DOD, Medicaid, and Part D Retail Reimbursement Prices," June 2014, at http://www.gao.gov/assets/670/664521.pdf. |
| 60. |
Program data indicate that the Part D market is dominated by a small number of health payers. According to the Medicare Payment Advisory Commission (MedPAC), in 2017 the top 9 organizations ranked by enrollment and a group of 14 Blue Cross and Blue Shield companies that collectively own their own pharmacy benefit managers , together accounted for 84% of Part D enrollment, up from 61% in 2007. The two largest insurers, Unitedhealth and Humana, had 40% of the market. MedPAC, Report to Congress: Medicare Payment Policy, March 2018, p. 411, available at http://medpac.gov/-documents-/reports. |
| 61. |
The House passed the measure by a vote of 255-170 on January 12, 2007. See http://clerk.house.gov/evs/2007/roll023.xml. For a text of the bill, see https://www.congress.gov/bill/110th-congress/house-bill/4/text. |
| 62. |
CBO Letter to Rep. John Dingell, January 10, 2007, at https://www.cbo.gov/sites/default/files/cbofiles/ftpdocs/77xx/doc7722/hr4.pdf. See also CBO letter to Senator Ron Wyden, April 10, 2007, at https://www.cbo.gov/sites/default/files/110th-congress-2007-2008/reports/drugpricenegotiation.pdf. |
| 63. |
Letter to Congress from Coalition of Consumer and Health Care Groups, March 18, 2013, at http://www.nam.org/Issues/Health-Care/Letter-to-Congress-to-Protect-Medicare-Part-D(1)/. See also https://www.cbo.gov/sites/default/files/110th-congress-2007-2008/costestimate/s30.pdf. |
| 64. |
Legislation in the 114th Congress included H.R. 4207, H.R. 3061, S. 31, and S. 1884. In the 115th Congress, measures include S. 41. The measures vary from giving the Secretary authority to negotiate prices for all Part D drugs, to allowing negotiations only for sole-source drugs, to allowing the Secretary to negotiate prices and set formularies for special Part D plans that would be open to all enrollees on a national basis. |
| 65. |
HHS, "FY2017 Budget in Brief, CMS, Medicare," at http://www.hhs.gov/about/budget/fy2017/budget-in-brief/cms/medicare/index.html. As part of the negotiations, manufacturers would be required to supply HHS with cost and clinical data and any other information needed to reach a price agreement. The proposal was also part of the Obama Administration's FY2016 budget proposal. |
| 66. |
HHS, "FY2019 Budget in Brief, CMS, Medicare," at https://www.hhs.gov/about/budget/index.html#bib. |
| 67. |
For example, see S. 252, the Medicare Drug Savings Act of 2017. |
| 68. |
CBO, Budget Options, "Require Manufacturers to Pay a Minimum Rebate on Drugs Covered Under Part D of Medicare for Low-Income Beneficiaries," at https://www.cbo.gov/budget-options/2016/52239. |
| 69. |
|
| 70. |
CA AB 339 was signed by Governor Jerry Brown on October 8, 2015. For the text of the bill, see https://leginfo.legislature.ca.gov/faces/billNavClient.xhtml?bill_id=201520160AB339. |
| 71. |
Senate Bill 35, 147th General Assembly, Delaware, at http://legis.delaware.gov/BillDetail?LegislationId=22620. See also Connecticut Office of Legislative Research, "State Laws Limiting Prescription Drug Cost Sharing," July 13, 2016, at https://www.cga.ct.gov/2016/rpt/pdf/2016-R-0134.pdf. |
| 72. |
|
| 73. |
LaVita Tuff, "Trending Now: State Legislation that Bans Pharmacy Benefit Managers' 'Gag Clauses,'" National Academy for State Health Policy, January 30, 2018, at https://nashp.org/trending-now-state-legislation-that-bans-pharmacy-benefit-managers-gag-clauses/. |
| 74. |
|
| 75. |
Quintiles IMS Institute (now IQVIA), Outlook for Global Medicines through 2021, December 2016, at https://www.iqvia.com/institute/reports/reports-archive. The data include drugs dispensed in retail pharmacies and drugs used in hospital or clinic settings. |
| 76. |
Ibid. |
| 77. |
Organisation for Economic Co-operation and Development (OECD), Health at a Glance 2017, Chapter 10, at http://www.oecd-ilibrary.org/social-issues-migration-health/health-at-a-glance_19991312. OECD numbers include retail drug spending, including both prescribed drugs and over-the-counter products. According to the OECD, over-the-counter sales account for about 20% of retail drug spending. Including drugs dispensed in hospitals and other institutions could add another 10%-20% in spending, based on the specific country. |
| 78. |
|
| 79. |
Panos Kanavos et al., "Higher U.S. Branded Drug Prices and Spending Compared to Other Countries May Stem Partly from Quick Uptake of New Drugs," Health Affairs, vol. 32, no. 4 (April 2013), pp. 753-761. |
| 80. |
European Commission, Study on Enhanced Cross-County Coordination in the Area of Pharmaceutical Product Pricing, by Gesundheit Österreich Forschung-und Planungs GmbH, December 2015, at http://ec.europa.eu/health//sites/health/files/systems_performance_assessment/docs/pharmaproductpricing_frep_en.pdf. According to the report, reference pricing has limitations, including providing incentives for companies to launch medicines in countries with a high price level. |
| 81. |
Vallerie Paris, and Annalisa Belloni, "Value in Pharmaceutical Pricing," OECD Health Working Papers, No. 63, 2013, at http://dx.doi.org/10.1787/5k43jc9v6knx-en. |
| 82. |
CADTH Common Drug Review (CDR), at https://www.cadth.ca/about-cadth/what-we-do/products-services/cdr. |
| 83. |
|
| 84. |
CMS, "Medicaid Drug Rebate Program Notice," Release No. 99, July 14, 2016, at https://www.medicaid.gov/Medicaid-CHIP-Program-Information/By-Topics/Prescription-Drugs/Downloads/Rx-Releases/MFR-Releases/mfr-rel-099.pdf; and Stephen Barlas,"Value Purchasing Programs Make Plodding Progress, Drug Manufacturers Question Some Pay-for-Performance Methodologies," P & T, vol. 41, no. 9 (September 2016), at https://pharmscope.com/journal/article/full/2016/09/562/value-purchasing-programs-make-plodding-progress. |
| 85. |
Institute for Clinical and Economic Review (ICER), "ICER Launches New Drug Assessment Program with $5.2 Million Award from the Laura and John Arnold Foundation," July 21, 2015, http://icer-review.org/announcements/icer-ljaf-drug-assessment-announcement/. |
| 86. |
PhRMA, "ICER Framework Threatens to Halt Continued Progress Against Multiple Myeloma," May 26, 2016. |
| 87. |
|
| 88. |
Hamilton Moses et al., "The Anatomy of Medical Research: U.S. and International Comparisons," JAMA, vol. 313, no. 2 (January 13, 2015), pp. 174-189. |
| 89. |
Recombinant DNA is the joining of DNA molecules from different species in a host organism to produce a new genetic combination. Publicly funded research played an instrumental role in the development of recombinant DNA beginning in the 1970s. |
| 90. |
Joseph A. DiMasi, Ronald W. Hansen, Henry G. Grabowski, "The Price of Innovation: New Estimates of Drug Development Costs," Journal of Health Economics, vol. 22 (2003), pp. 151-185. |
| 91. |
Kenneth I. Kaitin, Natalie R. Bryant, Louis Lasagna, "The Role of the Research-Based Pharmaceutical Industry in Medical Progress in the United States," Journal of Clinical Pharmacology, vol. 33, no. 5 (May 1993), pp. 412-417. |
| 92. |
FDA, "New Drugs at FDA: CDER's New Molecular Entities and New Therapeutic Biological Products," at http://www.fda.gov/Drugs/DevelopmentApprovalProcess/DrugInnovation/ucm20025676.htm. |
| 93. |
Robert Kneller, "The Importance of New Companies for Drug Discovery: Origins of a Decade of New Drugs," Nature Review Drug Discovery, vol. 9 (2010), pp. 867-882. |
| 94. |
Ashley J. Stevens et al., "The Role of Public-Sector Research in the Discovery of Drugs and Vaccines," The New England Journal of Medicine, vol. 364, no. 6 (February 10, 2011), pp. 535-541. |
| 95. |
Ibid, p. 539. |
| 96. |
FDA, "Priority Review" at http://www.fda.gov/ForPatients/Approvals/Fast/ucm405405.htm. A priority review designation means FDA's goal is to take action on an application within 6 months (compared to 10 months under standard review). |
| 97. |
Ashley J. Stevens et al., "The Role of Public-Sector Research in the Discovery of Drugs and Vaccines," The New England Journal of Medicine, vol. 364, no. 6 (February 10, 2011), p. 541. |
| 98. |
Ibid., p. 537. |
| 99. |
Ekaterina Galkina Cleary et al., "Contribution of NIH Funding to New Drug Approvals 2010-2016," PNAS, vol. 115, no. 10 (March 6, 2018), pp. 2329-2334. |
| 100. |
Ibid., p. 2333 |
| 101. |
Tufts Center for the Study of Drug Development, "Cost to Develop and Win Marketing of a New Drug is $2.6 Billion," November 18, 2014, at http://csdd.tufts.edu/news/complete_story/pr_tufts_csdd_2014_cost_study. |
| 102. |
Tufts Center for the Study of Drug Development, "Tufts CSDD Assessment of Cost to Develop and Win Marketing Approval for a New Drug Now Published," March 10, 2016, at http://csdd.tufts.edu/news/complete_story/tufts_csdd_rd_cost_study_now_published. The figure rises to $2.9 billion when FDA-mandated post-approval costs (such as additional testing and monitoring) are added, according to Tufts. The study was based on data provided by 10 pharmaceutical companies on 106 randomly selected drugs that were first tested in human subjects anywhere in the world from 1995 to 2007. |
| 103. |
See Joseph DiMasi, Ronald Hansen, and Henry Grabowski, "The Price of Innovation: New Estimates of Drug Development Costs," Journal of Health Economics, Vol. 22 (2003), pp. 151–185, at http://fds.duke.edu/db?attachment-25—1301-view-168. |
| 104. |
Tufts Center for the Study of Drug Development, "Tufts CSDD R&D Cost Study Includes Link to Questions and Answers About Study and Methodology," at http://csdd.tufts.edu/news/complete_story/cost_study_press_event_webcast. |
| 105. |
|
| 106. |
For example, in Congress see S. 3335, which would require drug manufacturers to notify HHS and provide cost data before increasing the price of certain drugs by more than 10%. In states, see National Conference of State Legislatures, "2015-2016 State Legislation to Require Prescription Drug Cost and Price Transparency," at http://www.ncsl.org/documents/health/2015-16_Legislation_Cost_Transparency_Prescription_Drugs-Nov.pdf. |
| 107. |
U.S. Congress, Senate Committee on Finance, The Price of Sovaldi and its Impact on the U.S. Health Care System, 114th Cong., 1st sess., S.Rept. 114-20, December 2015, Executive Summary, at http://www.finance.senate.gov/imo/media/doc/11%20SFC%20Sovaldi%20Report%20Executive%20Summary.pdf. |
| 108. |
Jonathan D. Rockoff, "How Pfizer Set the Cost of Its New Drug at $9,850 a Month," Wall Street Journal, December 9, 2015, at http://www.wsj.com/articles/the-art-of-setting-a-drug-price-1449628081 (by subscription). |
| 109. | The Federal Food, Drug, and Cosmetic Act (21 U.S.C. §301) is the main source of the FDA authority to regulate drug ads. The 1962 Kefauver-Harris amendments ( |
| 110. |
178 FDA has issued regulations over the years that have broadened drugmakers |
| 111. | .
179 The ACA included |
| 112. | .
180 Julie Donohue, |
| 113. | .
181 See FDA, |
| 114. |
Ibid. |
| 115. | .
182 Ibid. 183 Pharmaceutical direct-to-consumer advertising is estimated by firms including IMS Health, Kantar Media, and Nielsen. Spending estimates vary, but the data sets show similar trends. See |
| 116. | .
184 Elizabeth Wilner |
| 117. |
Ibid. According to Kantar, the number of brand-name drugs with at least $500,000 of annual advertising rose from 147 in 2012 to 215 in 2015. |
| 118. |
|
| 119. |
|
| 120. | .
188 Government Accountability Office, |
| 121. | . 189 Helen Sullivan and Margaret Campbell, |
| 122. | .
190 American Medical Association, |
| 123. | .
191 States News Services, |
| 124. | The Supreme Court has held that the Constitution affords less protection to commercial speech than other constitutionally safeguarded forms of expression. Commercial speech is |
| 125. |
H.R. 4565 (114th Congress), the Responsibility in Drug Advertising Act of 2016. |
| 126. |
193 H.R. 4106, S. 3180 (116th Congress), the Responsibility in Drug Advertising Act of 2019. 194 FDA reviews clinical evidence before approving drugs, but other indications and concerns can arise after drugs have been on the market. A 2016 study found that prescription drug television advertising increased online searches and clicks on information for advertised drugs, but there is also an association between DTC ads and consumer clicks on promotional, rather than informational, websites. See Matthew Chesnes and Ginger Zhe Jin, |
| 127. | .
195 Institute of Medicine, |
| 128. | .
196 Ira Teinowitz, |
| 129. |
S. 2623 (114th Congress), the Protecting Americans from Drug Marketing Act. |
| 130. |
CRS In Focus IF10201, The Tax Reform Act of 2014. |
| 131. |
See, in particular, FFDCA §§505 (new drugs), 501 (adulteration), and 502 (misbranding). For an easier-to-read description, see CRS Report R41983, How FDA Approves Drugs and Regulates Their Safety and Effectiveness. |
| 132. |
FDA approves drugs under the authority of the FFDCA; it licenses biologics under the authority of the PHSA. Most of FDA's regulations consider drugs and biologics together and refer to the group as drugs. |
| 133. |
The law was enacted to reduce the risk of adulterated or subpotent drugs entering the United States after concern about the resale of manufacturer drug samples and other situations. |
| 134. |
FFDCA §804(l). |
| 135. |
Imported pharmaceuticals that do not meet U.S. standards are considered "unapproved" drugs and cannot be imported legally. |
| 136. |
§749, H.R. 5384, in the 109th Congress. |
| 137. |
FDA, "Information on Importation of Drugs," prepared by Marvin A. Blumberg, Division of Import Operations and Policy, Office of Regulatory Affairs, FDA, HFC-170, April 3, 1998, page last updated September 25, 2015, at http://www.fda.gov/forindustry/importprogram/ucm173751.htm. |
| 138. |
HHS Task Force on Drug Importation, Report on Prescription Drug Importation, December 2004, at http://archive.hhs.gov/importtaskforce/Report1220.pdf. |