The Earned Income Tax Credit (EITC): How It Works and Who Receives It
Changes from April 18, 2018 to August 7, 2020
This page shows textual changes in the document between the two versions indicated in the dates above. Textual matter removed in the later version is indicated with red strikethrough and textual matter added in the later version is indicated with blue.
Contents
- Introduction
- Did P.L. 115-97 modify the EITC?
- Eligibility for the EITC
- Filing a Federal Income Tax Return
- Earned Income
- Residency Requirements
- Qualifying Children
- Age Requirements for EITC Recipients with No Qualifying Children
- Investment Income
- Disallowance of the EITC Due to Fraud or Reckless Disregard of Rules
- Identification Requirements
- Calculating the EITC
- Income Limits for the EITC
- Payment of the EITC
- Interaction with Other Tax Provisions
- Treatment of the EITC for Need-Tested Benefit Programs
- Modifications to the EITC Made Permanent by P.L. 114-113
- Participation and Benefits
- Trends in Participation and EITC Benefits
- Participation and EITC Amounts Claimed for 2015
- Number of Qualifying Children
- Income Level
- Filing and Marital Status
- Region
Figures
- Figure 1. Maximum EITC by Number of Qualifying Children: 2018
- Figure 2. Amount of the EITC for an Unmarried Tax Filer with One Child, 2018
- Figure 3. Number of Tax Filers Claiming the EITC: 1975 to 2015
- Figure 4. EITC Claimed on Federal Income Tax Returns: 1975-2015
- Figure 5. Average EITC Claimed: 1975 to 2015
- Figure 6. Total EITC Dollars Claimed for 2015, by Number of Qualifying Children
- Figure 7. Number of Tax Returns with EITC Claims for 2015, by Number of Qualifying Children
- Figure 8. Average EITC Claimed by Tax Filers in 2015 by Number of Qualifying Children
- Figure 9. Number of Returns Claiming the EITC and Average EITC Claimed for 2015, by Adjusted Gross Income
- Figure 10. Estimate of EITC Dollars Claimed by Marital Status, 2015
- Figure 11. Percentage of Tax Returns Claiming the EITC by State for 2015
Tables
- Table 1. EITC Tax Parameters by Marital Status and Number of Qualifying Children for 2018
- Table 2. Maximum AGI to Qualify for the EITC, by Number of Qualifying Children and Filing Status in 2018
- Table A-1. EITC Tax Filers and Dollars Claimed: 1975-2015
- Table A-2. Average EITC, Number of Returns with EITC Claimed, and Total EITC Benefits for 2015, by Adjusted Gross Income
- Table A-3. Total EITC Returns and Amounts for 2015, by State
Appendixes
Summary
The Earned Income Tax Credit (EITC): How It
August 7, 2020
Works and Who Receives It
Margot L. Crandall-Hollick
The Earned Income Tax Credit (EITC) is a refundable tax credit available to eligible workers
Acting Section Research
earning relatively low wages. Because the credit is refundable, an EITC recipient need not owe
Manager
taxes to receive the benefit. Eligibility for and the amount of the EITC are based on a variety of
factors, including residence and taxpayer ID requirements, the presence of qualifying children,
age requirements for childless recipients, and the recipient'’s investment income and earned income. Tax filers
Gene Falk Specialist in Social Policy
income. Taxpayers with income above certain thresholds—these thresholds are based on marital
status and number of qualifying children—are ineligible for the credit.
The EITC varies based on a recipient's earnings’s earned income. Specifically, the EITC equals a fixed percentage (the "credit rate") of earned income phases in as a percentage of earned income (the “credit rate”) until the credit amount reaches its maximum level. The EITC then remains at
its maximum level over a subsequent range of earned income, between the "“earned income amount"” and the "phase-out “phaseout
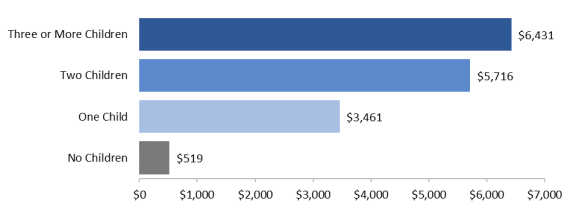
amount threshold."” Finally, the credit gradually decreases to zero at a fixed rate (the "phase-out rate"“phaseout rate”) for each additional dollar of adjusted gross income (AGI) (or earned income, whichever is greater) above the phase-outphaseout amount threshold. The specific values of these EITC parameters (e.g., credit rate, earned income amount) vary depending on several factors, including the number of qualifying children a tax filer has and his or her marital status. For the 2018 tax year, the maximum EITC for a tax filer without children is $519 per year. In contrast, the 2018 maximum EITC for a tax filer with one child is $3,461 per year; for two children, $5,716taxpayer has and the taxpayer’s marital status, as illustrated below. For 2020, the maximum EITC for a taxpayer without children is $538 per year. In contrast , the 2020 maximum EITC for a taxpayer with one child is $3,584 per year; for two children, $5,920 per year; and for three or more children, $6,431660 per year.
EITC Amount by Number of Qualifying Children, Marital Status, and Income, 2020
Source: IRS Revenue Procedure 2019-44 and Internal Revenue Code §32. For more information see Table 1.
The EITC is provided to individuals and families once a year, in a lump-sum payment after individuals and families file their federal income tax returns. Like all tax credits, the EITC can reduce income tax liability. And because the EITC is a
refundable tax credit, if a taxpayer’s EITC is greater than what they owe in income taxes, they can receive the difference (t he portion of the credit that remains after offsetting any income tax liability) as part of their annual tax refund. The amount of the credit that remains after offsetting any income tax liability is often referred to as the refundable portion of the EITC, whereas the amount that reduces income tax liability is referred to as the nonrefundable portion of the credit. A taxpayer who has no income tax liability will receive all of the EITC as the refundable portion of the credit.
Congressional Research Service
The Earned Income Tax Credit (EITC): How It Works and Who Receives It
The amount of the credit a taxpayer receives is based on the prior year’s earned income and family composit ion (marital status and number of qualifying children). In other words, the 2020 EITC—which is based on 2020 earned income (and other 2020 factors)—will not be paid until 2021.
The EITC cannot be counted as income in determining eligibility for or the amo unt per year.
Two temporary modifications to the EITC were enacted as part of the American Recovery and Reinvestment Act of 2009 (ARRA; P.L. 111-5), extended by P.L. 111-312 and P.L. 112-240, and made permanent by the Protecting Americans from Tax Hikes (PATH) Act (Division Q of P.L. 114-113). The first modification was a larger credit for families with three or more children, while the second reduced the EITC's marriage penalty.
The EITC is provided to individuals and families once a year, in a lump sum payment after individuals and families file their federal income tax returns. The credit may be received in one of three ways: (1) a reduction in federal tax liability; (2) a refund from the Treasury if the tax filer has no income tax liability; or (3) a combination of a reduced federal tax liability and a refund. The amount of the credit a tax filer receives is based on the prior year's income, earnings, and family composition (marital status and number of qualifying children). That is, the EITC earned based on 2018 earned income will not be paid until 2019.
The EITC cannot be counted as income in determining eligibility for or the amount of any federally funded public benefit program. An EITC refund that is saved by a tax filertaxpayer does not count against the resource limits of any federally funded public benefit program for 12 months after the refund is received.
For tax year 2015 (
For 2017 (i.e., 2017 tax returns filed in 2016), a total of $68.5 billion was claimed by 28.1 million tax filers (19% of all tax filers), making the EITC2018), 27 million taxpayers (18% of all taxpayers) received a total of $66.4 billion from the EITC, making the credit the largest need-tested antipoverty cash assistance programprogram that provides cash benefits. In that year, 97% of all EITC dollars were claimedreceived by families with children. However, there was considerable variation in the share of returns claiming the EITCEITC receipt by state, with a greater share filed in certain southern states compared to other regions of the country.
Congressional Research Service
link to page 6 link to page 6 link to page 7 link to page 7 link to page 8 link to page 8 link to page 9 link to page 9 link to page 9 link to page 10 link to page 10 link to page 13 link to page 14 link to page 14 link to page 16 link to page 16 link to page 16 link to page 19 link to page 19 link to page 21 link to page 23 link to page 24 link to page 11 link to page 12 link to page 17 link to page 18 link to page 19 link to page 20 link to page 21 link to page 21 link to page 23 link to page 23 link to page 24 link to page 24 link to page 25 The Earned Income Tax Credit (EITC): How It Works and Who Receives It
Contents
Introduction ................................................................................................................... 1 Eligibility for the EITC .................................................................................................... 1
Filing a Federal Income Tax Return .............................................................................. 2 Earned Income .......................................................................................................... 2 Residency Requirements............................................................................................. 3 Qualifying Children ................................................................................................... 3 Age Requirements for EITC Recipients with No Qualifying Children ................................ 4
Investment Income .................................................................................................... 4 Disallowance of the EITC Due to Fraud or Reckless Disregard of Rules ............................ 4 Identification Requirements ........................................................................................ 5
Calculating the EITC ....................................................................................................... 5
Income Limits for the EITC ........................................................................................ 8
Payment of the EITC ....................................................................................................... 9
Interaction with Other Tax Provisions ........................................................................... 9 Treatment of the EITC for Need-Tested Benefit Programs.............................................. 11
Data on EITC Receipt.................................................................................................... 11
Trends in EITC Receipt from 1975 to 2017.................................................................. 11
EITC Receipt for 2017 ............................................................................................. 14
By Number of Qualifying Children ....................................................................... 14 By Income Level ................................................................................................ 16 By Filing and Marital Status ................................................................................ 18 By Region ......................................................................................................... 19
Figures Figure 1. Maximum EITC by Number of Qualifying Children, 2020 ....................................... 6 Figure 2. EITC for an Unmarried Taxpayer with One Child by Income, 2020 ........................... 7 Figure 3. Number of Tax Returns with the EITC, 1975-2017................................................ 12 Figure 4. Total EITC Dollars, 1975-2017 .......................................................................... 13 Figure 5. Average EITC, 1975-2017 ................................................................................. 14 Figure 6. Distribution of Total EITC Dollars by Number of Qualifying Children, 2017 ............ 15 Figure 7. Number of Tax Returns with the EITC by Number of Qualifying Children, 2017 ....... 16 Figure 8. Average EITC by Number of Qualifying Children, 2017 ........................................ 16 Figure 9. Number of Tax Returns with the EITC and Average EITC by Adjusted Gross
Income (AGI), 2017 ................................................................................................... 18
Figure 10. Distribution of Total EITC Dollars by Marital Status and Number of
Qualifying Children, 2017 ........................................................................................... 19
Figure 11. Percentage of Tax Returns with the EITC by State, 2017 ...................................... 20
Congressional Research Service
link to page 10 link to page 10 link to page 13 link to page 13 link to page 26 link to page 27 link to page 27 link to page 29 link to page 30 link to page 26 link to page 32 The Earned Income Tax Credit (EITC): How It Works and Who Receives It
Tables Table 1. EITC Tax Parameters by Marital Status and Number of Qualifying Children,
2020........................................................................................................................... 5
Table 2. Maximum AGI to Qualify for the EITC, by Number of Qualifying Children and
Filing Status, 2020........................................................................................................ 8
Table A-1. EITC Receipt, 1975-2017 ............................................................................... 21 Table A-2. Average EITC, Number of Tax Returns with the EITC, and Total EITC by
Qualifying Children and Adjusted Gross Income, 2017 .................................................... 22
Table A-3. EITC Receipt by State, 2017 ........................................................................... 24 Table A-4. EITC Participation Rates by State, 2009-2016 .................................................... 25
Appendixes Appendix. Additional Tables ........................................................................................... 21
Contacts Author Information ....................................................................................................... 27
Congressional Research Service
link to page 10 The Earned Income Tax Credit (EITC): How It Works and Who Receives It
Introduction
The Earned Income Tax Credit (EITC) is a
Did the “Tax Cuts and Jobs Act
refundable tax credit available to eligible
(TCJA)” modify the EITC?
workers with relatively low earnings. Because
At the end of 2017, President Trump signed into law
the credit is refundable, an EITC recipient
P.L. 115-97, commonly referred to as the Tax Cuts and
need not owe taxes to receive the benefit. The
Jobs Act or TCJA,1 which made numerous changes to
credit is authorized by Section 32 of the
the federal income tax for individuals and businesses.2
Internal Revenue Code (IRC §32) and
The final law did not make any direct changes to the EITC.
administered as part of the federal income tax
The law did however indirectly affect the credit’s value
system. According to IRS data, 27 mil ion
in future years. Parameters of the EITC (see Table 1)
taxpayers received a total of $66.4 bil ion
are indexed to inflation. Prior to P.L. 115-97, this
from the EITC for 2017, making the credit the
measure of inflation was based on the consumer price
largest need-tested antipoverty program that
index for urban consumers (CPI-U). P.L. 115-97
provides cash benefits.
changed this inflation measure to be permanently based
on the chained CPI-U (C-CPI-U).3 In comparison to
Under current law, the EITC is calculated
CPI-U, chained CPI-U tends to grow more slowly.
based on a recipient’with a greater share filed in certain southern states compared to other regions of the country.
Introduction
|
The Earned Income Tax Credit (EITC) is a refundable tax credit available to eligible workers with relatively low earnings. Because the credit is refundable, an EITC recipient need not owe taxes to receive the benefit. The credit is authorized by Section 32 of the Internal Revenue Code (IRC) and administered as part of the federal income tax system. For tax year 2015 (returns filed in 2016), a total of $68.5 billion was claimed by 28.1 million tax filers, making the EITC the largest need-tested antipoverty cash assistance program.
Under current law, the EITC is calculated based on a recipient's earned income, using s earned income, using
Hence, over time, the monetary parameters of the EITC wil increase more slowly.
one of eight different formulas, which vary
depending on several factors, including the number of qualifying children a tax filertaxpayer has (zero, one, two, or three or more) and his or her marital status (unmarried or married). All Al else being equal, the amount of the credit tends to increase with the number of eligible children the EITC claimantrecipient has. Indeed, most of the benefits of the EITCEITC’s
benefits—97% of EITC dollars for 2015—go2017—went to families with children.
to families with children.
Two temporary modifications to the EITC were enacted under the American Recovery and Reinvestment Act of 2009 (ARRA; P.L. 111-5), extended by P.L. 111-312 and P.L. 112-240, and made permanent by the Protecting Americans from Tax Hikes (PATH) Act (Division Q of P.L. 114-113). The first modification was a larger credit for families with three or more children, while the second reduced the EITC's marriage penalty.
This report provides an overview of the EITC, first discussing eligibility requirements for the credit, followed by how the credit is computed and paid. The report then provides data on the growth of the EITC since it was first enacted in 1975. FinallyFinal y, the report concludes with data on
the EITC claimed on 2015from 2017 tax returns, examining EITC claimsreceipt by number of qualifying children,
income level, tax filing status, and location of residence.
Eligibility for the EITC
A tax filer must fulfill A taxpayer must fulfil the following requirements to claim the EITC:
1. The tax filer1. The taxpayer must file a federal income tax return.42. The tax filer2. The taxpayer must have earned income.3. The tax filer3. The taxpayer must meet certain residency requirements.4. The tax filer'1 T he original title of the law, the T ax Cuts and Jobs Act, was stricken before final passage because it violated what is known as the Byrd rule, a procedural rule that can be raised in the Senate when bills, like the tax bill, are considered under the process of reconciliation. T he actual title of the law is “T o provide for reconciliation pursuant to titles II and V of the concurrent resolution on the budget for fiscal year 2018.” For more information on the Byrd rule, see CRS Report RL30862, The Budget Reconciliation Process: The Senate’s “Byrd Rule”, by Bill Heniff Jr., T he Budget Reconciliation Process: T he Senate’s “Byrd Rule”, by Bill Heniff Jr. 2 For more information on the changes made to the tax code by P.L. 115-97, see CRS Report R45092, The 2017 Tax Revision (P.L. 115-97): Com parison to 2017 Tax Law, coordinated by Molly F. Sherlock and Donald J. Marples. 3 For more information, see Michael Ng and David Wessel, Up Front | The Hutchins Center Explains: The Chained CPI, T he Brookings Institution, December 7, 2017, https://www.brookings.edu/blog/up-front/2017/12/07/the-hutchins-center-explains-the-chained-cpi/. Congressional Research Service 1 link to page 10 link to page 10 The Earned Income Tax Credit (EITC): How It Works and Who Receives It 4. The taxpayer’s children must meet relationship, residency, and age requirementss children must meet relationship, residency, and age requirementsto be considered qualifying children for the credit.5. Childless5. Childless workers who claim the credit must be between ages 25 and 64.4 (This age requirement does not apply to EITC claimants with qualifying children.) 6. The taxpayer’.)6. The tax filer's investment income must be below a certain amount.7. The tax filer7. The taxpayer must not bedisalloweddisal owed the credit due to prior fraud or reckless disregard of the rules when they previously claimed the EITC.8. The tax filer8. The taxpayer must provide the Social Security number (SSN) for themselves, their spouse, if married, and any children for whom the credit is claimed.
Additionally, a tax filer5
Additional y, a taxpayer with income above a certain dollar amount (labeled as "“income where credit = 0" in” in Table 1) will wil be ineligible for the credit. Given that this income level is dependent on the number of qualifying children and marital status of the tax filertaxpayer, this requirement is
discussed in greater detail in the section of the report entitled "“Calculating the EITC."
.” Requirements (1) through (8) are discussed in detail below.
Filing a Federal Income Tax Return
To be eligible for the EITC, a A person must file a federal income tax return to be eligible for the EITC. Those who do not file a
federal income tax return cannot receive the EITC.
The EITC can be claimed by taxpayers filing their tax return as married filing jointly, head of household, or single.5 Tax filers6 Taxpayers cannot claim the EITC if they use the filing status of married filing separately. If the tax filertaxpayer has a qualifying child, the tax filertaxpayer must include the child's ’s name and Social Security number on a separate schedule (Schedule EIC) filed with the federal tax return.6
return.7 Earned Income
A tax filer A taxpayer must have earned income to claim the EITC. Earned income for the EITC is defined as wages, tips, and other compensation included in gross income. It also includes net self-employment income (self-employment income after deduction of one-half of Social Security payroll taxes paid by a self-employed individual).
In addition, according to the Internal Revenue
Service, those who provide care for disabled individuals and receive certain nontaxable payments
4 A taxpayer without qualifying children who can be claimed as a dependent on another person’s tax return is ineligible for the EIT C. In addition, claimants without qualifying children must live in the United States for more than half the year. 5 T he SSN must be issued to a citizen of the United States or pursuant to a provision of the Social Security Act relating to the lawful admission for employment in the United States. See IRC §§32(m). 6 T here is an additional filing status that may claim the EIT C—“qualifying widow(er) with dependent child.” Generally, taxpayers may file their tax return as married filing jointly in the year their spouse died. A taxpayer may be eligible to use qualifying widow(er) with dependent child as his or her filing status for two years following the year his or her spouse died. T his filing status entitles the taxpayer to use joint return tax rates and the highest standard deduction amount (if he or she does not itemize deductions). It does not entitle the taxpayer to file a joint return. T he taxpayer calculates the EIT C using the formula for other unmarried tax filing statuses (head of household and single). T he eligibility rules for this filing status can be found on page 10 of IRS Publication 501, available at http://www.irs.gov/pub/irs-pdf/p501.pdf.
7 T he 2020 version of this form can be found at https://www.irs.gov/forms-pubs/about-schedule-eic-form-1040.
Congressional Research Service
2
The Earned Income Tax Credit (EITC): How It Works and Who Receives It
under a Medicaid waiver may treat those payments as earned income for the purposes of the
EITC.8
In addition, servicemembers may elect to include combat pay in their earned income when
In addition, servicemembers may elect to include combat pay in their earned income when calculating the EITC. All Al income earned by a member of the Armed Forces while in a designated combat zone is considered combat pay and is normallynormal y not included in taxable income. However, a taxpayera tax filer may elect to include combat pay as earned income for the purpose of calculating the EITC.9 General yEITC.7 Generally, servicemembers will wil make this election if it results in a larger credit. (Using
combat pay to calculate the EITC does not make the combat pay taxable income.)
Certain forms of income are not considered earned income for the purpose of the EITC. These include pension and annuity income, income of nonresident aliens not from a U.S. business, income earned while incarcerated for work in a prison, and TANF benefits paid in exchange for participation in work experience or community service activities.
Finally, tax filers
Final y, taxpayers who claim the foreign earned income exclusion (i.e., they file Form 2555 or
Form 2555EZ with their federal income tax return) are ineligible to claim the EITC.8
10 Residency Requirements
Under current law, an EITC recipient must be a resident of the United States, unless the recipient
resides in another country because of U.S. military service.
. Qualifying Children
An EITC recipient'’s qualifying child must meet three requirements.911 First, the child must have a specific relationship to the tax filertaxpayer (son, daughter, step child or foster child,1012 brother, sister, half-brother, half-sister, step brother, step sister, or descendent of such a relative). Second, the child must share a residence with the taxpayer for more than half the year in the United States.11 13
Third, the child must meet certain age requirements; namely, the child must be under the age of
19 (or age 24, if a full-time student) or be permanently and totally disabled.
total y disabled.
As a result of these three requirements, a child may be the qualifying child of more than one tax filer
taxpayer in the same household. For example, a child who lives with a single parent, grandparent, and aunt in the same home could be a qualifying child of all al three of these individuals. But only one of these individuals can claim the qualifying child for the EITC, and the others cannot. Indeed, it appears that under current law, the other individuals are also ineligible to claim the childless EITC.12 In the case where the tax filers cannot agree on who claims the child, there are "tie-breaker" rules for who can claim the child for the EITC.13
Age Requirements for EITC Recipients with No Qualifying Children
If a tax filer has no qualifying children, he or she must be between 25 and 64 years of age to be eligible for the EITC. There is no age requirement for tax filersIn 8 T hese payments are provided to individual care providers for the care of eligible individuals under a state Medicaid Home and Community-Based Services waiver program described in §1915(c) of the Social Security Act and are not subject to federal taxation. See IRS Notice 2014 -7; IRS, Certain Medicaid Waiver Paym ents May Be Excludable From Incom e, February 23, 2015, https://www.irs.gov/individuals/certain-medicaid-waiver-payments-may-be-excludable-from-income; and Feigh v. Com m issioner, No. 20163-17, 152 T .C. 267, May 15, 2019. 9 For more information, see https://www.irs.gov/credits-deductions/individuals/earned-income-tax-credit/special-eitc-rules.
10 See Internal Revenue Code (IRC) §32(c)(1)(C) and http://www.irs.gov/Individuals/EIT C,-Earned-Income-T ax-Credit,-Questions-and-Answers. 11 If an individual is the qualifying child for the purposes of the EIT C of another person, that individual cannot themselves claim the EIT C. For more information, see http://www.irs.gov/Individuals/EIT C,-Earned-Income-T ax-Credit,-Questions-and-Answers.
12 If placed by an authorized agency or court order. 13 Qualifying children who reside with a servicemember who is stationed outside the United States while serving on extended active duty with the U.S. Armed Forces are considered to reside in the United States for the purposes of the EIT C.
Congressional Research Service
3
The Earned Income Tax Credit (EITC): How It Works and Who Receives It
these cases, “tiebreaker” rules for who can claim the child for the EITC apply.14 If, as a result of these rules, a taxpayer cannot claim any qualifying children for the EITC, the taxpayer may be
able to claim the credit for those with no qualifying children.15
Age Requirements for EITC Recipients with No Qualifying Children If a taxpayer has no qualifying children, he or she must be between 25 and 64 years of age to be
eligible for the EITC. There is no age requirement for taxpayers with qualifying children.
with qualifying children.
Investment Income
A tax filer A taxpayer with investment income over a certain dollar amount is ineligible for the EITC. The statutory limit—$2,200—is adjusted annually for inflation. For 2018 for the EITC. For 2020, the limit on investment income is $3,500650. Investment income is defined as interest income (including tax-exempt interest), dividends, net rent, net capital gains, and net passive income. It
also includes royalties that are from sources other than the filer'’s ordinary business activities.
Disallowance of the EITC Due to Fraud or Reckless Disregard of Rules
A tax filerof Rules A taxpayer is barred from claiming the EITC for a period of 10 years after the IRS makes a final determination to reduce or disallow a tax filer'disal ow a taxpayer’s EITC because that individual made a fraudulent EITC claim. A tax filertaxpayer is barred from claiming the EITC for a period of two years after the IRS determines that the individual made an EITC claim "“due to reckless and intentional disregard of
the rules"” of the EITC, but that disregard was not found to be fraud.14
16
14 Under tiebreaker rules, a child who can be claimed as an EIT C qualifying child of more than one taxpayer is generally treated as the EIT C qualifying child of (by order of application): (1) the parents, if they file a joint return and claim the child as a qualifying child; (2) the parent if only one of the persons is the child’s parent and the parent claims the child as a qualifying child; (3) the parent with whom the child lived for the longer period of time during the tax year if two of the persons are the child’s parent, they do not file a joint return together, and both parents claim the child; (4) the parent with the highest AGI if the child lived with each parent for the same amount of time during the tax year, they do not file a joint return together, and both parents claim the child; (5) the person with the highest AGI if no parent can claim the child as a qualifying child; or (6) the person with the highest AGI if a parent may claim the child as a qualifying child but no parent claims the child as a qualifying child, but only if that person has an AGI higher than any parent who may claim the child as a qualifying child. For examples of application of the tiebreaker rules and answers to common questions, see Internal Revenue Service, Qualifying Child of More Than One Person, AGI and Tiebreaker Rules, June 23, 2017, https://www.eitc.irs.gov/tax-preparer-toolkit/frequently-asked-questions/qualifying-child-of-more-than-one-person-agi-and. 15 Currently, there is no federal regulation which states that taxpayers with a qualifying child who do not claim that qualifying child for the EIT C are ineligible for the credit. In t he past, information provided on the IRS website stated that such individuals were ineligible for the childless EIT C. However, “the IRS has changed its position in proposed regulations.” For more information, see Joint Committee on Taxation, Present Law and Background of Individual Refundable Incom e Tax Credits and a Description of Modifications to Refundable Credits Included in H.R. 6800, as Passed by the House of Representatives, June 16, 2020, JCX-17-20, pp. 9-10.
16 See IRC §32(k).
Congressional Research Service
4
link to page 10 The Earned Income Tax Credit (EITC): How It Works and Who Receives It
Identification Requirements Identification Requirements
To be eligible for the credit, the tax filertaxpayer must provide valid Social Security numbers (SSNs) for
work purposes15 for themselves, spouses if married filing jointly, and any qualifying children.17 The SSNs must be issued before the due date of the income tax return.1618 (U.S. citizenship is not required to be eligible for the credit. SSNs do not indicate U.S. citizenship.) Nonresident aliens— —those who do not have green cards or do not spend sufficient time in the United States—are generally
general y ineligible for the EITC.17
19 Calculating the EITC
The EITC amount is based on formulas that consider earned income, number of qualifying children, marital status, and adjusted gross income (AGI). In general, the EITC equals a fixed percentage (the "“credit rate"”) of earned income until the credit reaches its maximum amount. The EITC then remains at its maximum level over a subsequent range of earned income, between the "“earned income amount"” and the "phase-out“phaseout amount threshold." Finally” Final y, the credit gradually gradual y
decreases in value to zero at a fixed rate (the "phase-out rate"“phaseout rate”) for each additional dollar of earned income or AGI (whichever is greater) above the phase-outphaseout amount threshold. The specific values of these EITC parameters (e.g., credit rate, earned income amount, etc.) vary depending on several factors, including the number of qualifying children a tax filertaxpayer has and his or her marital
status, as illustrated inil ustrated in Table 1.
, 2020
Number |
0 |
1 |
2 |
3 or more |
|
unmarried tax filers (single and head of household filers) |
||||
|
credit rate |
7.65% |
34% |
40% |
45% |
|
earned income amount |
$6,780 |
$10,180 |
$14,290 |
$14,290 |
|
maximum credit amount |
$519 |
$3,461 |
$5,716 |
$6,431 |
|
phase-out amount threshold |
$8,490 |
$18,660 |
$18,660 |
$18,660 |
|
phase-out rate |
7.65% |
15.98% |
21.06% |
21.06% |
|
income where credit = 0 |
$15,270 |
$40,320 |
$45,802 |
$49,194 |
|
married tax filers (married filing jointly) |
||||
|
credit rate |
7.65% |
34% |
40% |
45% |
|
earned income amount |
$6,780 |
$10,180 |
$14,290 |
$14,290 |
|
maximum credit amount |
$519 |
$3,461 |
$5,716 |
$6,431 |
|
phase-out amount threshold |
$14,170 |
$24,350 |
$24,350 |
$24,350 |
|
phase-out rate |
7.65% |
15.98% |
21.06% |
21.06% |
|
income where credit = 0 |
$20,950 |
$46,010 |
$51,492 |
$54,884 |
Source: IRS Revenue Procedure 2018-18 and Internal Revenue Code (IRC) Section 32.
As illustrated in Table 1, the EITC's earned income amounts, credit rates, phase-out rates, and maximum credit amounts vary by the number of qualifying children a tax filer has. The EITC ranges from a maximum credit of $519 for a tax filer without a child to $6,431 for a tax filer with three or more qualifying children, as illustrated in Figure 1.
|
 |
|
The phase-out amount threshold varies by both the number of qualifying children a tax filertaxpayer has and his or her marital status. The phase-outphaseout amount threshold for those who are married filing joint returns is $5,690890 greater than for unmarried filing statuses withw ith the same number of children. (Tax filers(Taxpayers who file as married filing separately are ineligible for the EITC.) This higher phase-out phaseout amount threshold for married tax filerstaxpayers reduces (but generallygeneral y does not eliminate) potential "
“marriage penalties"” in the EITC whereby the credit for a married couple is less than the
combined credit of two unmarried recipients.
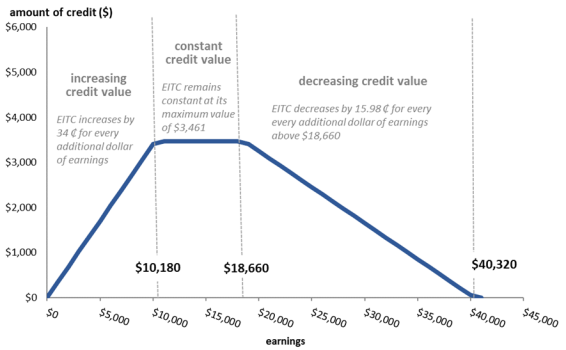
Figure 2 illustratesil ustrates the EITC amount by earned income level for an unmarried taxpayer with one
child for 20182020. It shows the three distinct ranges of EITC for this family:
-
Phase-in Range: The EITC increases with earned income from the first dollar of
earned income up to
earningsearned income of $10,180540. Over this earned income range, the credit equals the credit rate (34% for atax filertaxpayer with one child) times the amount of annual earned income. The $10,180540 threshold iscalledcal ed the earned income amount and is theearningslevel at which the EITC ceases to increase with earned income. The income interval up to the earned income amount, where the EITC increases with earned income, is known as the phase-in range. -
Plateau: The EITC remains at its maximum level of $3,
461584 from the earned income amount ($10,180) until earnings exceed $18,660540) until $19,330. The $3,461584 credit represents the Congressional Research Service 6 link to page 12 The Earned Income Tax Credit (EITC): How It Works and Who Receives Itcredit represents themaximum credit for atax filertaxpayer with one child in20182020. The income interval with the EITC fixed at its maximum value represents the plateau on Figure 2. Phase-out Phaseout Range: Once adjusted gross income (or if greater, earned income) exceeds $18,66019,330, the EITC is reduced for every additional dollar over that amount. The $18,66019,330 threshold is known as thephase-outphaseout amount threshold for a single taxpayer with one child in20182020. For each dollar over thephase-outphaseout amount threshold, the EITC is reduced by 15.98%. The 15.98% rate is known as thephase-outphaseout rate. The income interval from thephase-outphaseout income level until the EITC is completely phased out is known as thephase-outphaseout range.
The EITC is completely phased out (EITC = $0) once the tax filer'taxpayer’s AGI (or earned income, whichever is greater) reaches $40,32041,756. The earned income amounts and the phase-outphaseout amount
thresholds are adjusted each year for inflation.
In practice,
EITC claimants use tables published by the IRS to calculate their credit amount. A tax filer can look up the correct amount of his or her EITC based on based on their income, marital status, and number of qualifying children. The instructions for the federal income
tax form18 show the EITC amounts in tables by income brackets (in $50 increments).20
20 T he tables can be found, for 2019 ret urns, beginning on page 46 of the Form 1040 general instructions, at https://www.irs.gov/pub/irs-pdf/i1040gi.pdf.
Congressional Research Service
7
link to page 10 link to page 10 link to page 13 link to page 13 link to page 13 link to page 13 link to page 13 link to page 13 The Earned Income Tax Credit (EITC): How It Works and Who Receives It
Income Limits for the EITC
As previously discussed, the amount of the EITC is reduced for each dollar of AGI (or earned
income, if greater) above a certain dollar threshold, referred to as the phase-outphaseout amount threshold. That threshold, combined with the phase-outphaseout rate, results in a specific income level (referred to as "“income where credit = 0" in” in Table 1) above which a tax filertaxpayer is ineligible for the credit. This
income level, where the credit reaches zero, is sometimes referred to as the eligibility threshold.
As illustrated in
As il ustrated in Table 1, there are eight eligibility thresholds for the EITC depending on the number of qualifying children a taxpayer has and his or her marital status. The eligibility thresholds vary every year given that they are based in part on a parameter of the credit—the phase-outphaseout amount threshold—that is explicitly adjusted for inflationinflation. Table 2 shows the EITC eligibility
thresholds for 20182020. An EITC claimant'’s AGI (or earned income, if higher) must be below these thresholds for the claimant to qualify for the EITC. In 20182020, these thresholds range from $15,270 820 for an unmarried tax filertaxpayer with no qualifying child to $54,88456,844 for a married tax filertaxpayer filing jointly
with three or more qualified children.
Table 2 expresses these eligibility thresholds as a percentage of the 20182020 poverty guidelines. For example, the poverty guideline for a family of three in 20182020 was $20,78021,720. Families of three with income at or below this amount are considered poor. The EITC eligibility threshold of $45,802 47,440 for an unmarried person filing jointly with two qualifying children was more than twice (220218.4%)
the poverty guideline for a family of that type.
Table 2 also expresses these eligibility thresholds as a percentage of the earningsearned income of one worker who works aat the federal minimum wage job ($7.25 per hour), 40 hours per week, 52 weeks a
year ($15,080 annuallyannual y). For the purposes of the calculations inin Table 2, married EITC recipients are assumed to have the same aggregate annual earningsearned income as unmarried recipients—$15,080. The EITC is available in 2018 to all families. It is available in 2020 to families with children who have earningsearned income between 2.78 to
3.83.6 times the annual earnings from a minimum wage job (267.4% to 364.0276.9% to 376.9% of $15,080).
Table 2. Maximum AGI to Qualify for the EITC, by Number of Qualifying Children
and Filing Status, 2020
Three or
One
Two
More
No Qualifying
Qualifying
Qualifying
Qualifying
Children
Child
Children
Children
Unmarried
$15,820
$41,756
$47,440
$50,594
Married Filing Jointly
$21,710
$47,646
$53,330
$56,844
As a percentage of the and Filing Status in 2018
|
No Qualifying Children |
One Qualifying Child |
Two Qualifying Children |
Three or More Qualifying Children |
||
|
Unmarried |
$15,270 |
$40,320 |
$45,802 |
$49,194 |
|
|
Married Filing Jointly |
20,950 |
46,010 |
51,492 |
54,884 |
|
|
As a percentage of the poverty threshold |
| ||||
|
Unmarried |
125.8% |
245.0% |
220.4% |
| |
|
Married Filing Jointly |
127.3 |
221.4 |
205.1 |
| |
| |||||
|
Unmarried |
101.3% |
267.4% |
303.7% |
326.2% |
|
|
Married Filing Jointly |
138.9 |
305.1 |
341.5 |
364.0 |
|
Source: Congressional Research Service, based on IRS Revenue Procedure 2018-18, Internal Revenue Code (IRC) Section §32 and the 20182020 Poverty Guidelines available at https://aspe.hhs.gov/poverty-guidelines.
a. . a. Represents the EITC AGI threshold divided by the poverty guidelines for a family of 4 b. of 4
b. Represents the EITC AGI threshold divided by the poverty guidelines for a family of 5.
Congressional Research Service
8
The Earned Income Tax Credit (EITC): How It Works and Who Receives It
of 5.
Payment of the EITC
The EITC is provided to individuals and families annuallyannual y in a lump -sum payment after a taxpayer files a federal income tax return.19 It may be received in one of three ways:
- 1. a reduction in federal tax liability;
- 2. a cash payment from the Treasury if the tax filer has no tax liability, through a tax refund check; or
- 3. a combination of reduced federal tax liability and a refund.
The majority (86%) of the aggregate amount of the EITC—$68.5 billion for 2015—is received as a refund.20 In other words, $58.8 billion21 Like al tax credits, the EITC can reduce income tax liability. And because the EITC is a refundable tax credit, if a taxpayer’s EITC is greater than what they owe in income taxes, they can receive the difference (the portion of the credit that remains after offsetting any income tax liability) as part of their annual tax refund. The amount of
the credit that remains after offsetting any income tax liability is often referred to as the refundable portion of the EITC, whereas the amount that reduces income tax liability is referred to as the nonrefundable portion of the credit. A taxpayer who has no income tax liability wil
receive al of the EITC as the refundable portion of the credit.
The majority (85%) of the aggregate amount of the EITC—$66.4 bil ion for 2017—is received as the refundable portion of the credit.22 In other words, for 2017, $56.8 bil ion of the EITC was received as a refund for 2014the refundable portion of the credit (and hence exceeded income taxes owed), while
, while approximately $9.7 billion bil ion offset tax liabilities.
The EITC is taken against all al taxes reported21 on the federal individual income tax return (Form 1040) after all al nonrefundable credits have been taken.23 On the tax form, the EITC can be found
in the payments section after the lines for withholding and estimated tax payments.
The EITC benefits families when they file their income taxes. Thus, payments are generallygeneral y based on the prior year'’s income, earningsearned income, and family composition.24 That is, the 2020 EITC,
based on a taxpayer’s earned income That is, the EITC earned in 2018, based on a tax filer's earnings, income, and family composition, will in 2020, wil be paid in 2019.222021.25 If the taxpayerthe tax filer is owed a refund, and that filer'’s return includes an EITC, that refund will wil be made
on or after February 15.23
26 Interaction with Other Tax Provisions
On the tax return, the EITC is calculated after total tax liability and all and al nonrefundable credits. Nonrefundable tax credits, which are taken against (reduce) income tax liability, include credits for education, dependent care, savings, and the nonrefundable portion of the child credit.24 If an EITC-eligible family has a tax liability and can usethe
21 Before 2011, any persons with a qualified child eligible for the EIT C could elect to receive advance payment of the credit through the employer’s payroll withholding system by filing an eligibility certificate (Form W -5) with his or her employer. T he option was little used and eliminated by P.L. 111-226.
22 For more information, see IRS Statistics of Income, T able 2.5 at http://www.irs.gov/uac/SOI-T ax-Stats—Individual-Statistical-T ables-by-Size-of-Adjusted-Gross-Income. 23 T hese taxes include the regular income tax and alternative income tax, as well as self -employment taxes. Less common taxes, like unreported Social Security and Medicare taxes and certain taxes on IRAs, are also included. For a historical example of these taxes, see lines 57 through 62 on the 2016 IRS Form 1040, https://www.irs.gov/pub/irs-pdf/f1040.pdf.
24 Congress has allowed taxpayers to elect to use older income in computing their EIT C (and the refundable portion of the child tax credit, known as the additional child tax credit or ACT C). For a discussion, see “EIT C/CT C Credit Computation Look-Back” in CRS Report R45864, Tax Policy and Disaster Recovery, by Molly F. Sherlock and Jennifer T eefy. 25 T he Protecting Americans from T ax Hikes (PAT H) Act (Division Q of P.L. 114-113) prevents a taxpayer from claiming the EIT C for any year in which the filer did not have a Social Security number (SSN) on or before the due date of the tax return for that year. T his provision prevents a filer who obtains an SSN from retroactively claiming the EIT C for any prior open tax years (generally three years) when the filer did not have an SSN at the time those years’ returns were due.
26 T his was effective beginning with returns filed in 2017 (i.e., 2016 income tax returns). §201 of the Protecting Americans from T ax Hikes (PAT H) Act (Division Q of P.L. 114-113).
Congressional Research Service
9
link to page 30 link to page 12 The Earned Income Tax Credit (EITC): How It Works and Who Receives It
Lifetime Learning credit,27 the child and dependent care credit,28 a savings credit,29 and the nonrefundable portions of both the child credit30 and the American Opportunity tax credit (AOTC).31 If an EITC-eligible family has any tax liability and receives one or more of these credits, the total amount of their EITC will wil remain unchanged, but howthe amount they receive the credit will change. Ifas the refundable portion of the credit (i.e., the amount which exceeds income tax liability) wil change. Specifical y, if nonrefundable tax credits can reduce a family'’s tax liability, a greater amount of
their EITC will wil be received as a refundthe refundable portion, and less will wil offset their tax liability since their tax liability is smaller.
For tax filers whose income places them in the "phase-out range".
EITC Participation Rates
According to the IRS, 78% of eligible EITC recipients received the credit for 2016 (i.e., on their 2016 income tax return), with substantial variation by number of qualifying children.32 According to data from the IRS Taxpayer Advocate, for 2016 an estimated 65% of eligible EITC recipients with no qualifying children claimed the EITC, compared to an estimated 86% participation for those with one child, 85% participation for those with two children, and 82% participation for those with three children.33 Estimates by state can be found in Table A-4. Eligible individuals may not claim the EITC for a variety of reasons. The IRS notes that nonparticipants are more likely to be workers who are “living in rural areas, self-employed, receiving certain disability pensions or have children with disabilities, without a qualifying child, not proficient in English, grandparents raising their grandchildren, or recently divorced, unemployed, or experienced other changes to their marital, financial or parental status.”34 In addition, eligible workers who do not (and are not required to) file a federal income tax return due to their low incomes, wil not receive the credit. Note that data on EITC receipt summarized in this report are from the IRS Statistics of Income (SOI), which general y provides information on credit receipt (after compliance measures like audits in a given year). Hence, EITC receipt data include eligible and ineligible recipients. For more information, see CRS Report R43873, The Earned Income Tax Credit (EITC): Administrative and Compliance Chal enges, by Margot L. Crandal -Hol ick.
For taxpayers whose income places them in the “phaseout range” of the credit, reducing their income (all al else being unchanged) will wil result in a larger EITC. (As illustrated inil ustrated in Figure 2,
reducing income when a tax filertaxpayer is in the phase-outphaseout range results in the tax filertaxpayer increasing the amount of the credit they receive.) A variety of forms of income can be excluded from both AGI and earned income, reducing a taxpayer'’s AGI or earned income for purposes of calculating the credit. For example, pretax contributions to savings accounts for retirement or medical expenses are not included in either AGI or earned income. Hence, by making these contributions, EITC
claimants whose precontribution income places them in the phase-out range of the credit will credit’s phaseout range wil reduce their AGI or earned income for purposes of calculating the EITC and thus receive a larger credit.25
In contrast, for tax filers whose earned income places them in the "phase-in range" of the credit, reducing their earned income (all else unchanged) will result in a smaller EITC. (As previously discussed, the phase-in range of the credit is over a range of earned income, while the credit
larger credit.35
27 CRS Report R41967, Higher Education Tax Benefits: Brief Overview and Budgetary Effects, by Margot L. Crandall-Hollick.
28 See CRS Report R44993, Child and Dependent Care Tax Benefits: How They Work and Who Receives Them , by Margot L. Crandall-Hollick.
29 See CRS In Focus IF11159, The Retirement Savings Contribution Credit, by Molly F. Sherlock. 30 For more information on the nonrefundable (and refundable) portion of the child tax credit, see CRS Report R41873, The Child Tax Credit: Current Law, by Margot L. Crandall-Hollick.
31 See CRS Report R42561, The American Opportunity Tax Credit: Overview, Analysis, and Policy Options, by Margot L. Crandall-Hollick. 32 Center for Administrative Records Research and Applications, U.S. Census Bureau in collaboration with IRS. Data can be found at https://www.eitc.irs.gov/eitc-central/participation-rate/eitc-participation-rate-by-states.
33 National T axpayer Advocate, Earned Income Tax Credit, Special Report to Congress, Volume 3. Figure A.7. 34 Internal Revenue Service, “About EIT C: Who are we missing?” June 29, 2020, https://www.eitc.irs.gov/eitc-central/about-eitc/about -eitc. 35 In contrast, if the precontribution income places them in the plateau or the phase-in range, decreasing their earned income by making certain pretax savings contributions may either have no impact or result in a smaller credit.
Congressional Research Service
10
link to page 12 The Earned Income Tax Credit (EITC): How It Works and Who Receives It
In contrast, for taxpayers whose earned income places them in the credit’s “phase-in range”, reducing their earned income (al else unchanged) wil result in a smal er EITC. (As previously noted, the credit phases in over a range of earned income, whereas it phases out based on adjusted gross income or earned income, whichever is greater.) As illustrated inil ustrated in Figure 2, reducing income when a tax filertaxpayer is in the phase-in range results in the tax filertaxpayer reducing the amount of the credit they receive. GenerallyGeneral y, nontaxable income cannot be included in earned income for purposes of
calculating the EITC. However, as previously discussed, servicemembers may elect to include their nontaxable combat pay as earned income, for purposes of calculating the EITC. Generally, General y, servicemembers whose income (excluding their combat pay) places them in the phase-in range will wil elect to include their combat pay in earned income for purposes of calculating the EITC in
order to receive a larger credit.
Treatment of the EITC for Need-Tested Benefit Programs
By law,26 the EITC cannot be counted as income in determining eligibility for, or the amount of, any federally
any federal y funded public benefit program, including Supplemental Nutrition Assistance Program (SNAP) food assistance, low-income housing, Medicaid, Supplemental Security Income (SSI), and Temporary Assistance for Needy Families (TANF).36 An EITC refund that is saved by the filer does not count against the resource limits of any federallyfederal y funded public benefit program for 12
months after the refund is received.
Data on EITC Receipt months after the refund is received.
Modifications to the EITC Made Permanent by
P.L. 114-113
Two temporary modifications to the EITC were enacted by the American Recovery and Reinvestment Act of 2009 (ARRA; P.L. 111-5). First, ARRA enacted a temporary larger credit for families with three or more children by creating a new higher credit rate of 45% (previously, these tax filers were eligible for a credit rate of 40%). Second, ARRA expanded marriage penalty relief by increasing the earned income level at which the credit phased out for married tax filers in comparison to unmarried tax filers with the same number of children. Before ARRA, the EITC for married tax filers would begin to phase out for earned income $3,000 (adjusted for inflation) greater than the level for unmarried recipients with the same number of children. ARRA increased this differential to $5,000 (adjusted for inflation). In 2018, this marriage penalty relief was equal to $5,690. These two changes were originally scheduled to be in effect only for 2009 and 2010. The Tax Relief, Unemployment Insurance Reauthorization, and Job Creation Act of 2010 (P.L. 111-312) extended these ARRA provisions for two years (2011 and 2012). The American Taxpayer Relief Act (ATRA; P.L. 112-240) extended the ARRA provisions for five more years (2013-2017). The Protecting Americans from Tax Hikes (PATH) Act (Division Q of P.L. 114-113) made these two modifications permanent.
Participation and Benefits
The EITC was first enacted in 1975 as a temporary measure meant to encourage economic growth in the face of the 1974 recession and rising food and energy prices. It was also originally original y intended to "“assist in encouraging people to obtain employment, reducing the unemployment rate, and reducing the welfare rolls."27”37 Over time the list of EITC objectives has grown to include
poverty reduction. Today the EITC is the largest need-tested, cash benefit antipoverty programantipoverty program that provides cash benefits. This section first provides a historical overview of the growth of the EITC for tax years from
1975 to 20152017; it then examines information on EITC participation for 2015.
Trends in Participation and EITC Benefits
When originally receipt for 2017.
Trends in EITC Receipt from 1975 to 2017 When original y enacted by the Tax Reduction Act of 1975 (P.L. 94-12), the EITC was a temporary refundable tax credit in effect for 1975. For that year, 6.2 million tax filers claimed the EITC and the total EITC amount claimed was $1.25 billion (in constant 2015mil ion taxpayers received $1.25 bil ion from the EITC (in constant 2017 dollars, this equals $5.5 billion7 bil ion). The credit was
extended several more times on a temporary basis and made permanent by the Revenue Act of 1978 (P.L. 95-600). Legislation enacted in 1986 (P.L. 99-514), 1990 (P.L. 101-508), 1993 (P.L. 103-66), 2001 (P.L. 107-16), and 2009 (P.L. 111-5) increased the amount of the credit by changing the credit formula. For more information on the legislative history of the EITC, see CRS Report R44825, The Earned Income Tax Credit (EITC): A Brief Legislative History, by [author name scrubbed].
Before 1990, the credit amount was calculated as a percentage of earnings ("the credit rate") up until the earned income amount. The credit then remained at its maximum level before gradually
Margot L. Crandal -Hollick.
36 T he T ax Relief, Unemployment Insurance Reauthorization, and Job Creation Act of 2010 (P.L. 111-312) included a provision which made tax refunds, including those resulting from the EIT C, disregarded in the administration of federal programs and federally assisted programs. At the end of 2012, this provision was made permanent by the American T axpayer Relief Act of 2012 (P.L. 112-240). See IRC §6409. 37 U.S. Congress, Senate Committee on Finance, Tax Reduction Act of 1975, Report to Accompany H.R. 2166, 94th Cong., 1st sess., March 17, 1975, S.Rept. 94-36, p. 33.
Congressional Research Service
11
link to page 17 link to page 18 link to page 18 link to page 26
The Earned Income Tax Credit (EITC): How It Works and Who Receives It
Before 1990, the credit amount was calculated as a percentage of earned income (“the credit rate”) up until the earned income amount. The credit then remained at its maximum level before gradual y decreasing in value as earned income increased. Legislative changes to the credit made during this time generallygeneral y increased the amount of the credit in a variety of ways, including increasing the credit rate, increasing the earned income amount, increasing the phase-outphaseout amount
threshold, and decreasing the phase-out rate. Nonetheless, the credit amount depended on earned income.
Beginning phaseout rate.
Beginning in 1990 and more substantiallysubstantial y in 1993, the credit formula was revised such that the credit amount varied based on earned income and, to a certain extent, the number of qualifying
children. This essentiallyessential y increased the credit by family size. In addition, for the first time in 1993, Congress made workers without qualifying children eligible for the EITC for the first time, although the credit was smaller
was smal er than the credit for claimants with qualifying children.
In 2001, the credit formula was revised again so that it also varied based in part on marital status. As a result of this change, often referred to as "“marriage penalty relief,"” certain married tax filers taxpayers would receive a larger credit than unmarried tax filerstaxpayers with the same number of children. In 2009, the marriage penalty relief was expanded further and a larger credit was created for families with three or more children. These 2009 changes were extended several times and made
permanent by P.L. 114-113.
.
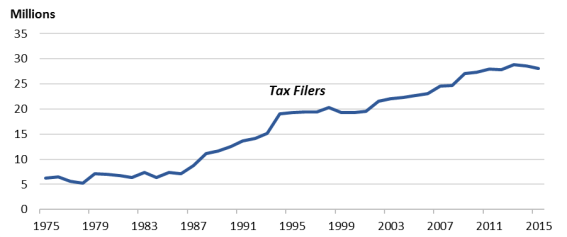
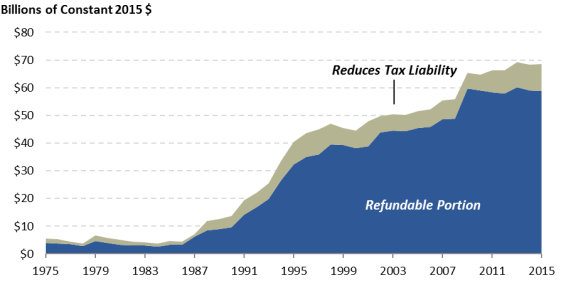
Figure 3 shows the number of tax filers claimingtaxpayers receiving the EITC for 1975 to 20152017. Figure 4 shows the amount of the EITC claimed on these returnsreceived, with dollar amounts adjusted for inflation to represent 2015 2017
dollars. The figures show the effects of the legislative expansions of the EITC, with the credit experiencing growth in the late 1980s through the mid-1990s and then again in the 2000s. As shown on Figure 4, throughout the history of the EITC, most credits have been paid in the form of refunds, with a relatively small share of the EITC reducing regular federal income tax liability.
|
 |
Note: For a tabular display of this information, see |
|
 |
Notes: Constant |
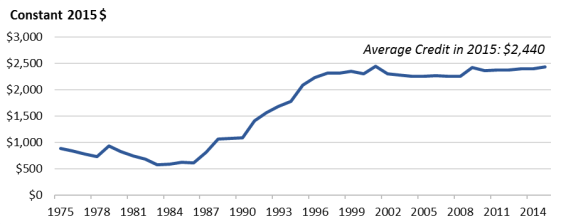
The growth in the total amount of EITC claimeddollars in the late 1980s to the mid-1990s was due to increases not only in participationthe number of taxpayers eligible for the credit, but also in the average credit received by tax filersamount. Figure 5 shows the average EITC claimed for 1975 to 20152017, in inflation-adjusted (20152017) dollars. Before the 1986 Tax Reform Act (P.L. 99-514), EITC thresholds were not indexed for inflation,
and the average credit lost value each year. However, the 1986 act increased the credit’s monetary parameters of the credit for prior inflation and adjusted the threshold amounts and maximum credits annually annual y for inflation in future years. The credit formula was also revised in 1990 and then again in 1993 such that the amount of the credit depended to a certain extent on family size. These changes resulted in an increasing average credit between the late 1980s and late 1990s. Since then, the
average credit has largely maintained its real value. However, increases in the average credit amount in 2001 and 2009 were likely due to legislative changes that included larger credits for some married claimants and for families with three or more children.2838 The average EITC claimed for 2015for
2017 was $2,458.
38 T he increase in the value of the credit in 2009 is likely due to the changes made by the American Recovery and Reinvestment Act of 2009 (ARRA, P.L. 111-5) which expanded the credit for families with three or more children and increased marriage penalty relief.
Congressional Research Service
13
link to page 26 link to page 20
The Earned Income Tax Credit (EITC): How It Works and Who Receives It
Figure 5. Average EITC, 1975-2017
Source: Congressional Research Service. For pre-2003 data, U.S. Congress, House Committee was $2,440.
|
 |
Notes: Constant |
Participation and EITC Amounts Claimed for 2015
For 2015, $68.5 billion of the EITC was claimed on 28.1 million tax returns.
Number of Qualifying Children
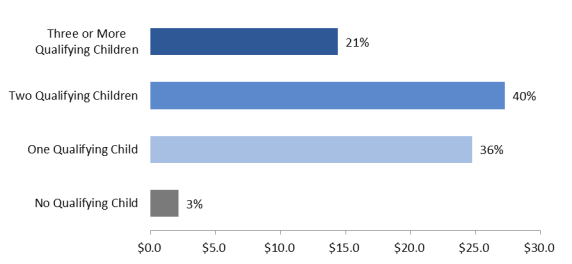
Most tax filers claiming the EITC, and those who received the most EITC dollars, were families with childrenchildren. Figure 6 shows total EITC dollars claimed for 2015for 2017 by number of qualifying children. For 2015, 2017, 3% of all al EITC dollars were claimed by tax filersreceived by taxpayers with no qualifying children and 97% were claimed by tax filersreceived by taxpayers with qualifying children. Of this 97%, 36: 35% were claimed by tax filersreceived by taxpayers with one qualifying child, 40% were claimed by tax filersreceived by taxpayers with two qualifying children, and 21% were claimed by tax filers22% were
received by taxpayers with three or more qualifying children.
Congressional Research Service
14
link to page 21 link to page 21
The Earned Income Tax Credit (EITC): How It Works and Who Receives It
Figure 6. Distribution of Total EITC Dollars by Number of Qualifying Children, 2017
Source: Congressional Research Service, based on data from the Internal Revenue Service, Statistics with three or more qualifying children.
Though childless tax filers claimed 3% of all EITC dollars for 2014, they accounted for 26% of all tax filers that claimed the EITC. Thus, their small share of total EITC dollars reflects,
in part, the lower credit amount available to childless filers.
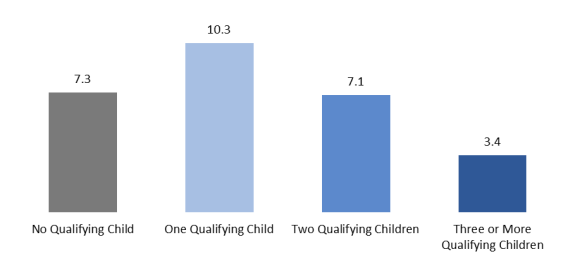
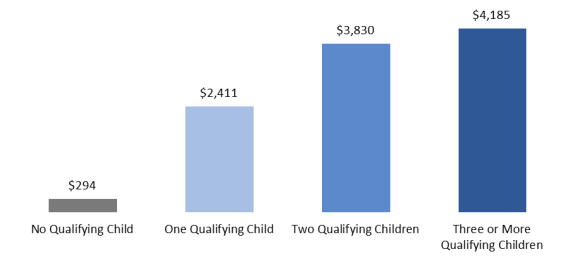
Figure 7 shows the number of returns claimingwith the EITC for 20152017 by number of qualifying children. Figure 8 shows the average EITC claimed for 2015for 2017 by number of qualifying children. The average EITC
for 2017for 2015 increased with the number of qualifying children a tax filer claimed:
- :
The EITC was
claimed by 7.3 million tax filersreceived by 7.0 mil ion taxpayers with no qualifying children, with an averageclaim of $294. - credit of $299.
The EITC was
claimed by 10.3 millionreceived by 9.7 mil ion filers with one qualifying child, with an averageclaimcredit of $2,389. of $2,411. - The EITC was
claimed by 7.1 millionreceived by 6.8 mil ion filers with two qualifying children, with an averageclaimcredit of $3,858. of $3,830. - The EITC was
claimed by 3.4 millionreceived by 3.5 mil ion filers with three or more qualifying children, with an averageclaimcredit of $4,252. Congressional Research Service 15 link to page 27 link to page 27 The Earned Income Tax Credit (EITC): How It Works and Who Receives It Figure 7. Number of Tax Returns with the EITC by Number of Qualifying Children, 2017 Source: Congressional Research Service, based on data from the Internal Revenue Service, Statisticsof $4,185.
Number in Millions, Total Number of Returns Claiming the EITC = 28.1 million |
 |
Notes: Detail does not add to total because of rounding. For detail on returns |
|
 |
Note: For detail on returns |
Income Level
Though the EITC is targeted toward lower-income earners, tax filerstaxpayers with children may receive the EITC even with income well wel above the poverty level. (The federal poverty level for a family of three was $20,090 in 2015
Congressional Research Service
16
link to page 23 link to page 23 link to page 23 link to page 10 link to page 12 link to page 27 The Earned Income Tax Credit (EITC): How It Works and Who Receives It
of three is $21,720 in 2020; it was $20,420 in 2017.) However, the largest EITC benefits are focused on low-income earners near the poverty line, with those with greater earnings earned income
receiving reduced benefits.
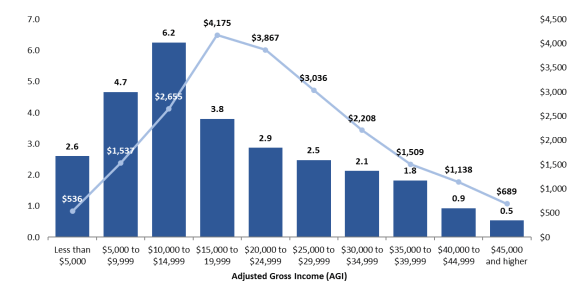
Figure 9 shows the number of tax returns with EITC claims for 2015the EITC for 2017 by adjusted gross income level. (AGI) level. Figure 9 shows that the $10,000-$14,999 AGI bracket accounted for the greatest number of 2017 tax returns that included the EITC—5.9 mil ion. For 2017, close to half (47%) of al returns with the EITC had AGIs below $15,000. For context, a full-time full-year worker
earning the federal minimum wage would have an AGI of $15,080.39
shows that the most typical (modal) EITC tax return had an AGI between $10,000 and $14,999, with 6.2 million returns including an EITC in that income range for 2015. For that year, close to half (48.1%) of all returns with EITC claims had AGIs below $15,000. This AGI is equivalent to earnings less than the $15,080 earned by a full-time (40 hour per week) full-year (52 weeks per year) worker earning the federal minimum wage ($7.25 per hour).
Figure 9 also shows the average EITC claimed by AGI category. Average EITC benefits first increase with AGI, then decline. This outcome reflects the formula for determining the EITC, which provides an increasing credit up to a maximum amount, then ultimately a reduced credit as it is
phased out above a certain income threshold (seesee Table 1 andand Figure 2). It also reflects a difference in the mix of family types claimingreceiving the EITC in the various AGI categories. For example, nearly three-quarters (73%) of al EITC recipientsexample, 73% of all filers claiming the EITC with AGIs of less than $5,000 had no qualifying children. All those claiming the EITC atAl EITC recipients with AGIs above $25,000 in 2015for 2017 had qualifying children, and hence were eligible for a larger maximum EITC benefit than filers without children.
For detail on returns claimingwith the EITC by AGI and number of qualifying children, seesee Table A-2.
39 40 hours per week for 52 weeks a year at $7.25 per hour.
Congressional Research Service
17
link to page 27
The Earned Income Tax Credit (EITC): How It Works and Who Receives It
Table A-2.
Figure 9. Number of Tax Returns Numbers in Millions and 2015 Dollars |
 |
Notes: For detail on returns |
Filing and Marital Status
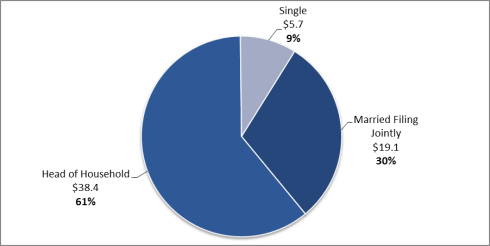
The Internal Revenue Service does not provide data on EITC dollars claimed by filing status. The Tax Policy Center (TPC), however, estimated that in 2015, 70% of all EITC dollars will be claimed by unmarried tax filers (head of household and single filing statuses), with most (60% of all EITC dollars) claimed by those filing as heads of household. Figure 10 shows estimates forof the distribution of total EITC dollars claimed by by
filing status and number of qualifying children for 2017.
Figure 10. Distribution of Total EITC Dollars by Marital Status and Number of
Qualifying Children, 2017
Source: National Taxpayer Advocate, Earned Income Tax Credit, Special Report to Congress, Volume 3. Table A.5.
By Region
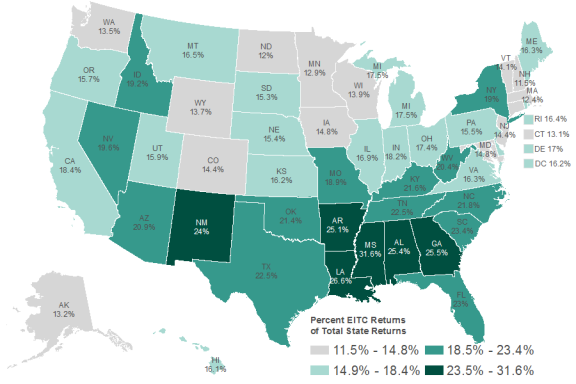
For 2017, 18% of al taxpayers received the EITC. However, the share of taxpayers receiving the EITC varies considerably by state. For 2017, the state with the highest percentage of returns receiving the EITC was Mississippi, with 30% of al filers receiving the credit. In contrast, 11%
of al taxpayers in New Hampshire received the EITC forfiling status for 2015.
Dollars in Billions |
 |
|
Region
For tax year 2015, the EITC was claimed on 18.7% of all tax returns. However, the rate at which the EITC is claimed by tax filers varies considerably by state. In 2015, the state with the highest percentage of returns claiming the EITC was Mississippi, with the credit claimed on 31.6% of all returns. In contrast, the EITC was claimed on 11.5% of all returns in New Hampshire that year.
that year.
Figure 11 provides a map showing the percentage of all tax returns claiming the EITC byal 2017 federal income tax returns that included an EITC for each state. In addition to considerable state variation, the map shows that
there is a regional pattern to EITC receipt. A greater share of returns filedtaxpayers in certain southern states claimedreceived the EITC than returnsthose in other regions of the country. The EITC was claimedreceived on the smallest
smal est percentage of returns in New England, as wel as well as some states in the northern Midwest.
Congressional Research Service
19
link to page 29 The Earned Income Tax Credit (EITC): How It Works and Who Receives It
Figure 11. Percentage of Tax Returns |
 |
Source: Congressional Research Service, based on data from the U.S. Internal Revenue Service.
|
Appendix. Additional Tables
|
In millions of nominal dollars |
In millions of nominal dollars
In millions of constant | ||||||
|
Year |
Tax Filers Claiming the EITC (Millions) |
Total EITC |
Refunded EITC |
Average EITC |
Total EITC |
Refunded EITC |
Average EITC |
|
1975 |
6.215 |
$1,250 |
$900 |
$201 |
5,507 |
3,965 |
886 |
|
1976 |
6.473 |
1,295 |
890 |
200 |
5,394 |
3,707 |
833 |
|
1977 |
5.627 |
1,127 |
880 |
200 |
4,408 |
3,442 |
782 |
|
1978 |
5.192 |
1,048 |
801 |
202 |
3,810 |
2,912 |
734 |
|
1979 |
7.135 |
2,052 |
1,395 |
288 |
6,699 |
4,554 |
940 |
|
1980 |
6.954 |
1,986 |
1,370 |
286 |
5,713 |
3,941 |
823 |
|
1981 |
6.717 |
1,912 |
1,278 |
285 |
4,985 |
3,332 |
743 |
|
1982 |
6.395 |
1,775 |
1,222 |
278 |
4,360 |
3,001 |
683 |
|
1983 |
7.368 |
1,795 |
1,289 |
244 |
4,272 |
3,067 |
581 |
|
1984 |
6.376 |
1,638 |
1,162 |
257 |
3,737 |
2,651 |
586 |
|
1985 |
7.432 |
2,088 |
1,499 |
281 |
4,599 |
3,302 |
619 |
|
1986 |
7.156 |
2,009 |
1,479 |
281 |
4,345 |
3,198 |
608 |
|
1987 |
8.738 |
3,391 |
2,930 |
388 |
7,075 |
6,113 |
810 |
|
1988 |
11.148 |
5,896 |
4,257 |
529 |
11,813 |
8,529 |
1,060 |
|
1989 |
11.696 |
6,595 |
4,636 |
564 |
12,606 |
8,861 |
1,078 |
|
1990 |
12.542 |
7,542 |
5,266 |
601 |
13,677 |
9,550 |
1,090 |
|
1991 |
13.665 |
11,105 |
8,183 |
813 |
19,325 |
14,240 |
1,415 |
|
1992 |
14.097 |
13,028 |
9,959 |
924 |
22,009 |
16,824 |
1,561 |
|
1993 |
15.117 |
15,537 |
12,028 |
1,028 |
25,485 |
19,729 |
1,686 |
|
1994 |
19.017 |
21,105 |
16,598 |
1,110 |
33,753 |
26,545 |
1,775 |
|
1995 |
19.334 |
25,956 |
20,829 |
1,343 |
40,368 |
32,394 |
2,089 |
|
1996 |
19.464 |
28,825 |
23,157 |
1,481 |
43,544 |
34,982 |
2,237 |
|
1997 |
19.391 |
30,389 |
24,396 |
1,567 |
44,877 |
36,027 |
2,314 |
|
1998 |
20.273 |
32,340 |
27,175 |
1,595 |
47,025 |
39,515 |
2,319 |
|
1999 |
19.259 |
31,901 |
27,604 |
1,656 |
45,385 |
39,271 |
2,356 |
|
2000 |
19.277 |
32,296 |
27,803 |
1,675 |
44,452 |
38,268 |
2,305 |
|
2001 |
19.593 |
35,784 |
29,043 |
1,826 |
47,891 |
38,869 |
2,444 |
|
2002 |
21.574 |
37,786 |
33,258 |
1,751 |
49,783 |
43,817 |
2,307 |
|
2003 |
22.112 |
39,186 |
34,508 |
1,772 |
50,477 |
44,451 |
2,283 |
|
2004 |
22.270 |
40,024 |
35,299 |
1,797 |
50,219 |
44,290 |
2,255 |
|
2005 |
22.752 |
42,410 |
37,465 |
1,864 |
51,469 |
45,468 |
2,262 |
|
2006 |
23.042 |
44,388 |
39,072 |
1,926 |
52,186 |
45,936 |
2,264 |
|
2007 |
24.584 |
48,540 |
42,508 |
1,974 |
55,487 |
48,592 |
2,257 |
|
2008 |
24.756 |
50,669 |
44,260 |
2,047 |
55,779 |
48,724 |
2,253 |
|
2009 |
27.041 |
59,240 |
53,985 |
2,191 |
65,447 |
59,642 |
2,421 |
|
2010 |
27.368 |
59,562 |
54,256 |
2,176 |
64,741 |
58,974 |
2,365 |
|
2011 |
27.912 |
62,906 |
55,350 |
2,254 |
66,284 |
58,322 |
2,375 |
|
2012 |
27.848 |
64,129 |
56,190 |
2,303 |
66,202 |
58,007 |
2,377 |
|
2013 |
28.822 |
68,084 |
59,145 |
2,362 |
69,271 |
60,175 |
2,403 |
|
2014 |
28.538 |
68,339 |
58,889 |
2,395 |
68,420 |
58,959 |
2,398 |
|
2015 |
28.082 |
68,525 |
58,795 |
2,440 |
68,525 |
58,795 |
2,440 |
Source: Congressional Research Service. For pre-2003 data, U.S. Congress, House Committee on Ways and Means, 2004 Green Book, Background Material and Data on Programs Within the Jurisdiction of the Committee on Ways and Means, 108th Congress, 2nd session, WMCP 108-6, March 2004, pp. 13-41. For 2003 and later data, Internal Revenue Service, Statistics of Income, SOI Tax Stats-Individual Statistical Statistical Tables by Size of Adjusted Gross Income, Table 2.5.
Note: Constant 2015 dollars 2017 dol ars were computed using the annual average (not-seasonal y adjusted) Consumer Price Index for all al Urban Consumers (CPI-U) from the Bureau of Labor Statistics.
(CPI-U).
Table A-2. Average EITC, Number of Tax Returns with EITC Claimedthe EITC, and Total EITC
by Qualifying Children and Adjusted Gross Income, 2017
Three or
No
One
Two
More
Qualifying
Qualifying
Qualifying
Qualifying
AGI
Total
Children
Child
Children
Children
Average EITC
Less than $5,000
$578
$218
$1,307
$1,831
$2,104
$5,000 to $9,999
$1,489
$448
$2,768
$3,148
$3,529
$10,000 to $14,999
$2,570
$220
$3,352
$5,145
$5,773
$15,000 to $19,999
$4,315
$237
$3,323
$5,503
$6,223
$20,000 to $24,999
$3,944
$21
$2,810
$4,926
$5,732
$25,000 to $29,999
$3,113
$0
$2,060
$3,998
$4,839
$30,000 to $34,999
$2,273
$0
$1,307
$2,986
$3,821
$35,000 to $39,999
$1,528
$0
$590
$2,025
$2,896
$40,000 to $44,999
$1,158
$0
$433
$940
$1,840
Congressional Research Service
22
The Earned Income Tax Credit (EITC): How It Works and Who Receives It
Three or
No
One
Two
More
Qualifying
Qualifying
Qualifying
Qualifying
AGI
Total
Children
Child
Children
Children
$45,000 and higher
$716
$0
$0
$57
$845
Al
$2,458
$299
$2,389
$3,858
$4,252
Tax Returns with the EITC
Less than $5,000
2,434,636
1,768,403
426,105
152,614
87,516
$5,000 to $9,999
4,200,389
2,439,235
1,195,376
385,740
180,037
$10,000 to $14,999
5,858,169
2,503,103
1,709,121
1,153,711
492,235
$15,000 to $19,999
3,481,700
268,717
1,431,240
1,224,905
556,836
$20,000 to $24,999
2,907,136
30,057
1,456,056
956,105
464,917
$25,000 to $29,999
2,502,237
0
1,304,794
823,503
373,940
$30,000 to $34,999
2,235,089
0
1,131,201
738,156
365,732
$35,000 to $39,999
1,805,853
0
826,320
648,476
331,058
$40,000 to $44,999
1,034,860
0
227,907
723,135
300,379
$45,000 and higher
570,315
0
0
29,597
324,156
Total
27,030,382
7,009,515
9,708,119
6,835,943
3,476,805
Total EITC ($ in Thousands)
Less than $5,000
1,406,095
385,478
557,056
279,449
184,112
$5,000 to $9,999
6,252,615
1,093,740
3,309,007
1,214,477
635,392
$10,000 to $14,999
15,056,458
549,888
5,729,348
5,935,538
2,841,684
$15,000 to $19,999
15,025,074
63,668
4,755,886
6,740,389
3,465,132
$20,000 to $24,999
11,466,936
629
4,092,009
4,709,506
2,664,793
$25,000 to $29,999
7,789,700
0
2,688,047
3,292,297
1,809,356
$30,000 to $34,999
5,079,586
0
1,477,932
2,204,299
1,397,354
$35,000 to $39,999
2,759,677
0
487,734
1,313,174
958,768
$40,000 to $44,999
1,198,386
0
98,794
679,714
552,720
$45,000 and higher
408,285
0
0
1,673
273,769
Total
66,442,810
2,093,402
23,195,812
26,370,516
14,783,080
Source: Congressional Research Service, based on data from the Internal Revenue Service, Statistics of Income, SOI Tax Stats-Individual Statistical Tables by Size of Adjusted Gross Income, Table 2.5.
Congressional Research Service
23
The Earned Income Tax Credit (EITC): How It Works and Who Receives It
Table A-3. EITC Receipt by State, 2017
Percentage
Percent
Tax
of Total
Received
Returns
Tax
Total
as
Total Tax
with
Returns
EITC
Average
Refundable
State or Area
Returns
EITC
with EITC
(millions)
EITC
Portion
United States
152,455,900 26,838,260
17.6%
$65,334
$2,434
85.5%
Alabama
2,059,880
495,230
24.0%
$1,378
$2,783
88.5%
Alaska
349,060
48,370
13.9%
$102
$2,117
88.4%
Arizona
3,023,250
587,710
19.4%
$1,505
$2,562
86.7%
Arkansas
1,233,060
295,680
24.0%
$783
$2,647
87.7%
California
18,099,190
3,043,380
16.8%
$6,995
$2,299
82.2%
Colorado
2,714,380
357,180
13.2%
$772
$2,162
84.1%
Connecticut
1,766,090
224,930
12.7%
$493
$2,193
86.1%
Delaware
464,070
74,940
16.1%
$177
$2,361
89.4%
District of Columbia
348,320
52,440
15.1%
$121
$2,304
87.1%
Florida
10,181,210
2,215,860
21.8%
$5,431
$2,451
83.4%
Georgia
4,542,520
1,085,610
23.9%
$2,973
$2,739
85.7%
Hawai
692,790
100,550
14.5%
$216
$2,143
87.3%
Idaho
763,980
132,360
17.3%
$303
$2,291
85.3%
Il inois
6,129,420
978,740
16.0%
$2,419
$2,472
85.5%
Indiana
3,135,470
532,490
17.0%
$1,281
$2,406
87.7%
Iowa
1,457,800
204,320
14.0%
$465
$2,276
87.6%
Kansas
1,332,610
206,630
15.5%
$488
$2,360
87.9%
Kentucky
1,919,980
393,420
20.5%
$957
$2,431
87.3%
Louisiana
1,969,670
511,540
26.0%
$1,447
$2,829
87.4%
Maine
659,930
100,710
15.3%
$208
$2,069
84.4%
Maryland
2,986,140
415,000
13.9%
$955
$2,301
84.6%
Massachusetts
3,457,190
400,490
11.6%
$836
$2,086
86.0%
Michigan
4,762,900
784,650
16.5%
$1,944
$2,478
86.1%
Minnesota
2,772,370
334,270
12.1%
$728
$2,177
86.5%
Mississippi
1,235,430
373,560
30.2%
$1,073
$2,872
88.0%
Missouri
2,811,860
501,960
17.9%
$1,216
$2,422
87.7%
Montana
506,480
79,030
15.6%
$168
$2,130
86.0%
Nebraska
905,980
132,350
14.6%
$311
$2,346
87.4%
Nevada
1,417,820
264,580
18.7%
$637
$2,406
86.5%
New Hampshire
707,220
74,760
10.6%
$146
$1,952
84.4%
New Jersey
4,437,890
613,510
13.8%
$1,419
$2,313
84.0%
New Mexico
922,350
210,550
22.8%
$516
$2,451
89.3%
New York
9,694,910
1,724,470
17.8%
$3,995
$2,317
83.2%
Congressional Research Service
24
link to page 27 link to page 27 link to page 29 link to page 29 The Earned Income Tax Credit (EITC): How It Works and Who Receives It
Percentage
Percent
Tax
of Total
Received
Returns
Tax
Total
as
Total Tax
with
Returns
EITC
Average
Refundable
State or Area
Returns
EITC
with EITC
(millions)
EITC
Portion
North Carolina
4,577,930
932,590
20.4%
$2,311
$2,478
86.6%
North Dakota
362,960
44,320
12.2%
$95
$2,135
87.5%
Ohio
5,620,590
931,330
16.6%
$2,262
$2,429
88.0%
Oklahoma
1,630,030
339,720
20.8%
$859
$2,529
86.7%
Oregon
1,938,620
275,810
14.2%
$577
$2,091
86.2%
Pennsylvania
6,236,760
930,520
14.9%
$2,096
$2,253
88.1%
Rhode Island
536,640
82,980
15.5%
$189
$2,274
87.0%
South Carolina
2,240,570
488,320
21.8%
$1,244
$2,548
87.9%
South Dakota
419,370
61,420
14.6%
$137
$2,225
88.5%
Tennessee
3,035,970
633,590
20.9%
$1,600
$2,526
85.8%
Texas
12,520,960
2,707,110
21.6%
$7,328
$2,707
84.1%
Utah
1,325,780
190,360
14.4%
$437
$2,295
86.4%
Vermont
328,250
43,550
13.3%
$84
$1,932
83.5%
Virginia
3,961,000
610,040
15.4%
$1,417
$2,323
86.1%
Washington
3,568,430
434,900
12.2%
$935
$2,151
86.7%
West Virginia
766,720
149,900
19.6%
$351
$2,340
90.1%
Wisconsin
2,866,730
372,820
13.0%
$830
$2,227
87.9%
Wyoming
271,480
37,070
13.7%
$79
$2,129
87.3%
Other Areas
785,930
20,650
2.6%
$44
$2,114
95.7%
Source: Congressional Research Service, based on data from the Internal Revenue Service, Statistics of Income, SOI Tax Stats- Historic Table 2, (Total File, Al States) at https://www.irs.gov/statistics/soi-tax-stats-historic-table-2.
, and Total EITC Benefits for 2015, by Adjusted Gross Income
|
AGI |
Totals |
No Qualifying Children |
One Qualifying Child |
Two Qualifying Children |
Three or More Qualifying Children |
|
Average Credit |
|||||
|
Less than $5,000 |
$536 |
$214 |
$1259 |
$1516 |
$1842 |
|
$5,000 to $9,999 |
1537 |
438 |
2776 |
3095 |
3463 |
|
$10,000 to $14,999 |
2655 |
219 |
3305 |
5086 |
5719 |
|
$15,000 to $19,999 |
4175 |
207 |
3269 |
5430 |
6090 |
|
$20,000 to $24,999 |
3867 |
15 |
2728 |
4810 |
5558 |
|
$25,000 to $29,999 |
3036 |
0 |
2005 |
3876 |
4727 |
|
$30,000 to $34,999 |
2208 |
0 |
1248 |
2876 |
3783 |
|
$35,000 to $39,999 |
1509 |
0 |
614 |
1895 |
2785 |
|
$40,000 to $44,999 |
1138 |
0 |
402 |
1067 |
1797 |
|
$45,000 and higher |
689 |
0 |
0 |
505 |
816 |
|
Totals |
2440 |
294 |
2411 |
3830 |
4185 |
|
Total Returns with EITC |
|||||
|
Less than $5,000 |
2,601,793 |
1,889,859 |
436,819 |
201,374 |
73,740 |
|
$5,000 to $9,999 |
4,657,247 |
2,579,641 |
1,451,448 |
462,199 |
163,958 |
|
$10,000 to $14,999 |
6,249,889 |
2,469,718 |
1,950,933 |
1,352,646 |
476,591 |
|
$15,000 to $19,999 |
3,803,504 |
315,055 |
1,622,541 |
1,293,599 |
572,309 |
|
$20,000 to $24,999 |
2,871,259 |
11,992 |
1,437,242 |
965,174 |
456,851 |
|
$25,000 to $29,999 |
2,474,924 |
0 |
1,288,353 |
795,726 |
390,844 |
|
$30,000 to $34,999 |
2,126,651 |
0 |
1,073,220 |
694,718 |
358,713 |
|
$35,000 to $39,999 |
1,827,385 |
0 |
794,708 |
680,147 |
352,531 |
|
$40,000 to $44,999 |
933,831 |
0 |
206,319 |
449,258 |
278,254 |
|
$45,000 and higher |
535,225 |
0 |
0 |
218,935 |
316,290 |
|
Totals |
28,081,708 |
7,266,266 |
10,261,585 |
7,113,774 |
3,440,083 |
|
Total EITC Claimed ($ in Thousands) |
|||||
|
Less than $5,000 |
$1,394,768 |
$403,902 |
$549,739 |
$305,264 |
$135,860 |
|
$5,000 to $9,999 |
7,156,186 |
1,128,837 |
4,029,193 |
1,430,309 |
567,847 |
|
$10,000 to $14,999 |
16,592,719 |
539,916 |
6,447,781 |
6,879,588 |
2,725,435 |
|
$15,000 to $19,999 |
15,879,928 |
65,363 |
5,304,565 |
7,024,466 |
3,485,534 |
|
$20,000 to $24,999 |
11,102,536 |
177 |
3,920,324 |
4,642,962 |
2,539,073 |
|
$25,000 to $29,999 |
7,514,991 |
0 |
2,583,186 |
3,084,268 |
1,847,536 |
|
$30,000 to $34,999 |
4,694,628 |
0 |
1,339,567 |
1,998,221 |
1,356,841 |
|
$35,000 to $39,999 |
2,758,143 |
0 |
487,696 |
1,288,627 |
981,821 |
|
$40,000 to $44,999 |
1,062,476 |
0 |
82,985 |
479,451 |
500,040 |
|
$45,000 and higher |
368,600 |
0 |
0 |
110,581 |
258,020 |
|
Totals |
68,524,975 |
2,138,197 |
24,745,035 |
27,243,735 |
14,398,008 |
Source: Congressional Research Service, based on data from the Internal Revenue Service, Statistics of Income, SOI Tax Stats-Individual Statistical Tables by Size of Adjusted Gross Income, Table 2.5.
|
State or Area |
Total Returns |
Returns with EITC Claimed |
Percentage of Total Returns with EITC Claimed |
Total EITC Claimed (In $1,000s) |
Average EITC |
Percent of EITC Refunded |
|
|
United States |
149,726,990 |
27,995,920 |
18.7% |
$68,061,561 |
$2,431 |
86.0% |
|
|
Alabama |
2,053,780 |
521,470 |
25.4% |
1,444,699 |
2,770 |
88.6% |
|
|
Alaska |
362,250 |
47,960 |
13.2% |
99,054 |
2,065 |
88.5% |
|
|
Arizona |
2,904,950 |
608,240 |
20.9% |
1,557,532 |
2,561 |
87.1% |
|
|
Arkansas |
1,229,100 |
308,760 |
25.1% |
806,570 |
2,612 |
88.1% |
|
|
California |
17,759,720 |
3,263,270 |
18.4% |
7,655,742 |
2,346 |
83.0% |
|
|
Colorado |
2,617,250 |
376,800 |
14.4% |
814,851 |
2,163 |
85.4% |
|
|
Connecticut |
1,761,060 |
231,080 |
13.1% |
501,490 |
2,170 |
86.2% |
|
|
Delaware |
452,740 |
77,080 |
17.0% |
181,160 |
2,350 |
89.8% |
|
|
District of Columbia |
344,720 |
55,840 |
16.2% |
127,184 |
2,278 |
87.6% |
|
|
Florida |
9,627,280 |
2,217,830 |
23.0% |
5,455,386 |
2,460 |
83.9% |
|
|
Georgia |
4,442,630 |
1,132,700 |
25.5% |
3,097,961 |
2,735 |
86.1% |
|
|
Hawaii |
688,570 |
110,700 |
16.1% |
239,484 |
2,163 |
88.4% |
|
|
Idaho |
721,890 |
138,500 |
19.2% |
318,997 |
2,303 |
86.2% |
|
|
Illinois |
6,161,970 |
1,039,170 |
16.9% |
2,573,670 |
2,477 |
85.4% |
|
|
Indiana |
3,104,540 |
563,530 |
18.2% |
1,351,269 |
2,398 |
88.3% |
|
|
Iowa |
1,454,290 |
214,700 |
14.8% |
482,748 |
2,248 |
88.0% |
|
|
Kansas |
1,339,150 |
217,330 |
16.2% |
512,239 |
2,357 |
88.7% |
|
|
Kentucky |
1,909,930 |
412,530 |
21.6% |
989,797 |
2,399 |
87.7% |
|
|
Louisiana |
1,994,080 |
531,070 |
26.6% |
1,485,851 |
2,798 |
87.9% |
|
|
Maine |
645,700 |
105,390 |
16.3% |
217,302 |
2,062 |
84.8% |
|
|
Maryland |
2,963,630 |
438,130 |
14.8% |
1,011,898 |
2,310 |
84.8% |
|
|
Massachusetts |
3,397,100 |
421,560 |
12.4% |
871,023 |
2,066 |
86.9% |
|
|
Michigan |
4,717,510 |
827,230 |
17.5% |
2,020,128 |
2,442 |
86.1% |
|
|
Minnesota |
2,725,190 |
350,470 |
12.9% |
760,353 |
2,170 |
87.2% |
|
|
Mississippi |
1,244,720 |
393,610 |
31.6% |
1,128,013 |
2,866 |
88.5% |
|
|
Missouri |
2,787,760 |
527,020 |
18.9% |
1,270,289 |
2,410 |
88.2% |
|
|
Montana |
498,500 |
82,100 |
16.5% |
174,131 |
2,121 |
86.7% |
|
|
Nebraska |
899,330 |
138,330 |
15.4% |
321,924 |
2,327 |
88.0% |
|
|
Nevada |
1,350,730 |
264,090 |
19.6% |
639,724 |
2,422 |
87.2% |
|
|
New Hampshire |
693,090 |
79,710 |
11.5% |
156,004 |
1,957 |
85.1% |
|
|
New Jersey |
4,385,670 |
630,980 |
14.4% |
1,453,381 |
2,303 |
84.5% |
|
|
New Mexico |
917,450 |
220,320 |
24.0% |
537,800 |
2,441 |
89.7% |
|
|
New York |
9,614,610 |
1,830,650 |
19.0% |
4,258,153 |
2,326 |
83.5% |
|
|
North Carolina |
4,457,230 |
970,220 |
21.8% |
2,396,002 |
2,470 |
87.2% |
|
|
North Dakota |
369,370 |
44,360 |
12.0% |
93,540 |
2,109 |
87.8% |
|
|
Ohio |
5,592,150 |
975,220 |
17.4% |
2,354,212 |
2,414 |
88.3% |
|
|
Oklahoma |
1,642,080 |
350,820 |
21.4% |
877,455 |
2,501 |
87.4% |
|
|
Oregon |
1,874,490 |
294,750 |
15.7% |
616,661 |
2,092 |
87.3% |
|
|
Pennsylvania |
6,200,560 |
961,610 |
15.5% |
2,149,696 |
2,236 |
88.3% |
|
|
Rhode Island |
527,510 |
86,640 |
16.4% |
196,016 |
2,262 |
87.3% |
|
|
South Carolina |
2,169,730 |
507,760 |
23.4% |
1,289,787 |
2,540 |
88.3% |
|
|
South Dakota |
415,380 |
63,560 |
15.3% |
140,910 |
2,217 |
89.1% |
|
|
Tennessee |
2,970,180 |
668,500 |
22.5% |
1,690,333 |
2,529 |
86.4% |
|
|
Texas |
12,151,810 |
2,732,930 |
22.5% |
7,349,094 |
2,689 |
84.7% |
|
|
Utah |
1,263,690 |
201,390 |
15.9% |
469,097 |
2,329 |
87.3% |
|
|
Vermont |
326,090 |
45,920 |
14.1% |
88,414 |
1,925 |
84.1% |
|
|
Virginia |
3,911,870 |
638,150 |
16.3% |
1,472,705 |
2,308 |
86.9% |
|
|
Washington |
3,432,600 |
462,860 |
13.5% |
995,541 |
2,151 |
87.6% |
|
|
West Virginia |
780,960 |
159,640 |
20.4% |
364,329 |
2,282 |
90.4% |
|
|
Wisconsin |
2,840,650 |
393,450 |
13.9% |
873,417 |
2,220 |
88.2% |
|
|
Wyoming |
278,610 |
38,090 |
13.7% |
80,353 |
2,110 |
88.2% |
|
|
Other Areas |
751,180 |
21,900 |
2.9% |
48,192 |
2,201 |
95.9% |
|
Source: Congressional Research Service, based on data from the Internal Revenue Service, Statistics of Income, SOI Tax Stats-Individual Statistical Tables by Size of Adjusted Gross Income, Table 2.5.
Note: Totals in this table differ slightly from total shown in Table A-2. While the figures inin Table A-2 and Table A-3 are both based on data from the IRS, the data inin Table A-3 include "“substitutes for returns"” in which the IRS constructs tax returns for certain nonfilers. “Other Areas” includes, for example, returns filed from Army Post Office and Fleet Post Office addresses by members of the armed forces stationed overseas; returns filed by other U.S. citizens abroad; and returns filed by residents of Puerto Rico with income from sources outside Puerto Rico or with income earned as U.S. government employees.
Table A-4. EITC Participation Rates by State, 2009-2016
Participation rate
State
2016
2015
2014
2013
2012
2011
2010
2009
Alabama
79.8%
82.0%
82.1%
81.9%
82.1%
81.0%
79.9%
82.1%
Alaska
71.9%
72.8%
76.7%
78.5%
75.6%
81.2%
76.2%
71.0%
Arizona
76.7%
76.5%
77.4%
77.0%
76.6%
75.7%
74.5%
76.9%
Arkansas
80.0%
80.0%
80.6%
81.6%
81.6%
80.8%
80.9%
81.7%
California
73.8%
74.7%
75.8%
75.4%
74.3%
73.1%
71.0%
78.6%
Congressional Research Service
25
The Earned Income Tax Credit (EITC): How It Works and Who Receives It
Participation rate
State
2016
2015
2014
2013
2012
2011
2010
2009
Colorado
74.5%
73.8%
74.5%
73.9%
73.5%
74.9%
71.6%
75.5%
Connecticut
78.6%
79.2%
78.6%
78.9%
81.3%
77.7%
77.1%
79.6%
Delaware
74.0%
78.5%
79.4%
82.3%
82.0%
83.6%
77.9%
79.8%
District of Columbia
71.0%
82.0%
71.9%
72.2%
75.2%
76.1%
74.0%
75.0%
Florida
81.7%
82.0%
82.1%
83.4%
82.8%
82.6%
81.0%
81.0%
Georgia
79.9%
80.9%
81.2%
80.8%
80.8%
79.1%
79.0%
81.2%
Hawai
81.7%
80.9%
82.5%
84.9%
80.2%
79.9%
81.1%
81.8%
Idaho
78.5%
78.5%
81.2%
80.1%
83.2%
78.3%
83.2%
80.1%
Il inois
78.5%
78.3%
79.0%
79.2%
78.5%
77.5%
77.7%
81.5%
Indiana
79.5%
81.8%
80.5%
82.8%
80.7%
80.7%
81.0%
83.0%
Iowa
79.3%
78.7%
79.2%
79.6%
79.1%
78.7%
79.3%
80.8%
Kansas
74.9%
77.3%
77.1%
79.8%
78.3%
79.2%
78.2%
78.0%
Kentucky
81.5%
82.0%
80.5%
81.1%
82.7%
81.9%
79.6%
81.4%
Louisiana
80.4%
79.2%
80.2%
80.5%
81.7%
81.4%
80.0%
80.4%
Maine
77.9%
79.5%
81.0%
77.9%
81.5%
80.4%
79.3%
81.4%
Maryland
78.3%
78.8%
77.6%
78.7%
78.3%
79.4%
76.4%
80.0%
Massachusetts
79.4%
80.8%
80.0%
79.8%
79.7%
78.1%
77.0%
78.0%
Michigan
80.4%
80.9%
80.9%
82.0%
81.6%
81.9%
80.4%
81.0%
Minnesota
78.9%
78.9%
78.7%
80.6%
79.7%
79.4%
78.0%
79.3%
Mississippi
82.4%
84.8%
84.1%
84.7%
84.5%
84.3%
85.2%
83.1%
Missouri
78.4%
80.7%
80.3%
80.0%
80.9%
81.0%
79.9%
80.2%
Montana
78.7%
77.4%
76.0%
76.5%
78.4%
80.3%
77.3%
74.6%
Nebraska
82.4%
76.9%
79.9%
78.1%
80.2%
77.6%
79.0%
83.3%
Nevada
74.6%
75.3%
76.3%
75.4%
73.7%
73.6%
71.5%
76.9%
New Hampshire
74.6%
80.6%
78.4%
79.9%
79.3%
81.5%
77.4%
80.3%
New Jersey
77.5%
78.8%
78.6%
77.2%
79.1%
77.8%
75.7%
79.7%
New Mexico
78.2%
75.3%
80.8%
82.1%
81.1%
81.8%
75.7%
81.4%
New York
81.7%
82.5%
82.4%
82.9%
82.8%
82.5%
79.7%
82.6%
North Carolina
79.9%
80.2%
80.0%
81.0%
81.0%
77.2%
76.9%
79.9%
North Dakota
78.2%
82.9%
83.0%
80.4%
76.1%
82.4%
82.3%
80.4%
Ohio
81.3%
82.3%
82.6%
82.0%
81.6%
82.5%
81.4%
82.0%
Oklahoma
74.2%
76.7%
76.1%
77.5%
78.1%
78.4%
75.8%
78.2%
Oregon
73.4%
75.5%
72.5%
74.4%
73.4%
72.6%
71.0%
74.7%
Pennsylvania
80.9%
82.4%
82.0%
82.6%
82.2%
81.7%
81.9%
81.7%
Rhode Island
85.8%
84.3%
82.8%
81.3%
81.2%
84.9%
81.0%
83.1%
South Carolina
78.4%
79.6%
80.9%
81.9%
84.5%
82.0%
80.3%
81.1%
Congressional Research Service
26
The Earned Income Tax Credit (EITC): How It Works and Who Receives It
Participation rate
State
2016
2015
2014
2013
2012
2011
2010
2009
South Dakota
82.8%
77.2%
82.5%
84.6%
81.1%
83.0%
84.2%
77.8%
Tennessee
81.4%
81.8%
80.9%
83.2%
83.0%
82.0%
80.1%
81.2%
Texas
77.8%
78.5%
79.1%
79.5%
79.1%
78.3%
76.8%
80.9%
Utah
75.0%
74.9%
75.2%
76.3%
77.3%
75.3%
75.0%
78.2%
Vermont
84.0%
80.3%
80.7%
81.9%
80.6%
79.0%
82.9%
82.6%
Virginia
78.7%
79.5%
80.5%
81.1%
80.7%
79.8%
79.0%
79.5%
Washington
74.8%
75.3%
76.9%
78.0%
76.8%
76.4%
73.1%
76.5%
West Virginia
80.9%
82.2%
83.2%
82.6%
81.1%
83.4%
83.1%
80.0%
Wisconsin
79.6%
79.1%
80.0%
78.8%
78.4%
79.9%
78.3%
81.7%
Wyoming
74.6%
76.9%
79.8%
78.1%
78.6%
77.7%
76.3%
73.6%
Source: IRS-ACS Match- Center for Administrative Records Research and Applications, U.S. Census Bureau in col aboration with IRS. Data can be found at https://www.eitc.irs.gov/eitc-central/participation-rate/eitc-participation-rate-by-states. Notes: The IRS data used in these estimates based on the year of the tax return. In other words, 2016 data reflects tax data from 2016 income tax returns, general y filed in 2017. The national EITC participation rate is estimated using the Census Bureau’s Current Population Survey (CPS) and hence not directly comparable to these state estimates which are based on the American Community Survey (ACS).
Author Information
Margot L. Crandall-Hollick
Gene Falk
Acting Section Research Manager
Specialist in Social Policy
Acknowledgments
The authors would like to thank Joseph Hughes, Research Assistant in the Government Finance and Taxation Section, for his assistance in updating this report and CRS graphics specialist Jamie Hutchinson for creating the original figures in this report.
Congressional Research Service
27
The Earned Income Tax Credit (EITC): How It Works and Who Receives It
Disclaimer
This document was prepared by the Congressional Research Service (CRS). CRS serves as nonpartisan shared staff to congressional committees and Members of Congress. It operates solely at the behest of and under the direction of Congress. Information in a CRS Report should n ot be relied upon for purposes other than public understanding of information that has been provided by CRS to Members of Congress in connection with CRS’s institutional role. CRS Reports, as a work of the United States Government, are not subject to copyright protection in the United States. Any CRS Report may be reproduced and distributed in its entirety without permission from CRS. However, as a CRS Report may include copyrighted images or material from a third party, you may need to obtain the permission of the copyright holder if you wish to copy or otherwise use copyrighted material.
Congressional Research Service
R43805 · VERSION 11 · UPDATED
28 which the IRS constructs tax returns for certain nonfilers.
Author Contact Information
Acknowledgments
The authors would like to thank Clarissa Gregory, Research Assistant in the Domestic Social Policy Section, for her assistance in updating this report and CRS graphics specialist Jamie Hutchinson for creating the original figures in this report.
Footnotes
| 1. |
The original title of the law, the Tax Cuts and Jobs Act, was stricken before final passage because it violated what is known as the Byrd rule, a procedural rule that can be raised in the Senate when bills, like the tax bill, are considered under the process of reconciliation. The actual title of the law is "To provide for reconciliation pursuant to titles II and V of the concurrent resolution on the budget for fiscal year 2018." For more information on the Byrd rule, see CRS Report RL30862, The Budget Reconciliation Process: The Senate's "Byrd Rule", by [author name scrubbed] |
| 2. |
For more information on the changes made to the tax code by P.L. 115-97, see CRS Report R45092, The 2017 Tax Revision (P.L. 115-97): Comparison to 2017 Tax Law, coordinated by [author name scrubbed] and [author name scrubbed]. |
| 3. |
For more information, see Michael Ng and David Wessel, Up Front | The Hutchins Center Explains: The Chained CPI, The Brookings Institution, December 7, 2017, https://www.brookings.edu/blog/up-front/2017/12/07/the-hutchins-center-explains-the-chained-cpi/. |
| 4. |
A tax filer who is claimed as a dependent on another person's tax return is ineligible for the EITC. |
| 5. |
There is an additional filing status that may claim the EITC—"qualifying widow(er) with dependent child." Generally, tax filers may file their tax return as married filing jointly in the year their spouse died. A tax filer may be eligible to use qualifying widow(er) with dependent child as his or her filing status for two years following the year his or her spouse died. This filing status entitles the tax filer to use joint return tax rates and the highest standard deduction amount (if he or she does not itemize deductions). It does not entitle the tax filer to file a joint return. The tax filer calculates the EITC using the formula for other unmarried tax filing statuses (head of household and single). The eligibility rules for this filing status can be found on page 10 of IRS Publication 501, available at http://www.irs.gov/pub/irs-pdf/p501.pdf. |
| 6. |
The 2017 version of this form can be found at https://www.irs.gov/pub/irs-pdf/f1040sei.pdf. |
| 7. |
For more information, see https://www.irs.gov/credits-deductions/individuals/earned-income-tax-credit/special-eitc-rules. |
| 8. |
See Internal Revenue Code (IRC) §32(c)(1)(C) and http://www.irs.gov/Individuals/EITC,-Earned-Income-Tax-Credit,-Questions-and-Answers. |
| 9. |
If an individual is the qualifying child for the purposes of the EITC of another person, that individual cannot themselves claim the EITC. For more information, see http://www.irs.gov/Individuals/EITC,-Earned-Income-Tax-Credit,-Questions-and-Answers. |
| 10. |
If placed by an authorized agency or court order. |
| 11. |
Qualifying children who reside with a servicemember who is stationed outside the United States while serving on extended active duty with the U.S. Armed Forces are considered to reside in the United States for the purposes of the EITC. |
| 12. |
Currently, there is no federal regulation which states that taxpayers with a qualifying child who do not claim that qualifying child for the EITC are ineligible for the credit. However, the website of the Internal Revenue Service does state that such individuals are ineligible for the childless EITC. For more information, see https://www.irs.gov/credits-deductions/individuals/earned-income-tax-credit/qualifying-child-of-more-than-one-person. |
| 13. |
The tie-breaker rules are: (1) if both tax filers are parents of the child, the parent with whom the child resided the longest during the year claims the child for the EITC; (2) if the child resided with each parent for the same amount of time during the year, the parent with the highest adjusted gross income (AGI) claims the child for the EITC; (3) if only one tax filer is the parent of the child, the tax filer who is the parent claims the child for the EITC; and (4) if neither tax filer is the parent of the child, the tax filer with the highest AGI claims the child for the EITC. |
| 14. |
See IRC §32(k). |
| 15. |
For more information on Social Security numbers valid for work purposes, see SSA, Social Security Number for Noncitizens, at https://www.socialsecurity.gov/pubs/EN-05-10096.pdf; CRS Report R43840, Federal Income Taxes and Noncitizens: Frequently Asked Questions, by [author name scrubbed] and [author name scrubbed]; CRS Report R44290, Legal Authority for Aliens to Claim Refundable Tax Credits: In Brief, by [author name scrubbed]. |
| 16. |
See IRC §32(m). |
| 17. |
Nonresident aliens may be eligible to claim the credit if they are married to a U.S. citizen or resident alien, make the election to be treated as a resident alien, and file a joint return. For more information on the tax treatment of nonresident aliens, see CRS Report RS21732, Federal Taxation of Aliens Working in the United States, by [author name scrubbed] (available to congressional clients upon request); CRS Report R43840, Federal Income Taxes and Noncitizens: Frequently Asked Questions, by [author name scrubbed] and [author name scrubbed]. |
| 18. |
The tables can be found, for 2017 returns, beginning on page 62 of the Form 1040 general instructions, at https://www.irs.gov/pub/irs-pdf/i1040gi.pdf. |
| 19. |
Before 2011, any persons with a qualified child eligible for the EITC could elect to receive advance payment of the credit through the employer's payroll withholding system by filing an eligibility certificate (Form W-5) with his or her employer. The option was little used and eliminated by P.L. 111-226. |
| 20. |
For more information, see IRS Statistics of Income, Table 2.5 at http://www.irs.gov/uac/SOI-Tax-Stats—Individual-Statistical-Tables-by-Size-of-Adjusted-Gross-Income. |
| 21. |
These taxes include the regular income tax and alternative income tax, as well as self-employment taxes. Less common taxes, like unreported Social Security and Medicare taxes and certain taxes on IRAs, are also included. For an example of these taxes, see lines 57 through 62 on the 2016 IRS Form 1040, https://www.irs.gov/pub/irs-pdf/f1040.pdf. |
| 22. |
The Protecting Americans from Tax Hikes (PATH) Act (Division Q of P.L. 114-113) prevents a tax filer from claiming the EITC for any year in which the filer did not have a Social Security number (SSN) on or before the due date of the tax return for that year. This provision prevents a filer who obtains an SSN from retroactively claiming the EITC for any prior open tax years (generally three years) when the filer did not have an SSN at the time those years' returns were due. |
| 23. |
This was effective beginning with returns filed in 2017. Section 201 of the Protecting Americans from Tax Hikes (PATH) Act (Division Q of P.L. 114-113). |
| 24. |
For more information on the nonrefundable (and refundable) portion of the child tax credit, see CRS Report R41873, The Child Tax Credit: Current Law and Legislative History, by [author name scrubbed]. |
| 25. |
In contrast, if the precontribution income places them in the plateau or the phase-in range, decreasing their earned income by making certain pretax savings contributions may either have no impact or result in a smaller credit. |
| 26. |
The Tax Relief, Unemployment Insurance Reauthorization, and Job Creation Act of 2010 (P.L. 111-312) included a provision which made tax refunds, including those resulting from the EITC, disregarded in the administration of federal programs and federally assisted programs. At the end of 2012, this provision was made permanent by the American Taxpayer Relief Act of 2012 (P.L. 112-240). |
| 27. |
U.S. Congress, Senate Committee on Finance, Tax Reduction Act of 1975, Report to Accompany H.R. 2166, 94th Cong., 1st sess., March 17, 1975, S. Rept. 94-36, p. 33. |
| 28. |
The increase in the value of the credit in 2009 is likely due to the changes made by the American Recovery and Reinvestment Act of 2009 (ARRA, P.L. 111-5) which expanded the credit for families with three or more children and increased marriage penalty relief. |