NASA Appropriations and Authorizations: At a Glance
Changes from September 11, 2017 to December 22, 2017
This page shows textual changes in the document between the two versions indicated in the dates above. Textual matter removed in the later version is indicated with red strikethrough and textual matter added in the later version is indicated with blue.
Congressional deliberations about the National Aeronautics and Space Administration (NASA) often focus on the availability of funding. This fact sheet provides data on past, current, and proposed NASA appropriations. No bills have yet been introduced in the 115th Congress proposing future-year authorizations of NASA appropriations.
Additional information on appropriations legislation affecting NASA is provided in CRS Report R44877, Overview of FY2018 Appropriations for Commerce, Justice, Science, and Related Agencies (CJS) and similar reports for prior years.1 NASA issues of congressional interest are discussed further in CRS Report R43144, NASA: Issues for Authorization, Appropriations, and Oversight in the 114th Congress.
Table 1 shows appropriations for NASA from FY2012 through FY2017. The data for FY2012 through FY2016 include supplemental appropriations, rescissions, transfers, reprogramming, and, in the case of FY2013, sequestration. They are taken from NASA's congressional budget justifications for FY2014 through FY2018.2 Congressional budget justifications are available on the NASA budget website (http://www.nasa.gov/news/budget/) for the current year and for past years back to FY2002. The table data for FY2017 are as enacted by the Consolidated Appropriations Act, 2017 (P.L. 115-31). For amounts not specified in that act, see pp. H3374-H3375 of the explanatory statement, published in the Congressional Record on May 3, 2017.
Table 2 shows enacted appropriations for FY2017 (as above); the Administration's request for FY2018; the House Committee on Appropriations recommendations for FY2018, as contained in H.R. 3267 as reported and H.Rept. 115-231 as well as H.R. 3354 as passed by the House; and the Senate Committee on Appropriations recommendations for FY2018, as contained in S. 1662 as reported and S.Rept. 115-139.
The Continuing Appropriations Act, 2018 (Division D of H.R. 601)P.L. 115-56), as amended, provides FY2018 continuing appropriations for NASA until December 8, 2017January 19, 2018. The rate is based on the level of FY2017 appropriations—not including $109 million in FY2017 emergency appropriations (see note to Table 2)—reduced by 0.6791 percent%.
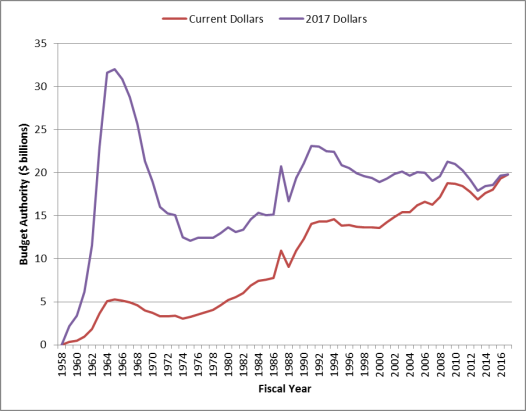
Figure 1 shows NASA's total annual budget authority from the agency's establishment in FY1958 to FY2017, in both current dollars and inflation-adjusted FY2017 dollars.
|
FY2012 |
FY2013 |
FY2014 |
FY2015 |
FY2016 |
FY2017 |
|||||||
|
Science |
|
|
|
|
|
|
||||||
|
Earth Science |
|
|
|
|
|
|
||||||
|
Planetary Science |
|
|
|
|
|
|
||||||
|
Astrophysics |
|
|
|
|
|
|
||||||
|
James Webb Space Telescope |
|
|
|
|
|
|
||||||
|
Heliophysics |
|
|
|
|
|
|
||||||
|
Aeronautics |
|
|
|
|
|
|
||||||
|
Space Technology |
|
|
|
|
|
|
||||||
|
Exploration |
|
|
|
|
|
|
||||||
|
Exploration Systems Development |
|
|
|
|
|
|
||||||
|
Orion MPCV |
|
|
|
|
|
|
||||||
|
Space Launch System |
|
|
|
|
|
|
||||||
|
Exploration Ground Systems |
|
|
|
|
|
|
||||||
|
Commercial Spaceflight |
|
|
|
|
|
|
||||||
|
Exploration R&D |
|
|
|
|
|
|
||||||
|
Space Operations |
|
|
|
|
|
|
||||||
|
Space Shuttle |
|
|
|
|
|
|
||||||
|
International Space Station |
|
|
|
|
|
|
||||||
|
Space Transportation |
|
|
|
|
|
|
||||||
|
Space and Flight Support |
|
|
|
|
|
|
||||||
|
Education |
|
|
|
|
|
|
||||||
|
Space Grant |
|
|
|
|
|
|
||||||
|
EPSCoR |
|
|
|
|
|
|
||||||
|
MUREP |
|
|
|
|
|
|
||||||
|
Other |
|
|
|
|
|
|
||||||
|
Safety, Security, and Mission Services |
|
|
|
|
|
|
||||||
|
Construction and EC&R |
|
|
|
|
|
|
||||||
|
Inspector General |
|
|
|
|
|
|
||||||
|
Total |
|
|
|
|
|
|
Sources: FY2012-FY2016 from NASA FY2014-FY2018 congressional budget justifications. FY2017 from P.L. 115-31 and explanatory statement, Congressional Record, May 3, 2017, pp. H3374-H3375. See text for details.
Notes: Some totals may not add because of rounding. MPCV = Multipurpose Crew Vehicle. R&D = Research and Development. EPSCoR = Established Program to Stimulate Competitive Research. MUREP = Minority University Research and Education Program. EC&R = Environmental Compliance and Remediation. n/s = not specified.
a.
Included in Space Transportation under Space Operations.
b.
Commercial Crew funded under Exploration. Remainder of Space Transportation included in International Space Station.
c.
Includes up to $1,185 million for Commercial Crew.
d.
Includes $14 million (after sequestration) of supplemental funding from the Disaster Relief Appropriations Act, 2013 (P.L. 113-2) that is not shown in the NASA FY2015 congressional budget justification.
e.
Includes $109 million in emergency funding (from Sec. 540 of P.L. 115-31) for repairs at NASA facilities damaged by natural disasters.
f.
Includes rescission of $1 million from prior-year accounts not shown in the table.
|
FY2018 |
||||||||||
|
FY2017 |
Request |
H. Cte. |
S. Cte. |
Enacted |
||||||
|
Science |
|
|
|
|
|
|||||
|
Earth Science |
|
|
|
|
|
|||||
|
Planetary Science |
|
|
|
|
|
|||||
|
Astrophysics |
|
|
|
|
|
|||||
|
James Webb Space Telescope |
|
|
|
|
|
|||||
|
Heliophysics |
|
|
|
|
|
|||||
|
Aeronautics |
|
|
|
|
|
|||||
|
Space Technology |
|
|
|
|
|
|||||
|
Exploration |
|
|
|
|
|
|||||
|
Exploration Systems Development |
|
|
|
|
|
|||||
|
- Orion MPCV |
|
|
|
|
|
|||||
|
- Space Launch System |
|
|
|
|
|
|||||
|
- Exploration Ground Systems |
|
|
|
|
|
|||||
|
Exploration R&D |
|
|
|
|
|
|||||
|
Space Operations |
|
|
|
|
|
|||||
|
International Space Station |
|
|
|
|
|
|||||
|
Space Transportation |
|
|
|
|
|
|||||
|
Space and Flight Support |
|
|
|
|
|
|||||
|
Education |
|
|
|
|
|
|||||
|
Space Grant |
|
|
|
|
|
|||||
|
EPSCoR |
|
|
|
|
|
|||||
|
MUREP |
|
|
|
|
|
|||||
|
Other |
|
|
|
|
|
|||||
|
Safety, Security, and Mission Services |
|
|
|
|
|
|||||
|
Construction and EC&R |
|
|
|
|
|
|||||
|
Inspector General |
|
|
|
|
|
|||||
|
Total |
|
|
|
|
|
|||||
Sources: FY2017 from P.L. 115-31 and explanatory statement, Congressional Record, May 3, 2017, pp. H3374-H3375. FY2018 request from FY2018 NASA congressional budget justification. FY2018 House committee from H.R. 3267 as reported andH.Rept. 115-231and H.Rept. 115-231 as well as H.R. 3354 as passed by the House. FY2018 Senate committee from S. 1662 as reported andSand S.Rept. 115-139. See text for details.
Notes: Some totals may not add because of rounding. MPCV = Multipurpose Crew Vehicle. R&D = Research and Development. EPSCoR = Established Program to Stimulate Competitive Research. MUREP = Minority University Research and Education Program. EC&R = Environmental Compliance and Remediation. n/s = not specified.
a.
Includes up to $1,185 million for Commercial Crew.
b.
Includes $109 million in emergency funding (from Sec. 540 of P.L. 115-31) for repairs at NASA facilities damaged by natural disasters.
 |
|
Source: FY1958-FY2008 from National Aeronautics and Space Administration, Aeronautics and Space Report of the President: Fiscal Year 2008 Activities, http://history.nasa.gov/presrep2008.pdf, Table D-1A. FY2009-FY2011 from NASA congressional budget justifications, FY2011-FY2013. FY2012-FY2017 as in Table 1. Current dollars deflated to FY2017 dollars using GDP (chained) price index from President's budget for FY2018, Historical Table 10.1, https://www.whitehouse.gov/sites/whitehouse.gov/files/omb/budget/fy2018/hist10z1.xls. Note: Transition quarter between FY1976 and FY1977 not shown. |
Author Contact Information
Footnotes
| 1. |
See, for example, CRS Report R44409, Overview of FY2017 Appropriations for Commerce, Justice, Science, and Related Agencies (CJS); CRS Report R43918, Overview of FY2016 Appropriations for Commerce, Justice, Science, and Related Agencies (CJS); CRS Report R43509, Commerce, Justice, Science, and Related Agencies: FY2015 Appropriations, CRS Report R43080, Commerce, Justice, Science, and Related Agencies: FY2014 Appropriations; CRS Report R42440, Commerce, Justice, Science, and Related Agencies: FY2013 Appropriations; and CRS Report R41721, Commerce, Justice, Science, and Related Agencies: FY2012 Appropriations. |
| 2. |
FY2016 Education amounts are not shown in the FY2018 congressional budget justification and are instead taken from the explanatory statement for the Consolidated Appropriations Act, 2016 (P.L. 114-113), Congressional Record, December 17, 2015, pp. H9741-H9743. |