Railroad Retirement Board: Trust Fund Investment Practices
Changes from August 25, 2017 to January 10, 2019
This page shows textual changes in the document between the two versions indicated in the dates above. Textual matter removed in the later version is indicated with red strikethrough and textual matter added in the later version is indicated with blue.
Contents
- Background
- History of the Trust
- Structure of the Trust
- Independence
- Goals
- Impact on Railroad Retirement Tier II Tax Rates
- Investment Guidelines
- Oversight
- Accounting in the Federal Budget
- Performance of the Trust
- Total RRB Assets
- Comparison to Benchmarks
- Administrative Expenses
Figures
Summary
Beginning in 2002, a significant portion of the assets of the Railroad Retirement Board (RRB) hasThe Railroad Retirement Board (RRB), an independent federal agency, administers retirement, survivor, disability, unemployment, and sickness insurance for railroad workers and their families. Railroad retirement payroll taxes include two tiers—Tier I and Tier II taxes. The Tier I tax finances the Tier I railroad retirement benefit that is equivalent to Social Security benefits and the Tier II tax finances the Tier II benefit, Tier I benefits in excess of Social Security benefits, and supplemental annuities.
Since 2002, Tier II tax revenues in excess of obligatory RRB benefits and associated administrative costs have been invested in private stocks, bonds, and other investments. Prior to the Railroad Retirement and Survivors' Improvement Act of 2001, (RRSIA; P.L. 107-90), surplus railroad retirement assets could only be invested in U.S. government securities—just as the Social Security trust funds must be invested. The 2001 actRRSIA established the National Railroad Retirement Investment Trust (NRRIT; hereinafter, the Trust) to manage and invest part of the RRB's assets in much the same way that the assets of private-sector and most state and local government pension plans are invested. The remainder of RRB's assets continues to be invested solely in U.S. government securities.
Congress structured the Trust in an effort to ensure investment independenceto ensure independence of investment decisions and limit political interference. It also aimed to increase railroad retirement system funding, add enhanced benefits, potentially reduce taxes, and protect system financing in case of market downturns. The Trust's assets are invested in a diversified portfolio, both to minimize investment risk and to avoid disproportionate influence over an industry or firm. Since theThe Trust is a nongovernmental agency,tax-exempt entity independent of the federal government, and it is not subject to the same oversight as federal agencies. However, the act requires an annual management report to Congress.
From its inception in February 2002 to September 30, 2017, $21.3 billion has been transferred to the Trust from the RRB and $21.1 billion has been transferred from the Trust to pay railroad retirement benefits. At the end of FY2017, the net asset value of the Trust was $26.5 billion. The Trust's investments have generally followed the markets' recent performance. From FY2003 to FY2016, the Trust's annual returns averaged 7.9%, nearly matching expectations of the bill's drafters, who assumed nominal annual returns of 8.0%. The economic downturn did not spare the Trust, which lost 19.1% in FY2008 and 0.7% in FY2009. The Trust rebounded with an 11.2% rate of return in FY2010. This was followed by a slightly negative rate of return of -0.1% in FY2011. However, the Trust exceeded its own strategic policy benchmarks in FY2012, FY2013, and in FY2014 with a FY2014 rate of return of 10.2%. FY2015 once again experienced negative returns for the Trust with a rate of return of -1.5%. In FY2016, the annual return was 8.1RRSIA requires an annual management report to Congress.
2831 basis points in FY2016FY2017, and remain low when compared with other mutual funds.
The Trustcombined fair market value of Tier II taxes and Trust assets is designed to maintain four to six years' worth of benefits in case of lower-than-expected returnsRRB benefits and administrative expenses. To maintain this balance, the variable Railroad Retirement tierTier II tax rates automatically adjust as needed. This tax adjustment does not require congressional action. The Railroad Retirement tierTier II tax rates increased in 2013 and most recently in 20142015.
Background
The Railroad Retirement Act authorizes retirement, survivor, and disability benefits for railroad workers and their families.1 The Railroad Retirement Board (RRB), an independent federal agency, administers these benefits. Workers covered by the RRB include those employed by railroads engaged in interstate commerce and related subsidiaries, railroad associations, and railroad labor organizations. These benefits are earned by railroad workers and their families in lieu of Social Security.
Railroad retirement benefits are divided into two tiers. Tier I benefits are generally computed using the Social Security benefit formula, on the basis of earnings covered by either programthe Railroad Retirement or Social Security programs. In some cases, RRB tierTier I benefits can be higher than comparable Social Security benefits. For example, RRB beneficiaries may receive unreduced tierTier I retirement benefits as early as 60 years oldaged 60 if they have at least 30 years of railroad service; Social Security beneficiaries may receive unreduced retirement benefits only when they reach their full retirement ages, currently rising from ageaged 65 to 67. RRB tierTier II benefits are similar to private pension benefits and are based only on railroad work.2
History of the Trust
The Tier I railroad retirement benefit that is equivalent to Social Security benefits is mainly finance by Tier I payroll taxes (typically the same rate as the 12.4% Social Security payroll tax) and Social Security's financial interchange transfers.3 Tier II benefits, Tier I benefits in excess of Social Security benefits, and supplemental annuities4 are mainly financed by Tier II payroll taxes (currently 13.1% on employers and 4.9% on employees) and transfers from the National Railroad Retirement Investment Trust (NRRIT; hereinafter, the Trust).Beginning in 2002, a significant portion of railroad retirement assets have been
, (RRSIA; P.L. 107-90), surplus railroad retirement assets could only be invested only in U.S. government securities—just as the Social Security trust funds must be invested.35 The 2001 act established the National Railroad Retirement Investment Trust (NRRIT; hereinafter, the Trust)RRSIA established the Trust to manage and invest assets in the Railroad Retirement Account in much the same way that the assets of private-sector retirement plans are invested. The Railroad Retirement Account is used to fund RRB tier II benefits and supplemental annuities. This account is also used to pay for tier I benefits that are higher than equivalent Social Security benefits, such as early retirement benefits for railroad employees with at least 30 years of railroad service. Assets in the Social Security Equivalent Benefits Account, which is used for RRB tier I benefits that are equivalent to Social Security benefits, continue to be invested solely in U.S. government bonds, as required by law.
Since February 2002 when railroad retirement funds were first invested through the Trust, a total of $21.3 billion has been transferred to the Trust from the RRB,6 and $21.1 billion in earnings have been transferred from the Trust to the RRB to pay railroad benefits and administrative expenses.7 From its inception to the end of FY2017, the Trust has earned a total of $26.3 billion. At the end of FY2017, the market value of the Trust's managed assets was $26.5 billion.8
Structure of the Trust
Independence
Congress structured the Trust to be independent and to resistfree of political interference. As such, the Trust is a tax-exempt entity independent of the RRB and is not part of the federal government. It has no responsibilities for administering RRB benefits. The Trustees of the TrustTrust's trustees are required to act solely in the interest of the RRB and the participants in the railroad retirement system participants. The fiduciary rules governing the Trusteestrustees are similar to those required by the law that governs the private pension system, the Employee Retirement Income Security Act (ERISA).4
The board of the Trust is made up of seven Trusteestrustees who have expertise in managing financial investments and pension plans. Three of the Trusteestrustees are selected by railroad labor unions, three by railroad management, and one by the other six Trustees. Each of the Trustees' terms is three years. The Trustees hire a professional staff to handle day-to-day operations of the Trust and independent investment managers to invest the assets of the Trusttrustees. Each trustee serve a three-year term. A professional staff handles the Trust's day-to-day operations.
Independent investment managers invest the Trust's assets according to the investment guidelines established by the Trustees.
trustees. Each investment manager may control no more than 10% of the Trust's assets. Each manager ;
must vote all proxies he or she holds in the Trust's portfolio in the sole interest of railroad retirement participants and beneficiaries, in accordance with written guidelines provided by the Trust. Votes must also be recorded and provided to the Trust upon request. Finally, all investment managers ;
must certify each year that all proxies have been voted in the sole interest of railroad retirement participants and beneficiaries.5
; and
must record votes and provide them to the Trust upon request.10 Goals
Congress designed the Trust to increase RRB funding. Investing railroad retirement funds in private markets was expected to yield higher average annual returns than investing solely in government securities. The higher returns were intended to pay for the enhanced benefits that were established in the actRRSIA and to potentially reduce future tax rates for railroad employers and employees.6
Impact on Railroad Retirement Tier II Tax Rates
The Trust is also designed to maintain four to six years' worth of benefits in case of lower-than-expected returns. To maintain this balance, the tier II tax is set to automatically adjust to maintain the fund balance at four to six years without congressional action. Since the inception of the Trust, the tier II tax rates have been lowered twice and increased twice. In 2005, the tierUnder the RRSIA, Tier II taxes on both employers and employees are automatically adjusted according to the average account benefits ratio. The average account benefits ratio (ABR) is the average of the 10 most recent annual ABRs. The ABR is the ratio of the combined fair market value of Railroad Retirement Account and Trust assets as of the close of the fiscal year to the total RRB benefits and administrative expenses paid from the Railroad Retirement Account and the Trust in that fiscal year. A higher average ABR will result in a lower Tier II tax rate and consequently lower future tax income, whereas a lower average ABR result in higher Tier II tax rates and income.
Depending on the average ABR, Tier II taxes for employers can range between 8.2% and 22.1% and the Tier II tax rate for employees is capped at 4.9%. Since the Trust's inception, Tier II tax rates have been lowered twice and increased twice (see Figure 1). In 2005, the Tier II tax rate on employers was automatically lowered from 13.1% to 12.6% and the tax rate on employees was lowered from 4.9% to 4.4%. Tier II tax rates were lowered again in 2007 to 12.1% on employers and 3.9% on employees. In 2013, the tax rates were raised to 12.6% and 4.4% on employers and employees, respectively, and in 20142015, the rates were raised to their current levels of 13.1% on employers and 4.9% on employees. The statute requires that the tier II tax rate on employers range between 8.2% and 22.1% and caps the tax rate on employees at 4.9%.
Investment Guidelines
Source: National Railroad Retirement Investment Trust, Annual Management Report for Fiscal Year 2006-2017. Notes: The Average ABR was measured at the end of each fiscal year (September 30 of each calendar year), and the Tier II tax rate was applied to railroad employers and employees in each calendar year. The assets in the Trust are invested in a diversified portfolio, both to minimize investment risk and to maximum amount of earnings subject to Tier II taxes is $98,700 in 2019.
Investment Guidelines
The Trust's assets are invested in a diversified portfolio, both to minimize investment risk and avoid disproportionate influence over a particular industry or firm. The investment guidelines adopted by the
Trusteestrustees include target asset allocations developed by the Trust's investment staff in consultation with an independent investment advisory firm. Outside investment managers hired by the Trust invest the assets according to these guidelines. The resulting investment performance is monitored by the Trusteestrustees and the Trust's Chief Investment Officer.
The Trust's target asset allocations change over time. For example, from FY2006 to FY2008, the Trust began to move away from fixed income investments ( to reflect current market expectation (see Figure 2).12 For example, over the past decade, the Trust has continued its effort in moving away from fixed income investment, with a decline from 35% of total investments in FY2006 to 27% in FY2008) and toward private equity (from 5% to 10%) and real estate (from 5% to 10%). The Trust's adoption of a more aggressive investment strategy coincided with market downturns. In 2009, the Trust adjusted its target allocation ranges, but not its individual target allocations, to provide for greater flexibility during periods of market volatility.7
The investment guidelines were changed again in September 2011 to reflect current market expectations. These changes included continued movement away from fixed income investments (from 27% of total investments in 2009 to 22% in 2011); the elimination of the opportunistic investments category, which had a target allocation range of between 5% and 20% in 2009; and the adoption of a cash category with a target allocation range of between 0% and 3%.8
The Trust's current investment guidelines were most recently changed in August 2014 and continued the trend away from fixed income investments (from 22% of total investments in 2011 to 20% in 2014). These current investment guidelines are shown in detail in Table 1.
Oversight
Source: National Railroad Retirement Investment Trust, Annual Management Report for Fiscal Year 2006-2017. Note: Real assets include investments in real estate and commodities. (effective beginning October 1, 2017) Asset Class Target Allocation Target Allocation Range Equity 58% Domestic 24% 19%-29% International 24% 19%-29% Private 10% 5%-15% Fixed Income 20% Domestic 14% 10%-18% International 4% 2%-6% Private Debt 2% 0%-4% Real Assets 14% Commodities 4% 2%-6% Real Estate 10% 5%-15% Other 8% Absolute Return 7% 3%-11% Cash 1% 0%-3%Because the Trust is an independent nongovernmental agency, it is not subject to the same oversight as federal agencies. The act outlines specific reporting requirements20% in FY2017. The target proportion of total investments in equity—domestic, international, and private equity—has been relatively stable between FY2006 and FY2017, ranging from 54% to 58%. The percentage of total investments in private equity increased from 5% in FY2006 to 10% in FY2008, and remained at this level thereafter. At the same time, fixed income was reduced and investments into real assets, cash, and absolute return assets were increased. The investment in real assets, including real estate and commodities, increased from 10% of total investments in FY2006 to 15% in FY2008 and then the proportion remained relatively stable. Cash and absolute return investments were adopted in FY2011, and they have accounted for around 10% of total investments since then. The current investment guidelines are shown in detail in Table 1.
Table 1. Current Trust Target Asset Allocations and Ranges
Source: National Railroad Retirement Investment Trust, Annual Management Report for Fiscal Year 2017, 2017, p. 15, https://www.rrb.gov/sites/default/files/2018-03/NRRIT_rpt_FY2017.pdf. See pages 15-17 for detailed definitions of assets.
Oversight
The Trust is an independent nongovernmental entity, and it is not subject to the same oversight as federal agencies. The RRSIA outlines specific reporting requirements, including an annual management report to Congress. The report must include a statement of financial position, a statement of cash flows, a statement on internal accounting and administrative control systems, and any other information necessary to inform Congress about the operations and financial condition of the Trust. The financial statements must be audited by independent public accountants. A copy of the annual report and audit must be submitted to the President, the RRB, and the Director of the Office of Management and Budget (OMB). The RRB has the authority to bring a civil action to enforce provisions of the act.
HoweverOver the past decade, the RRB Office of Inspector General (OIG) has expressed concernconcerns about the effectiveness of the oversight of the Trust. In 2008, the OIG argued that the annual financial audit required "is not adequate to support the RRB's enforcement responsibility because such audits are not intended to provide information about all areas of risk that could indicate the need for enforcement action."913 The OIG noted that there are fewer safeguards protecting the Trust than there are for the retirement investments of federal government and private-sector workers. For example, there is no requirement for performance audits of the Trust, which would assess program effectiveness, economy and efficiency, internal control, and compliance with the law.
In 2011, the OIG reiterated its concerns with the oversight of the Trust and stated,
The lack of NRRIT investment fund management accountability, transparency, and stringent financial oversight can be precursors to fraud, waste and abuse. Within the Federal agency spectrum there is no comparable example where Federal program assets are completely outside the jurisdiction of a Federal agency's appointed Inspector General. However, the NRRIT fund which supports the Railroad Retirement program remains outside the purview of those appointed to protect the interests of the program's beneficiaries and the tax-paying public.10
In a recent report in FY2018, the OIG asserted that lack of access to the Trust's auditor continued to be a concern,
This lack of cooperation and communication prevents OIG auditors from obtaining sufficient appropriate audit evidence regarding the RRB's financial statements….During fiscal year 2014, [OIG] recommended that an independent committee be established to identify a functional solution that would enable communication between OIG and NRRIT's auditors. Although RRB management did not concur with this recommendation, [OIG] will continue to cite this issue and the need for corrective action.15
Accounting in the Federal Budget As required in the RRSIA, Trust purchases and sales initially were treated as exchanges of assets of equal value, thus did not produce direct budgetary cost or income.16|
Asset Class |
Target Allocation (%) |
Target Allocation Range (%) |
|
Equity |
54 |
|
|
Domestic |
22 |
17-27 |
|
International |
22 |
17-27 |
|
Private |
10 |
5-15 |
|
Fixed Income |
20 |
|
|
Domestic |
13 |
9-17 |
|
International |
7 |
4-10 |
|
Real Assets |
15 |
|
|
Commodities |
5 |
2-8 |
|
Real Estate |
10 |
2-15 |
|
Other |
11 |
|
|
Absolute Return |
10 |
5-15 |
|
Cash |
1 |
0-3 |
Source: National Railroad Retirement Investment Trust, Annual Management Report for Fiscal Year 2016, January 31, 2017, p. 15, https://www.rrb.gov/sites/default/files/2017-06/reportFY2016[1].pdf. See pages 15-17 for detailed definitions of assets.
Accounting in the Federal Budget
As required in the 2001 act, purchases and sales by the Trust initially produce no direct budgetary cost or income.11 The law did not prescribe the treatment of unrealized capital gains and losses on the Trust's investments. The Congressional Budget Office (CBO) and OMB agreed that any capital loss or gain resulting from changes in market prices would be recognized in the year in which the price change occurs, and interest payments and dividends would be recorded as offsetting receipts.1217 As a result, income and capital gains reduce outlays and the deficit, and losses increase them. This reflects the change in real economic resources available to the government as the value of the Trust changes. As for future performance, both CBO and OMB use risk-adjusted rate of return assumptions—that is, they assume that the Trust's investments will earn the comparable Treasury bond rate.
Performance of the Trust
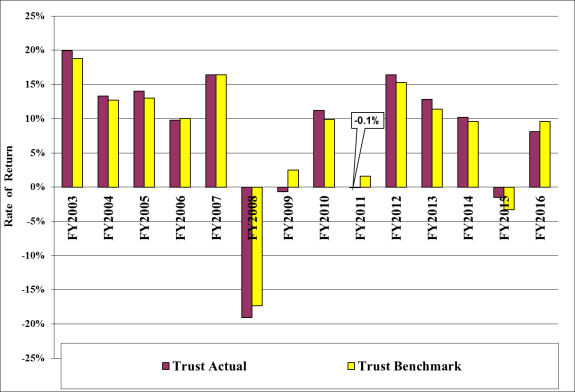
To date, the Trust's average annual performance almost meetsslightly exceeds expectations expressed by the actRRSIA's drafters, which had assumed that investments by the TrustTrust investments would earn an average annual rate of return of 8.0%.1318 From FY2003 to FY2015FY2017, the Trust's annual returnsrates of return, net of fees, have averaged 7.98.3%. For the first half of the Trust's existence, its returns largely exceeded expectations. Prior to FY2008, the average rate of return on Trust investments was 14.7% and the average rate of return exceeded the expected rate of 8.0% through FY2010. The Trust then had negative rates of return in FY2008 (-19.1%) and FY2009 (-0.7%) but rebounded with an 11.2% rate of return in FY2010 followed by a slightly negative rate of return of -0.1% in FY2011. The FY2012 rate of return of 16.4% brought the average annual rate of return of the Trust above the expected level of 8.0% for the first time in two years (since FY2010). The rate of return was 10.2% in FY2014, -1.5% in FY2015, and 8.1% in FY2016.14
Since railroad retirement funds were first invested through the Trust in September 2002, a total of $21.3 billion has been transferred to the Trust, with no transfers taking place after the end of FY2004.15 The Trust has earned a total of $23.1 billion from its inception to the end of FY2016.16 At the end of FY2016, the market value of the Trust's managed assets was $25.1 billion. Since 2002, $19.2 billion in earnings have been used to pay RRB benefits and administrative expenses.17
Total RRB Assets
At the inception of the Trust in February 2002, the value of the total assets of the RRB, including assets in the Trust and assets held in reserve in accounts at the Department of the Treasury, was $20.7 billion. As of the end of FY2016, the value of total RRB assets was $26.3 billion, with $25.1 billion held by the Trust and $1.5 billion held in reserve accounts at the Department of the Treasury. The net increase in total RRB assets since the inception of the Trust is $5.8 billion.18
Comparison to Benchmarks
The Trust's annual rates of return have generally compared favorably to its benchmarks. A benchmark is a standard used for comparison when measuring investment performance, and the NRRIT strategic policy benchmark is based on a series of benchmarks corresponding to each of the major asset classes in the Trust.1920 For example, the current benchmark for the Trust's investments in domestic equities is the Russell 3000 Index.20
As shown in Figure 1, in FY2003 through FY2005, the performance of the Trust 3, in the majority of years between FY2003 and FY2017, Trust performances exceeded its strategic policy benchmarks. In FY2006 and FY2007, the Trust's performanceperformances was roughly equal to its benchmarks, whereas in FY2008, FY2009, FY2011, and FY2016and FY2011, the Trust's investments had lower returns than its strategic policy benchmarks. In FY2015FY2017, the Trust's negative rate of return of -1.5%13.4% (net of fees) exceeded the benchmark of -3.3%. In FY2016, the Trust's 8.1% return rate was below the 9.6% benchmark.21
Administrative Expenses
The Trust's administrative expenses steadily increased through FY2011 as its investment portfolio diversified. However, as shown in Table 2, beginning in FY2012, the Trust's administrative expense ratio decreased, mirroring a national trend of decreasing expense ratios for mutual and money market funds. The Trust's administrative expenses remain low compared with industry standards. In FY2016FY2017, the Trust's expense ratio was 2831 basis points (expenses were 0.2831% of average net assets).2223 In comparison, in 2013, the 2017, average expense ratio for all investors was 74ratios were 59 basis points for equity funds, 6148 basis points for bond funds, 8070 basis points for hybrid funds, and 1725 basis points for money market funds.23
|
Fiscal Year |
Basis Points |
|
2003 |
2 |
|
2004 |
4 |
|
2005 |
9 |
|
2006 |
15 |
|
2007 |
24 |
|
2008 |
25 |
|
2009 |
26 |
|
2010 |
33 |
|
2011 |
36 |
|
2012 |
30 |
|
2013 |
29 |
|
2014 |
29 |
|
2015 |
27 |
|
2016 |
28 |
|
2017 |
31 |
Source: National Railroad Retirement Investment Trust, Annual Management Report for Fiscal Year 20172016 p. 18; and previous editions.
Notes: One basis point is equal to 1/100th of 1% of the average net assets of a fund. For example an expense ratio of 29 basis points indicates that expenses were 0.29% of average net assets.
Author Contact Information
Acknowledgments
CRS Analyst Scott Szymendera originally authored an earlier version of this report. CRS Specialist Julie Whittaker made additional contributions.
Footnotes
| 1. |
45 U.S.C. §231 et seq. For additional information on the RRB, see CRS Report RS22350, Railroad Retirement Board: Retirement, Survivor, Disability, Unemployment, and Sickness Benefits. |
||||||||
| 2. |
Railroad employers also finance a supplemental annuity program for certain railroad employees hired before October 1981. General revenues finance a vested dual benefit for certain railroad employees who were eligible for benefits before 1975. |
||||||||
| 3. |
The financial interchange is intended to place the Social Security Trust Funds in the same position in which they would have been had railroad employment been covered by the Social Security since Social Security's inception. This involves computing the amount of Social Security taxes that would have been collected on railroad employment, and computing the amount of additional benefits which Social Security would have paid to railroad retirement beneficiaries during the same fiscal year. When benefit reimbursements exceed payroll taxes, the difference, with an allowance for interest and administrative expenses, is transferred from the Social Security Trust Funds to the Social Security Equivalent Benefits Account. If taxes exceed benefit reimbursements (this has not happened since 1951), a transfer would be made in favor of the Social Security Trust Funds.
Supplemental annuities are payable to employees first hired before October 1981, aged 60 with at least 30 years of covered railroad service or aged 65 and older with at least 25 years of covered railroad service, and a current connection with the railroad industry. |
||||||||
|
| |||||||||
| 5. |
National Railroad Retirement Investment Trust, Annual Management Report for Fiscal Year 2016, January 31, 2017, https://www.rrb.gov/sites/default/files/2017-06/reportFY2016[1].pdf. Hereinafter cited as NRRIT, Annual Management Report for Fiscal Year 2016. |
||||||||
| 7.
|
|
Ibid., p. 11. 8.
|
|
Ibid. As of the end of FY2017, the value of total RRB assets was $27.8 billion, with $26.5 billion held by the Trust and $1.3 billion held in reserve accounts at the Department of the Treasury. 9.
|
|
For additional information on ERISA, see CRS Report 95-926, Regulating Private Pensions: A Brief Summary of ERISA. 10.
|
|
NRRIT, Annual Management Report for Fiscal Year 2017. |
U.S. Congress, House Committee on Transportation and Infrastructure, Railroad Retirement and Survivors Improvement Act of 2001, |
|
National Railroad Retirement Investment Trust, Annual Management Report for Fiscal Year 2009, January 29, 2010, p. 15, https://www.rrb.gov/sites/default/files/2017-05/1002[1].pdf. |
|||||||||
| 8. | National Railroad Retirement Investment Trust, Annual |
||||||||
|
Railroad Retirement Board, Office of Inspector General, Statement of Concern: National Railroad Retirement Investment Trust Lack of Provision for Performance Audits, March 31, 2008, https://www.rrb.gov/sites/default/files/2017-05/nrritStatement.pdf. |
|||||||||
|
Railroad Retirement Board, Office of the Inspector General, Office of the Inspector General's Proposal to Improve Business Efficiency at the Railroad Retirement Board, September 21, 2011, p. 5, https://rrb.gov/sites/default/files/2017-05/SR_092111.pdf. |
|||||||||
|
|
16.
RRB Office of Inspector General, Independent Auditor's Report in Performance and Accountability Report of FY2018, p. 9, at https://www.rrb.gov/sites/default/files/2018-11/Report%20on%20the%20Railroad%20Retirement%20Board%27s%20Financial%20Statements%20%20Fiscal%20Year%202018%20%287.2%20MB%29_0.pdf. |
For budgetary purposes, purchases or sales by the Trust are treated as a means of financing, which are not considered as outlays or receipts, so they are non-budgetary |
|||||||
|
For more information on accounting for government investment in private markets, see Congressional Budget Office, Evaluating and Accounting for Federal Investment in Corporate Stocks and Other Private Securities, January 2003, http://www.cbo.gov/sites/default/files/cbofiles/ftpdocs/40xx/doc4023/01-08-03-stocks.pdf. |
|||||||||
|
H.Rept. 107-82, |
|||||||||
|
| |||||||||
| 15. |
NRRIT, Annual Management Report for Fiscal Year 2016, p. 11. |
||||||||
| 16. |
Ibid. |
||||||||
| 17. |
Ibid. |
||||||||
| 18. |
Ibid., p. 6. |
||||||||
|
Benchmarks for each of the Trust's asset classes are provided in NRRIT, Annual Management Report for Fiscal Year 201 |
|||||||||
|
Additional information on the Russell 3000 Index is available on the website of Russell Investments at http://www.ftse.com/Analytics/FactSheets/temp/44c7ed53-1026-4910-9fda-55fb203f8744.pdf. |
|||||||||
|
NRRIT, Annual Management Report for FY201 |
|||||||||
|
NRRIT, Annual Management Report for Fiscal Year 201 |
|||||||||
|
Investment Company Institute, Trends in the Fees and Expenses of Mutual Funds, |