Frequently Asked Questions About Prescription Drug Pricing and Policy
Changes from May 2, 2017 to April 24, 2018
This page shows textual changes in the document between the two versions indicated in the dates above. Textual matter removed in the later version is indicated with red strikethrough and textual matter added in the later version is indicated with blue.
Frequently Asked Questions About Prescription Drug Pricing and Policy
Contents
- Introduction
- U.S. Prescription Drug Spending
- How Much Does the United States Spend on Prescription Drugs?
- How Does
20152016 Drug Spending Compare to Other Years? - What Is Behind the Recent
JumpVolatility in Retail Drug Spending? - Changes in Drug Mix
- Changes in Drug Prices
- Drug Utilization
- Are U.S. Consumer Out-of-Pocket Drug Costs Rising?
- Government Role in Prescription Drug Spending
- How Much
of theU.S. DrugBillSpending Is Paid by Government Programs? - How Does the Federal Government Pay For Prescription Drugs?
- Can the HHS Secretary Negotiate Medicare Part D Drug Prices?
- What Are U.S. States Doing to Address Drug Costs?
- Is U.S. Prescription Drug Spending Higher Than in Other Nations?
- Pharmaceutical Development and Marketing
- How Much Does Publicly Funded Research Contribute to Drug Development?
- How Much Does It Cost to Develop New Drugs?
- Does Congress Regulate Prescription Drug Ads?
- May U.S. Consumers Import Drugs from Abroad?
Figures
- Figure 1. National Retail Prescription Drug Spending
- Figure 2. Annual Percentage Change in Retail Prescription Drug Spending
- Figure 3. U.S. Retail Prescription Drug Price Inflation
- Figure 4. Consumer Out-of-Pocket Spending as a Share of Retail Drug Spending
- Figure 5. Per Capita Out-of-Pocket Spending for Retail Prescription Drugs
- Figure 6. Share of Spending for Retail Prescription Drugs by Source
- Figure 7. Per Capita Spending on Retail Drugs in U.S. and Other Countries
- Figure 8. Direct-to-Consumer Prescription Drug Advertising
- Figure 9. Number of Prescription Drug Ads Reviewed by FDA
Tables
Summary
Prescription drugs play an important role in the U.S. health care system. Innovative, breakthrough drugs are providing cures for diseases such as hepatitis C and helping individuals with chronic conditions lead fuller lives. Studies show that prescription drug therapy can produce health care savings by reducing the number of hospitalizations and other costly medical procedures.
Congress hasand presidential administrations have attempted to ensure that Americans have access to pharmaceuticals by enacting the Medicare Part D prescription drug benefit as part of the Medicare Modernization and Prescription Drug Act of 2003 (MMA; P.L. 108-173) and expanding drug coverage under the 2010 Patient Protection and Affordable Care Act (ACA; P.L. 111-148, as amended). Congress also has enacted laws to encourage manufacturing of lower-cost generic drugs, as well as cutting-edge biologics and biosimilars.
Americans are using more prescription drugs, and for longer periods of time, than in past decades. Still, access to prescription drugs remains a realan issue for a number of consumers, particularly those without insurance; those prescribed expensive specialty drugs for treating serious or rare diseases; or those enrolled in private insurance or public health plans with high cost-sharing requirements, such as drug deductibles and coinsurance.
Prescription drug affordability has gained renewed attention during the past few years as retail drug spending has risen at the fastest pace in more than a decade—growing 12.4% in 2014 and 8.9% in 2015 before slowing to an estimated 5a 1.3% increase in 2016. There are several reasons for the increaserecent volatility in drug spending. Manufacturers have been introducing new drugs at a record rate, while and raising prices for many existing brand-name products. The introduction of new hepatitis C drugs at the end of 2013 had a major impact on total drug spending in 2014 and 2015. At the same time, fewer brand-name drugs have lost patent protection than in previous years, paving the way forresulting in less impact from the use of lower-cost generic substitutes. The Centers for Medicare & Medicaid Services (CMS) forecasts that retail drug spending could average 6.3% annual growth from 2016 to 20252017 to 2026. Although that growth rate would be a reduction from recent more rapid levelsthe average level of the past several years, CMS expects retail drug spending to increase faster than many other areas of medical spending in this 10-year period.
This report will address frequently asked questions about government and private-sector policies that affect drug prices and availability. Among the prescription drug topics covered are federally funded research and development, regulation of direct-to-consumer advertising, legal restrictions on reimportation, and federal price negotiation. The report provides a broad overview of the issues as well as references to more in-depth CRS products. The appendixes provideappendix provides references to relevant congressional hearings and documents (see Appendix A) and a directory of CRS prescription drug experts (see Appendix B).
Introduction
Prescription drug affordability has gained renewed attention in the past few years, as retail drug spending has risen at the fastest pace in more than a decade. There are several reasons for the increase in drug spending. Manufacturers have been introducing new drugs at a record rate whileand raising prices for existing brand-name products. (See "What Is Behind the Recent JumpVolatility in Retail Drug Spending?," below.) At the same time, fewer brand-name drugs have lost patent protection than in previous years, paving the way for lower-costwhich has meant lower savings from new generic substitutes. The Centers for Medicare & Medicaid Services (CMS) forecasts that retail drug spending could average 6.3% annual growth from 2016 to 20252017 to 2026.1 Although that growth rate would be a reduction from recent, more rapid levels, CMS expects retail drug spending to increase faster than many other areas of medical spending in this 10-year period.
This report will address frequently asked questions about government and private-sector policies that affect drug prices and availability. Among the prescription drug topics covered are federally funded research and development, regulation of direct-to-consumer advertising, legal restrictions on reimportation, and federal price negotiation. The report provides a broad overview of the issues and references to more in-depth CRS products. The appendixes provideappendix provides references to relevant congressional hearings and documents (see Appendix A) and a directory of CRS prescription drug experts (see Appendix B(see Appendix).
|
Term |
Definition |
|
Biologic |
Pharmaceuticals derived from a living organism that can be many times the size of a conventional (small-molecule) drug and have a more complex structure. |
|
Biosimiliar |
A follow-on to a biologic that is "highly similar," notwithstanding minor differences in clinically inactive components. There are no clinically meaningful differences between a biosimilar and the reference biologic product in terms of safety, purity, and potency of the product. The Patient Protection and Affordable Care Act (ACA; P.L. 111-148, as amended) provided a period of exclusivity for manufacturers of certain biologic brand-name drugs and biosimilar products. |
|
Brand-Name Drug |
A drug marketed under a proprietary, trademark-protected name. |
|
Coinsurance |
The percentage share that an enrollee in a health insurance plan pays for a product or service covered by the plan. For example, an insurer may charge 10% coinsurance for a $100 prescription drug, meaning the consumer's out-of-pocket cost is $10. |
|
Co-payment |
A fixed dollar amount that an enrollee in a health insurance plan pays for a product or service covered by the plan. For example, an insurer may charge a $20 co-payment for a physician visit or a $5 co-payment for a prescription drug. |
|
Deductible |
The amount an enrollee is required to pay for health care services or products before his or her insurance plan begins to provide coverage. An enrollee in an insurance plan with a $500 deductible would be responsible for paying for the first $500 in health care services. In some insurance plans, the deductible does not apply to certain services, such as preventive care. Insurance plans vary regarding whether beneficiaries must meet a deductible for prescription drug coverage. |
|
Generic Drug |
A drug that is identical to a traditional (small molecule) brand-name drug in dosage, safety, strength, route of administration, quality, performance characteristics, and intended use. Generic drugs generally cost significantly less than their brand-name counterparts.b |
|
Formulary |
A list of prescription drugs covered by an insurance plan. In an effort to control costs, insurers are imposing partially closed formularies, which include a more limited number of drugs than open formularies. Insurers use tiered cost sharing for formulary drugs, meaning patients are charged lower co-payments or coinsurance for less expensive generic drugs and certain brand-name drugs that are designated by the plan as preferred drugs, based on the price the plan has negotiated with the manufacturer and the effectiveness of the product. At the same time, patients are charged higher co-payments or coinsurance for more expensive drugs or drugs that the plan deems to be less effective. |
|
Orphan Drug |
A traditional drug or biologic for the treatment of rare diseases and disorders that affect fewer than 200,000 people in the United States or that affect more than 200,000 people but where manufacturers are not expected to recover the costs of developing and marketing a treatment drug. Manufacturers of orphan drugs are eligible for federal tax, marketing, and other incentives.c |
|
Out-of-Pocket Costs |
The total amount an insured consumer pays each year for covered health care services that are not reimbursed by an insurance plan. Out-of-pocket costs can include deductibles, co-payments, and coinsurance. |
|
Out-of-Pocket Maximum |
The maximum amount an enrollee must pay before his or her health insurance plan covers 100% of health benefits. Certain costs, such as premiums, generally are not counted toward an out-of-pocket maximum, or cap. |
|
Pharmacy Benefit Managers (PBMs) |
Intermediaries between health plans and pharmacies, drug wholesalers, and manufacturers. PBMs perform functions such as designing drug formularies, negotiating prices, and administering prescription drug payment systems. |
|
Pharmacy Network |
A group of retail, mail-order, and specialty pharmacies that contract with PBMs and health insurers to dispense covered drugs at set prices. Network pharmacies also may provide other services under contract, such as monitoring patient adherence to drugs. |
|
Premium |
The amount an enrollee pays for health insurance coverage. Many plans charge monthly premiums, but premiums also can be assessed on a quarterly or annual basis. |
|
Specialty Drug |
There is no one set definition of specialty drugs, although insurers and other health care payers often characterize them as prescription products requiring extra handling or administration that are used to treat complex diseases, such as cancer. High cost can trigger a specialty drug designation. Biologics are often deemed to be specialty drugs.d |
|
Underinsured |
Refers to people who have insurance but still have financial difficulty paying for prescription drugs or medical treatments.e |
a.
See CRS Report R44620, Biologics and Biosimilars: Background and Key Issues, by [author name scrubbed]Judith A. Johnson.
b.
U.S. Food and Drug Administration (FDA), "Understanding Generic Drugs," at httphttps://www.fda.gov/Drugs/ResourcesForYou/Consumers/BuyingUsingMedicineSafely/UnderstandingGenericDrugs/drugs/resourcesforyou/consumers/buyingusingmedicinesafely/genericdrugs/default.htm. In 1984, Congress enacted the Hatch-Waxman Act (P.L. 98-417), which provided manufacturers of innovative prescription drugs with patent protection and a period of marketing exclusivity;, created a generic drug approval process to help companies bring products to market more quickly once the patent for an original brand-name drug expired;, and established procedures for resolving patent disputes arising from applications to market generic drugs. Generic drugs make up about 89% of filled prescriptions and 2726% of total drug spending, according to the Generic Pharmaceutical Association. See Generic Pharmaceutical Association, 2016 Generic Drug Savings & Access. See Association for Accessible Medications, 2017 Generic Drug Access & Savings in the United States Report, at http://www.gphaonline.org/media/generic-drug-savings-2016/index.html.
c.
https://www.accessiblemeds.org/resources/blog/2017-generic-drug-access-and-savings-us-report.
c. FDA, "Developing Products for Rare Diseases & Conditions," at http://www.fda.gov/ForIndustry/DevelopingProductsforRareDiseasesConditions/ucm2005525.htm.
d.
See CRS Report R44132, Specialty Drugs: Background and Policy Concerns, by [author name scrubbed].
e.
There are different definitions of underinsuranceunderinsurance. For example, the Commonwealth Fund defines individuals as underinsured if they had health insurance continuously for the preceding 12 months but still had total out-of-pocket costs or deductibles that were high relative to their incomes. See Commonwealth Fund, "31 Million People Were Underinsured in 2014; Many Skipped Needed Health Care and Depleted Savings to Pay Medical Bills," May 20, 2015Underinsured Rate Increased Sharply in 2016; More Than Two of Five Marketplace Enrollees and a Quarter of People with Employer Health Insurance Plans Are Now Underinsured," October 18, 2017, at http://www.commonwealthfund.org/publications/press-releases/2015/may/underinsurance-brief2017/oct/underinsured-press-release.
U.S. Prescription Drug Spending
How Much Does the United States Spend on Prescription Drugs?
The most commonly cited data on prescription drug spending come from the National Health Expenditures (NHE) accounts compiled by CMS.2 The NHE accounts track annual spending by all payers for prescription drugs purchased in retail settings, such as pharmacies, mail-order outlets, grocery stores, warehouse clubs, and similar businesses. The NHE data do not include drugs dispensed in institutions including hospitals, long-term care facilities, and clinics,3 nor do they include over-the-counter products such as aspirin purchased without a prescription.4
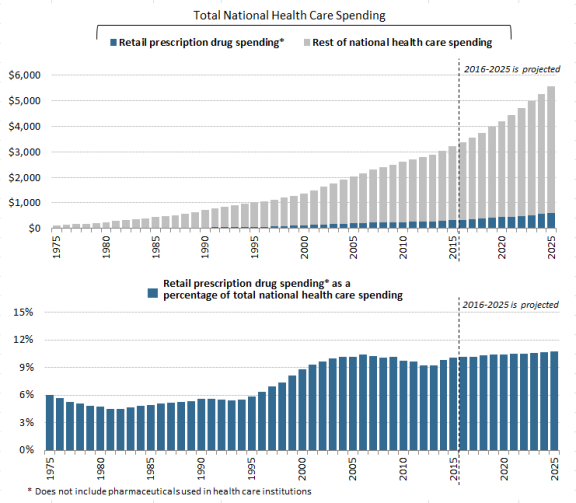
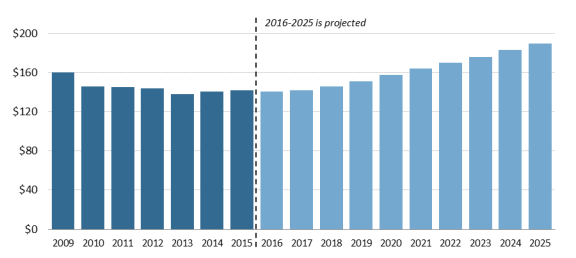
According to the most recent NHE data, the United States spent an estimated $341$328.6 billion on retail prescription drugs in 2016, which was 10% of total and a forecast $338.1 billion in 2017, or 10% of predicted 2017 national health care spending of $3.45 trillion.5 Prescription drug spending is forecast to rise to about 11% of national health care spending by 20252027 (see Figure 1). Retail drug spending has ranged from about 5% to 10% of total health care expenditures since 1960, when the NHE accounts began compiling prescription spending data.6 (See "How Does 20152016 Drug Spending Compare to Other Years?," below.)
") Because the NHE data provide information only about retail drug sales only, a number of analysts say the data do not offer a complete picture of U.S. drug spending. The Department of Health and Human Services (HHS) in April 2016 issued a study that attempted to estimate total U.S. prescription drug spending—retail plus institutional use in hospitals and other health facilities.7
In addition to the NHE data, private consultants and academics publish their own forecasts of U.S. prescription drug spending.8 National estimates vary for a number of reasons, including assumptions about the dollar value of rebates that pharmaceutical manufacturers provide to health payers, as well as the value of coupons offered to consumers, and whether the forecasts include both retail and institutional use. However, the different studies show a trend toward higher spending in recent years.
How Does 20152016 Drug Spending Compare to Other Years?
The pace of U.S. retail prescription drug spending has varied through the decades. For much of the 1980s through the early 2000s, retail drug spending grew at a double-digit annual pace. From 2003 through 2013, drug spending slowed to a historically low average annual growth rate of 5%.9 (See Figure 2.) Drug spending growth moderated for a number of reasons, including a deep economic recession from 2007 to 2010, a reduction in the number of expensive new drugs coming to the market compared to earlier years, and a continued expansion in the use of lower-cost generic drugs.10 (See Table 1.)
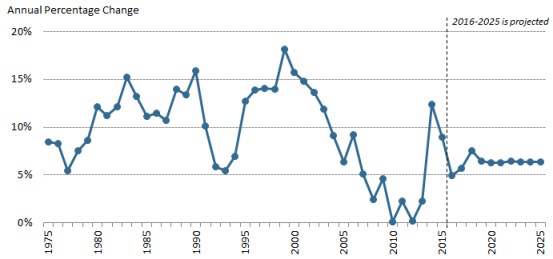
However, in 2014, spending for retail prescription drugs accelerated. U.S. retail drug spending jumped by 12.4% in 2014—the largest annual increase in more than a decade. Drug spending rose by 8.9% in 2015 before slowing to a forecast 51.3% increase in 2016 and a forecasted 2.9% increase in 2017.11 (See "What Is Behind the Recent JumpVolatility in Retail Drug Spending?," below.)12 in Retail Drug Spending?," below.) According to the NHE data, drug spending rose faster than spending for other health care products and services in 2014 and 2015.12 The 114th Congress held a series of hearings on prescription drugs, in response to the accelerating spending and sharp increases in prices for specific drugs. (See list of hearings in Appendix A.)
Retail drug spending is projected to grow by about 6.3% a year on average through 2025, according to the NHE2027, according to the NHE, due partly to faster projected drug price growth, particularly for costlier specialty drugs. Although that growth rate would be a reduction from the recent pace, drugs would be expected to grow faster than many other areas of health care spending. For example, the NHE accounts project that total health spending will grow 5.6% a year on average through 2025, whereas hospital spending is pegged at 5.5% average annual growth over the same time period.13
What Is Behind the Recent Jumpphysician services and hospital care will grow 5% and 5.5% on average, respectively, over the same time period.13
During the 114th and 115th Congresses, a series of hearings have been held on prescription drugs in response to the acceleration in spending and sharp increases in prices for specific drugs. (See partial list of hearings in Appendix. The list focuses on hearings most relevant to drug pricing issues.)
What Is Behind the Recent Volatility in Retail Drug Spending?
Retail prescription drug spending can be affected by (1) changes in the mix of available drugs, (2) changes in the price of drugs, and (3) changes in the volume of drugs used. The rapid increase in retail drug spending in 2014 and 2015 was driven largely by the introduction of new high-cost drugs, price increases for existing drugs, and the diminishing impact of generic substitution, as fewer brand-name drugs lost patent protection than in previous years. Implementation of the Patient Protection and Affordable Care Act (ACA; P.L. 111-148, as amended) also helped to propel drug demand.14
The rate of prescription drug spending slowed in 2016, even though overall utilization rose during that year, due to factors that included fewer new drug approvals than in previous years, less use of high-cost hepatitis C drugs, and a deceleration in spending for drugs to treat diabetes.15Changes in Drug Mix
Drug mix refers to the cost of new drugs versus the cost of older drugs being used. New, innovator brand-name drugs often are more expensive than older drugs and do not have lower-cost equivalents. Likewise, newly introduced generic drugs, which are less expensive than brand-name products, can reduce the cost of certain therapies.
During the past several years, the U.S. Food and Drug Administration (FDA) has approved a large number of novel new drugs,1516 including expensive specialty drugs for treating hepatitis C, cancer, diabetes, and heart disease.1617 In 20152016 alone, more than half of the growth in U.S. prescription drug spending was from drugs that had been available for less than two years.17 Hepatitis C drugs played a large role, making up18 The introduction of new hepatitis C drugs, which can cure the disease, played a large role in increased drug spending in 2014 and 2015, accounting for nearly 40% of the net growth in total U.S. drug spending in 2014 and two-thirds of increased brand-name prescription drug spending by employer-sponsored health plans that year.18
At the same time 19 The impact of the hepatitis C drugs, while still large, is diminishing as fewer new patients are treated with the products and net prices drop for the drugs.20
At the same time that these expensive new drugs were coming to the market, new generic substitution was playing a smaller role in reducing total drug spending. Since 2009, patents for a number of best-selling brand-name drugs have expired, paving the way for manufacturers to produce new generic versions.1921 In 2012, at the peak of the so-called patent cliff, spending for brand-name drugs subject to generic competition fell by $32.6 billion. However, annual savings from brands with new generic substitutes declined to a smaller $14 billion in 2015.20that have lost patent protection has been lower since then.22
Changes in drug mix will continue to play an important role in spending going forward. Many drugs now in the development pipeline are biologics,2123 which often have a high introductory price and initially may not have many lower-cost alternatives. Although FDA has begun to approve biosimilar substitutes for biologics that have lost patent and marketing protection, so far these biosimilars are not significantly lower -priced than the original biologics.2224
Changes in Drug Prices
Prescription drug prices have risen faster than prices for overall U.S. goods and services during the past three yearssince 2014 according to the Department of Labor's Consumer Price Index (CPI), which measures retail inflation.23 25 The gap between prescription drug and overall inflation narrowed significantly in 2017. (See Figure 3.)
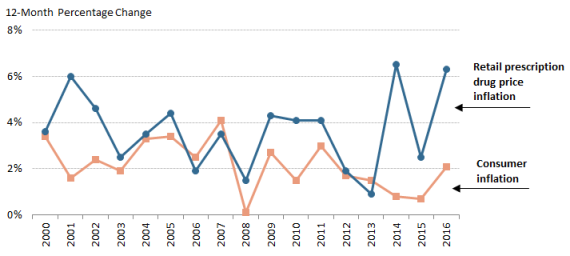
U.S. retail drug inflation, as measured by the CPI-U,2426 was 6.54% in 2014, compared to general consumer inflation of 0.8%. Drug prices rose 2.56.2% in 20152016, compared to a 0.72.1% consumer inflation rate, and 6.32.8% in 20162017, compared to consumer inflation of 2.1%2.1% consumer inflation. Drug inflation has been driven mainly by price increases for existing brand-name drugs and adoption of expensive new innovator brand-name drugs.2527 (See "Changes in Drug Mix," above.)
Manufacturers also have raised prices for a number of existing generic drugs in the past several years. However, a 2016 HHS study found that generic price increases were not a major contributor to inflation.2628 Likewise, pharmacy benefits manager (PBM) Express Scripts, in an analysis of prescription drug claims data, has found that the average price offor commonly used brand-name drugs rose 1610.7% from 2014 to 20152015 to 2016, and average prices for generic drugs declined by 208.7% over the same time period.2729 Within the brand-name drug category, biologics and specialty drugs drovehave driven much of the price inflation.2830
|
Drug Price Transparency It can be difficult to determine the final price of a prescription drug due to a lack of transparency in the marketplace. Drug companies price discriminate, meaning they sell the same drug to different buyers (wholesalers, health plans, pharmacies, hospitals, government purchasers, and other providers) at different prices. The final price of a drug may include rebates and discounts to health plans and pharmacy benefit managers that are not publicly disclosed. Market participants, such as wholesalers, add their own markups and fees. Complicating the picture even more, pharmaceutical manufacturers offer direct consumer discounts, such as prescription drug coupons that can be redeemed when filling a prescription at a pharmacy. Drug companies also offer charitable aid through patient assistance programs for individuals who cannot afford their prescriptions. The most commonly published drug prices do not include these discounts and rebates, which appear to be growing in size and importance. According to Source: CRS Report R44264, Prescription Drug Discount Coupons: Implications for Public and Commercial Health Care Plans, by [author name scrubbed], and IMS Institute for Healthcare Informatics, Medicines Use and Spending in the U.S.: A Review of 2015 and Outlook to 2020, April 2016. |
Drug Utilization
An analysis of the most recent National Health Expenditures prescription drug forecast for 2017-2026 included a special section on rebates. According to the analysis, increased rebates "contributed to lower net prices for many prescription drugs in recent years and are expected to have dampened prescription drug spending growth in 2017. In 2018 and beyond, the share of total prescription drug spending affected by rebates is not expected to increase as rapidly as in the recent past. As a result, the outlook for such spending reflects somewhat stronger growth in drug prices." Source: CRS Report R44264, Prescription Drug Discount Coupons and Patient Assistance Programs (PAPs); IQVIA Institute, "Medicines Use and Spending in the U.S. A Review of 2016 and Outlook to 2021," Chart 1, May 2017; and "National Health Expenditure Projections, 2017–26: Despite Uncertainty, Fundamentals Primarily Drive Spending Growth," Health Affairs, vol. 37, no. 3 (March 2018).During the past few years, the ACA has expanded prescription drug coverage, helpingPrescription drug spending from 2006 to 2016 rose 67% on an invoice basis but 42% on a net basis. More than two-thirds of the spending growth occurred from 2013 to 2016.
2931 Studies of health insurance plans sold through ACA exchanges show a nearly 15% annual increase in drug spending for those insured consumers from 2014 to 2015, driven mainly by higher utilization.30
32 Medicaid coverage also expanded under the ACA, including drug coverage for non-elderly, low-income individuals.3133 In 2014, the ACA changes to Medicaid contributed to an 8% jump in Medicaid prescription drug claims and a 20% rise in gross Medicaid prescription drug spending.32
The ACA impact was somewhat offset by other factors, such as less demand by individuals enrolled in other commercial insurance plans.3334
The aging of the baby boomers also has contributed to increased demand. According to IQVIA, patients aged 50 and older accounted for 70% of dispensed prescriptions in 2016 and 77% of the increase in drug dispensing since 2011.35
Are U.S. Consumer Out-of-Pocket Drug Costs Rising?
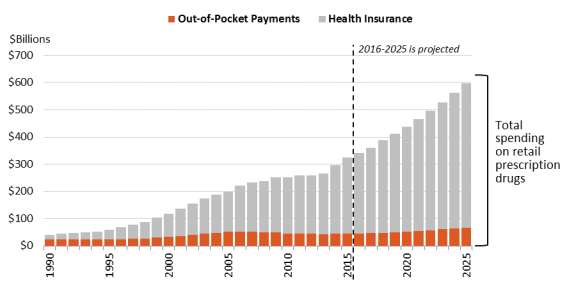
As recently as 1990, consumer out-of-pocket spending—cash payments, health plan deductibles, coinsurance, and co-payments—for filled prescriptions made up 57% of U.S. retail drug spending, whereas commercial payers and taxpayer-financed health programs accounted for about 43%, according to NHE data. However, in the ensuing years, commercial payers and taxpayer-financed health programs have covered a growing share of the nation's retail prescription drug bill. By 2015,The latest NHE data forecast that out-of-pocket spending had declined to 1413.2% of drug spending in 2017, versus about 8686.2% for these other payers.34 36 In 2026, out-of-pocket spending is forecast to account for 12.1% of retail drug costs. (See Figure 4.)
Although consumer cost sharing represents a smaller share of overall prescription drug spending than in the past, consumers maycan still face high out-of-pocket expenses depending on the specific drugs they are prescribed (generic versus brand name), whether they have insurance, the policies of their health plans, and their eligibility for manufacturer drug discount coupons or charitable assistance programs.
During the past several years, health plans have been imposing higher cost sharing for prescription drugs in an effort to control spending and costs. From 2012 to 2015, the share of commercial health plans with a prescription drug deductible rose to 46% from 23%, according to an IMSIQVIA analysis.3537 Drug deductibles are especially prevalent in health plans sold on ACA state exchanges.3638 There has been a continued increase in the use of formulary tiered pricing and in the practice of imposing coinsurance, as opposed to flat co-payments, for more expensive drugs. In tiered pricing, a consumer may pay a $10 co-payment for a generic drug on a formulary low-cost price tier; the same consumer may be charged 30% coinsurance for an expensive specialty drug on a high-priced tier. The differential between health plan price tiers has been widening, imposing a greater financial burden on consumers who use higher-priced drugs.3739 For example, in 20162017, enrollees in employer-sponsored health plans with three or more drug tiers had an average co-payment of $102110 for a high-priced tier-four drug, compared to an $11 co-payment for a tier-one generic drug.
The cost-sharing increases appear to have been partially moderated by other developments. The ACA capped total annual out-of-pocket spending in many commercial health plans, eliminated cost sharing for contraceptives, and reduced cost sharing for Part D enrollees.3840 Pharmaceutical manufacturers have expanded patient assistance via discount coupons, (which cover a portion of required health plan cost sharing,) and patient assistance programs, (which provide aid based on health condition and annual income).41.39 Generic drug-use rates, for which cost sharing is low, have continued to increase.
According to some recent studies of insured consumers, average out-of-pocket spending for retail drugs has declined in the past several years. However, the number of consumers with high out-of-pocket costs—such as those with serious conditions or those prescribed specialty drugs—has increased.
|
Caps on Annual Out-of-Pocket Spending Many private health insurance plans place an annual cap, or maximum, on enrollee out-of-pocket spending for covered health care services, after which the payer covers the cost Source: Out-of-print CRS Report R42069, Private Health Insurance Market Reforms in the Patient Protection and Affordable Care Act (ACA), Notes: Only certain grandfathered private plans do not have to comply with the out-of-pocket cap. |
A 2016 study of enrollees in large employer-sponsored health plans found that average out-of-pocket spending declined to $144 in 2014 from a recent high of $167 in 2009.4042 But nearly 3% of enrollees had exceptionally high out-of-pocket costs (of more than $1,000) in 2014, accounting for a about one-third of drug spending and a also one-third of all out-of-pocket spending. The share of people with high drug costs has tripled since 2004.
A separate study of drug claims in commercial health plans found that median out-of-pocket spending for outpatient specialty drugs (those costing $600 or more per month) rose from $24 per month in 2003 to $35 per month in 2014, a 46% increase. During the same period, median out-of-pocket spending for non-specialtynonspecialty drugs declined 57%, from $14 to $6 per month.41
Looking forward, the NHE expects out-of-pocket spending to rise about 4% a year from 2016 through 2025.42 Per person spending is expected to grow from about $142 in 2015 to $190 in 2025.43
According to the NHE, per person out-of-pocket spending for retail prescription drugs declined from $146 in 2010 to $140 in 2016. It is forecast to dip to $137 in 2017 and then gradually increase to $207 by 2026.44 (See Figure 5.) Because out-of-pocket spending is expected to rise more slowly than overall U.S. retail drug spending in the next decade, out-of-pocket spending is forecast to continue to decline as a share of retail drug expenditures, reaching about 11% by 2025 from 14% in 2015.
Government Role in Prescription Drug Spending
How Much of the U.S. Drug BillSpending Is Paid by Government Programs?
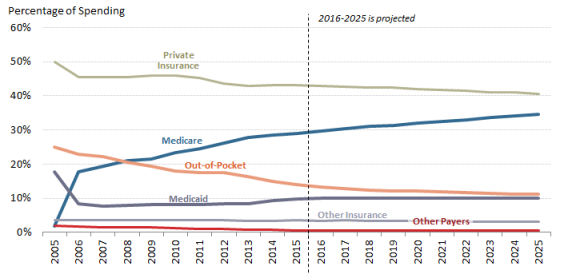
Congress hasand presidential administrations have expanded subsidized drug coverage to tens of millions of consumers during the past decade by implementing Medicare Part D and expanding eligibility for Medicaid as part of the ACA.4345 As a result, the government share of U.S. retail prescription drug spending (federal, state and local) rose from about 25% in 2005—the year before Part D took full effect—to about 43% in 2015. (See Figure 6.)
an estimated 44.1% in 2017. The government share of drug spending is forecast to rise to 4847% by 2025.44
How Does the Federal Government Pay For Prescription Drugs?
Unlike many other industrialized nations,4547 the United States does not operate a single, centralized system for administering government-sponsored drug benefits, procuring pharmaceuticals, or setting drug prices. Instead, the various departments and agencies that oversee federal health programs operate a range of congressionally mandated drug discount and contracting systems, including market-based negotiations in Medicare Part D, direct procurement in the Veterans Health Administration, and a combination of mandatory rebates and negotiations in Medicaid. Separately, FDA regulates the safety and effectiveness of prescription drugs.4648 Congress has not given FDA authority to set drug prices or to consider prices as part of its drug approval process.
Federal agencies can secure substantial discounts for prescription drugs under this decentralized system. However, price discounts vary widely among federal programs. For example, according to a 2015 HHS Office of Inspector General report, Medicaid rebates were equal to 47% of Medicaid spending in 2012, while rebates made up a smaller 15% of Part D spending that same year.4749 Medicaid rebates for some drugs were more than 10 times larger than Part D rebates for the same products. Members of Congress have introduced legislation to give the HHS Secretary more power to negotiate Medicare Part D drug prices. (See "Can the HHS Secretary Negotiate Medicare Part D Drug Prices?," below.)
Following is a table that outlines prescription purchasing systems for four federal health care programs: Medicare Part D, Medicare Part B, Medicaid, and the Veterans Health Administration health system.4850 (See Table 2.) These four programs were chosen because they are among the largest federal health programs. The table is not intended as a comprehensivea complete list of federal programs that pay for prescription drugsprescription drug coverage.
Table 2. Selected Federal Programs Providing Prescription Drug Coverage
(overview of drug purchasing and payment methods by government programs)
|
Medicare |
Medicare Part D is a voluntary drug benefit offered through private health care plans that contract with HHS. The Part D program relies on market competition to limit spending. Plan sponsors, which compete for enrollees, negotiate rebates, discounts, and other price concessions with manufacturers. The ACA amended Part D to require additional price discounts from manufacturers. Since 2011, manufacturers that choose to participate in Part D have been required to provide a 50% discount on brand-name drugs purchased by enrollees who incur a certain level of expenses and are in the coverage gap, with higher out-of-pocket spending. |
|
Medicare |
Medicare Part B covers physician services and durable medical equipment, as well injectable or intravenous drugs administered as part of a service in a doctor's office or hospital outpatient department.b Part B also covers specific drugs, such as immunosuppressant products, vaccines, transplant drugs, and oral end stage renal disease medications. Under Part B, physicians who purchase prescription drugs for administration are reimbursed by Medicare for the average sales price of a drug, plus 6%. |
|
Medicaid |
Medicaid is a federal-state entitlement program that pays for health care services on behalf of certain low-income individuals.c Prescription drugs are an optional benefit but are covered by all states. Manufacturers that choose to sell their drugs to state Medicaid agencies must enter into a national rebate agreement with the HHS Secretary and provide information on their lowest or "best" drug prices. Manufacturer rebates vary depending on the specific product. For example, manufacturers must provide at least a 23.1% rebate on new innovator drugs and a 13.1% rebate on generic drugs. States may limit formularies and require use of generic drugs when possible. Drug manufacturers that participate in Medicaid must sell their products at a discounted price to health providers covered by the 340B program.d |
|
Veterans Health Administration |
The Department of Veterans Affairs (VA) through the Veterans Health Administration (VHA) operates the nation's largest integrated direct health care delivery system, including outpatient clinics and hospitals. |
Source: CRS Analysis of federal agency information, including contracts, and federal statutes.
Notes: ACA = Patient Protection and Affordable Care Act (P.L. 111-148, as amended); CMS = Centers for Medicare & Medicaid Services; HHS = Department of Health and Human Services.
a.
CMS, "Coverage Gap Discount Program," at http://www.cms.gov/Medicare/Medicare-Advantage/Plan-Payment/CGDP.html.
b.
See CRS Report R40425, Medicare Primer, coordinated by [author name scrubbed].
c.
See CRS Report R43778, Medicaid Prescription Drug Pricing and Policy, by [author name scrubbed].
d.
Ibid. Under the 340B program, manufacturers agree to provide outpatient drugs to covered entities, including qualifying hospitals, at significantly reduced prices.
e.
See CRS Report R42747, Health Care for Veterans: Answers to Frequently Asked Questions, by [author name scrubbed].
Can the HHS Secretary Negotiate Medicare Part D Drug Prices?
Congress designed Medicare Part D as a market-oriented program in which commercial health payers compete for enrollees based on the price and scope of their drug coverage.4951 Part D plan sponsors, which include health plans, unions, employers, and PBMs, negotiate drug rebates and discounts with manufacturers and contract with retail pharmacies to dispense drugs to Part D enrollees at set reimbursement rates.5052
To bolster market competition, the Medicare Prescription Drug, Improvement, and Modernization Act of 2003 (MMA; P.L. 108-173), which created Medicare Part D, contains a "noninterference provision."5153 This provision prohibits the HHS Secretary (Secretary) from intervening in negotiations between Part D plan sponsors, drug manufacturers, and pharmacies or from requiring a specific Part D formulary.5254
In the years since Part D was enacted, Congress has debated whether the market-based model has been effective in controlling drug prices and enrollee costs. Proponents of the current approach point out that program spending to date has been well below initial budget projections.5355 Total Part D drug rebates have risen from 89.6% of annual Part D drug spending in 20062007, the firstsecond year the program was in effect, to a forecast 20.6% in 2016.54and is forecast to be 24% in 2018.56 Further, a 2014 Congressional Budget Office (CBO) study found that Part D premiums were lower in areas of the country where there was the most robust competition among Part D plans.5557
However, CBO also has found that Part D plans have higher average drug prices than the Medicaid program, which imposes mandatory federal drug rebates.5658 Separate studies by the HHS Office of Inspector General and the Government Accountability Office likewise have found that Medicaid secures lower drug prices than Part D.5759
Some lawmakers have proposed modifying the noninterference provision to give the Secretary authority to negotiate drug prices, saying that leveraging the combined purchasing power of tens of millions of Medicare beneficiaries would allow HHS to secure larger discounts than can be obtained by individual Part D plan sponsors.5860 In 2007, the House approved H.R. 4, the Medicare Prescription Drug Price Negotiation Act of 2007, which would have allowed the Secretary to negotiate Part D drug prices but not to craft a formulary.5961 The measure was not approved by the Senate. A CBO analysis said that the bill would produce negligible savings unless the Secretary were given authority to create a central formulary, set prices administratively, or take other regulatory actions against firms that failed to offer price reductions.6062 A number of patient and consumer groups have opposed proposals to give the Secretary more control of the Part D formulary, contending it could lead to reductions in drug coverage.6163
During recent sessions of Congress, lawmakers introduced a variety of bills to modify the noninterference provision.6264 The Obama Administration also recommended giving the Secretary authority to negotiate prices for Medicare Part D high-cost and biologic drugs, although the proposals were not scored as producing cost savings.63
In a similar vein, lawmakers have introduced legislation to apply some of Medicaid's mandatory Medicaid rebates to Part D drugs prescribed for low-income enrollees.6467 CBO has said that such a policy could lower the cost of Part D brand-name drugs in the first decade after the policy was adopted. Savings could erode over time as drug manufacturers raised prices to counteract the rebates. CBO also said the change could reduce the incentive for manufacturers to invest in research and development.65
What Are U.S. States Doing to Address Drug Costs?
State governments play an active role in regulating prescription drug use and pricing. States are the main regulators of health insurance, administer and fund Medicaid jointly with the federal government, and offer health insurance plans to state employees. Some states have their own patient assistance programs that provide free prescription drugs to low-income residents.
States are using various approaches to address prescription drug spending and access, with a growing focus on limiting spending for high-priced drugs and requiring transparency in drug prices.6669 A 2015 California statute sets a $250 cap on cost sharing for a 30-day supply of drugs for enrollees in individual and small-group plans.6770 Similar laws have been passed in Delaware and other states.6871 In 2016, Vermont approved a first-in-the nation law requiring manufacturer disclosure for drugs that underwent large percentage price increases.6972 Each year, this law requires state regulators to compile a list of 15 drugs used by Vermont residents that experience the largest annual price increases. Manufacturers will be required to justify the price increase to the state attorney general. The idea behind the Vermont act, and similar bills, is to force drug companies to justify prices, based on costs.70
Maine in 2013 enacted a law allowing its citizens to import prescription drugs from Canada, New Zealand, Australia, and the United Kingdom. A federal district court ruled the law unconstitutional in 2015.7174 (See "May U.S. Consumers Import Drugs from Abroad?," below.)
Is U.S. Prescription Drug Spending Higher Than in Other Nations?
The United States spends more for prescription drugs than other industrialized nations, as measured by both total spending and spending per person. The U.S. share of global drug spending was estimated at about 34% in 20132016 and is projected to rise to 41% in 2020about 45% in 2021, according to IMS Health.72one forecast.75 By comparison, the top five European nations combined are projected to account for 12%-13% of global drug spending by 2020.73
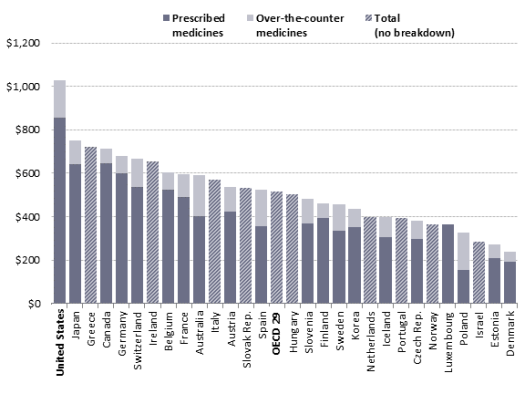
Similarly, a study by the OrganizationOrganisation for Economic CooperationCo-operation and Development (OECD) found that U.S. per capita spending for retail prescription drugs, at $1,026 in 2013, was higher than spending in any of the other 28 industrialized nations examined.74 The U.S. spent more per capita on drugs than any other nation and twice the OECD per capita average.75 was $1,162 in 2015, compared to the OECD average of $553. U.S. spending was higher than spending in any of the other 30 industrialized nations examined.77 (See Figure 7.)
Other studies have found large differences in the price for specific drugs in the United States and other countries. In one recent study, researchers at the University of Liverpool examined a class of cancer drugs known as tyrosine kinase inhibitors and found that the U.S. price in most cases was at least double that charged in the European Union (EU).7678
Academic studies have posited a number of reasons for the higher U.S. spending and prices. These reasons include the faster adoption of breakthrough, or newly introduced, drugs in the United States and patent and other protections that give U.S. manufacturers market exclusivity during the early years a product is on the market.7779
Another difference is that OECD countries may operate government-run health care systems that are the main purchasers of drugs and that set price limits for the products they buy. ManyMost EU nations use external reference pricing, defined by the European Commission as using the price of a medicine in one or several countries to derive a benchmark, or reference price, for setting or negotiating the price of that medicine in another country. Reference pricing is used in 28 EU countries, as well as Iceland, Norway, Switzerland, and Turkey.7880
National health programs may use value-based pricing, which bases payment for a drug on evidence of its effectiveness or therapeutic value.7981 In Canada, the Common Drug Review assesses the clinical and economic effectiveness of new drugs and of existing drugs approved for new uses.8082 The assessments are passed on to federal, territorial, and provincial drug plans in setting reimbursement.
U.S. government and commercial payers are experimenting with alternative forms of pricing. For example, Harvard Pilgrim Health Care, a private health insurer, in June 2016 announced a deal with drugmakers Novartis and Eli Lilly under which the insurer will receive discounts if certain drugs do not meet specified goals for improving health or reducing hospitalizations.8183 CMS has encouraged state Medicaid programs to move toward value-based purchasing and has offered guidance on addressing some associated technical issues.82
The Institute for Clinical and Economic Review (ICER), a private research organization, is producing public reports on the comparative effectiveness, cost-effectiveness, and potential budget impact of drugs that are newly approved by FDA.8385 The effort raised concerns in the pharmaceutical industry, with manufacturing trade group PhRMA saying that some of the research is designed to limit reimbursement and, as a result, would limit patients' access to treatments.8486 ICER has reached out to different segments of the health care industry as it has refined its methodology for valuing prescription drugs.8587
Pharmaceutical Development and Marketing
How Much Does Publicly Funded Research Contribute to Drug Development?
In general, the federal government tends to focus on basic or preclinical research—such as the work conducted or supported by the National Institutes of Health—and the pharmaceutical industry tends to concentrate more of its research funding on clinical trials rather than on discovery activity.8688 When trying to assign credit for specific therapeutic advancements, drawing a line between basic and applied research can be challenging. For example, without a major underlying basic advance, such as recombinant DNA,8789 the development of whole new classes of drugs would not exist.
Various studies have attempted to quantify the contribution of publicly funded research to the discovery of new drugs, as compared to the contribution from private industry. A study published in 2003 found that of the 284 new drugs approved by FDA from 1990 through 1999, only 6.7% originated from sources other than private industry.8890 A 1993 study found that 7.6% of new drugs approved from 1981 through 1990 originated from nonindustry sources.8991 However, rather than focusing on all drug approvals—including many "me-too" drugs (see Table 1, above)—another way to answer this question is to look at the origin of truly innovative new drugs, what FDA calls new molecular entities (NMEs). NMEs are drugs that have not been approved by FDA previously and frequently provide important new therapies for patients.9092 A 2010 study found that of the NMEs and new biologics that received FDA approval between 1998 and 2007, 24.1% originated from work that was publicly funded.9193
A study by Ashley J. Stevens et al. published in 2011 claims to take a more comprehensive look at the contribution of publicly funded research to the discovery of new drugs than these earlier investigations.9294 The Stevens study found that of the 1,541 drugs approved by FDA from 1990 through 2007, 143, or 9.3%, resulted from work conducted in publicly funded labs. Of the total 1,5411,541 total drug applications, FDA granted priority review to 348 applications, and 66 of these (19%) resulted from publicly funded research. The authors stated that "viewed from another perspective, 46.2% of the new-drug applications from PSRIs [public-sector research institutions] received priority reviews, as compared with 20.0% of applications that were based purely on private-sector research, an increase by a factor of 2.3."9395 An FDA designation of priority review is for "the evaluation of applications for drugs that, if approved, would be significant improvements in the safety or effectiveness of the treatment, diagnosis, or prevention of serious conditions when compared to standard applications."9496 According to the authors, their data "suggest that PSRIs tend to discover drugs that are expected to have a disproportionately important clinical effect."95
The 2011 Stevens study considered a PSRI "to have participated in the applied phase of research that led to discovery of a drug if it, solely or jointly, created intellectual property specific to the drug that was subsequently transferred to a company through a commercial license." The methodology used by the Stevens study "excluded the role of PSRIs in the development of platform technologies that have contributed to the development of whole new classes of drugs." These platform technologies enabled the development of many of the products approved by FDA during the period evaluated in the study. The platform technologies were excluded "because the PSRI scientists who developed the platforms generally did not use them to develop specific drug candidates."9698 For example, the following platform technologies were all developed with public funds and were excluded from the study:
- recombinant DNA technology (Cohen-Boyer patents);
- bacterial production methods for recombinant DNA (Riggs-Itakura patents);
- production and chimerization methods for antibodies (Cabilly patents);
- methods to produce glycosylated recombinant proteins in mammalian cells (Axel patents); and,
- methods of gene silencing with the use of small interfering RNAs (Mello-Fire patents).
Many new drugs were developed using these platform technologies; if these technologies did not exist, the result may have been a vastly different economic outlook for the pharmaceutical industry.
A 2018 study found that public funding contributed to every NME approved by the FDA from 2010 to 2016.99 The study, which looked at peer-reviewed literature and public data on NIH grant funding, determined that funding from NIH was "directly or indirectly associated with every one of 210 NMEs approved from 2010-2016." Almost a third (29%) of the publications identified were directly associated with NIH-funded projects. The analysis in this study captured basic research, in addition to applied research on NMEs. The study found that up to 20% of the NIH budget allocation from 2000 to 2016, or about $100 billion, "was associated with published research that directly or indirectly contributed to NMEs approved from 2010-2016."100 The authors concluded that their results suggest that "the NIH contribution to research associated with new drug approvals is greater than previously appreciated."
How Much Does It Cost to Develop New Drugs?
Publicly traded pharmaceutical manufacturers release information about aggregate corporate research and development spending, but detailed information about the cost of developing specific drugs generally is not available. Over the years, academic researchers have attempted to estimate average spending for drug development.
The most often-cited academic study, by the Tufts Center for the Study of Drug Development, is based on information voluntarily provided by 10 large drug manufacturers. The study uses the manufacturers' data to estimate average spending for clinical research on new drugs (including experimental drugs that fail) and the time costs of development, meaning the expected returns that investors do not realize during the years a drug is moving toward approval. According to a 2014 Tufts estimate, the pretax cost of developing an FDA-approved prescription drug was $2.6 billion,97101 which included $1.4 billion in clinical spending and $1.2 billion in time costs.98102 The 2014 figure is an update of other Tufts studies, including a 2002 analysis that put the cost at $802 million.99
Academic and government research has challenged the Tufts study.100104 Specifically, there are questions about the study's assumption that drug companies must pay an effective 10.5% rate of return to attract capital during the years that drugs are in development, the mix of drugs sampled, and whether the report captures the positive impact of federal tax breaks for research and development spending. A 2016 HHS study noted that estimates for new drug development range from $1.2 billion to $2.6 billion and are highly sensitive to such factors as assumptions about development time; cost of capital; and whether the study includes orphan drugs, which are likely to have smaller trial sizes and higher success rates and which receive special federal tax breaks.101
Consumer groups and health insurers are lobbying for legislation that would require pharmaceutical firms to disclose more information about drug costs. 105
So-called transparency legislation being debated in Congress and a number of state legislatures would compel drugmakers to provide data about research, marketing, and other costs for drugs that have a high price or have experienced a large price increase.102106 (See "What Are U.S. States Doing to Address Drug Costs?")
Price transparency legislation assumes that research and development costs are, or should be, a main factor used by drugmakers in setting prices. Several studies of specific drugs indicate that research cost was not a primary factor in pricing. A 2015 Senate Finance Committee investigation of Gilead Pharmaceutical's hepatitis C drugs Sovaldi and Harvoni found that Gilead's research and development costs, and its expected return for buying Pharmasset, Inc., which originally developed the products, "were not key considerations in determining the pricing of these drugs." Gilead's "own documents and correspondence show its pricing strategy was focused on maximizing revenue—even as the company's analysis showed a lower price would allow more patients to be treated."103107 Similarly, an examination of the Pfizer breast cancer drug Ibrance found the main factors used by Pfizer to set the drug's list price were the price of existing drugs in the same therapeutic category, likely reimbursement from insurance companies and federal programs and feedback from prescribers.104108
Does Congress Regulate Prescription Drug Ads?
The United States is one of two nations (along with New Zealand) that allow direct-to-consumer (DTC) advertising of prescription drugs.105109 Congress has given FDA the authority to regulate DTC ads to ensure they are not false or misleading, fairly balance the benefits and risks of the specific drugs, and contain facts relevant to a drug's intended uses.106110 Under current law, businesses, including pharmaceutical companies, may take a federal tax deduction for advertising expenses. Advertising expenditures generally are treated as ordinary and necessary business expenses in the tax code and can be fully deducted in the year they are incurred.
DTC advertising is just one facet of industry-the industry's promotion efforts. Pharmaceutical firms also market to physicians and other health care providers via professional journals, conferences, marketing calls, and samples.107
Pharmaceutical advertising has evolved since 1962, when Congress gave FDA (rather than the Federal Trade Commission) authority (within limits) over prescription drug advertising, within limits. In 1969, when FDA issued regulations requiring manufactures to provide true and balanced information in drug promotionsadvertising, most ads were in print journals directed at physicians.108112 During the 1980s, pharmapharmaceutical firms began advertising to consumers; FDA addressed this in a 1985 Federal Register notice. In 1999, FDA issued guidance on broadcast ads.109113 Since that time, FDA has published updated guidance on relevant issues, including Internetinternet advertising.110114
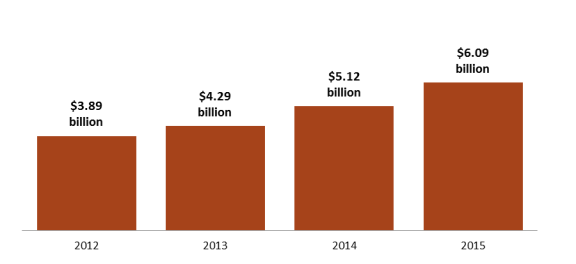
DTC prescription drug advertising expanded steadily over the decades, reaching more than $5 billion in 2006.111115 Advertising dipped during the 2007 recession and did not rebound to the 2006 peak until about 2014. Recent data indicate that DTC advertising has been increasing at a more rapid pace during the past several years. (See Figure 8.) According to Kantar Media, a market research and marketing firm, pharmaceutical advertising rose 56% to more than $6 billion from 2012 to 2015,112116 as companies increased the number of drugs with large dedicated advertising budgets and directed more money toward advertising newly introduced drugs.113117
Television and newspaper advertisements account for the majority of spending on pharmaceutical DTC advertising. However, Internetinternet-based drug ads—which are less expensive than television, magazine, or newspaper ads—appear to be the fastest-growing area of DTC promotion.
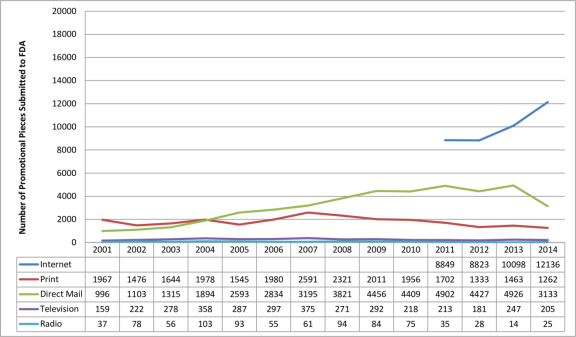
Federal regulations require that at the same time a drug company disseminates a prescription drug ad, it also submits the ad to FDA, which assesses whether it is fair, balanced, and meets other regulatory standards. According to an FDA analysis of materials submitted for review from 2001 to 2014, the number of Internetinternet prescription drug promotions is increasing, whereas television promotions are flat.114118 (The data tell how often ads are submitted to the FDA but not how often the ads actually appear in different media outlets.) (See Figure 9.)
|
Figure 9. Number of Prescription Drug Ads Reviewed by FDA (review classified by type of media) |
 |
|
Source: U.S. Food and Drug Administration (FDA), Office of Prescription Drug Promotion. |
Supporters of pharmaceutical advertising say it contributes to more informed consumers who then visit their doctors and become more involved in their own treatment, leading to better and earlier diagnosis of undertreated illnesses. Critics say the industry's presentation of the balance of drug benefit and risk information may encourage inappropriate prescribing of advertised products and ultimately may lead to higher drug spending. Advertising for new brand-name drugs with higher prices may lead consumers to seek brand-name products rather than cheaper generics or to begin, substituting them for lower-priced brand or generic drugs or beginning a course of treatment where previously no drug had been used. It is not clear, in some cases, that the new drugs are more effective or safer than other drugs or that they confer enough additional benefits compared to existing treatments to justify paying their higher prices.
Recent studies suggest a link between drug advertising and increased use of prescription drugs. A 2015 study suggested that a 10% rise in drug advertising views leads to a 5.4% increase in filled prescriptions for the advertised drugs.115119 A 2006 Government Accountability Office report found that advertising may have direct benefits but also may encourage use of advertised drugs even if alternatives may be more appropriate.116120 A recent government survey found that 46% of the public did not think the DTC advertisements included enough information about the benefits of the drugs and 52% thought they did not include enough information about the risks.117
Congress has debated restricting DTC drug advertising in the past. The issue has received new attention with two distinct goals: protecting the public's health from unsafe or ineffective drugs and protecting the public's pocketbook from unnecessary higher spending. In November 2015, the American Medical Association voted to recommend a ban on DTC drug ads.118122 In January 2016, the American Society of Health-System Pharmacists followed suit.119123 A ban could raise constitutional issues, given that courts in the past have ruled that product advertisements are "commercial speech" protected by the First Amendment.120124
Legislation introduced in the 114th Congress would have imposed a moratorium on advertising for new drugs.121125 The Kantar data indicating that manufacturers are focusing ad dollars on newly introduced products underscores a long-standing concern that new drugs are being promoted to consumers before there is long-term evidence about their safety and effectiveness has been collected.122.126 In 2006, the Institute of Medicine recommended that the FDA restrict DTC advertising of new drugs for two years after introduction.123127 Over the years, Congress has debated, but has not approved, a moratorium on advertising for new drugs.124128
Likewise, lawmakers during the 114th Congress introduced legislation to disallow federal tax deductions for pharmaceutical DTC advertising as a means to reduce drug spending.125 129 Congress also has debated the issue in the context of broader tax reform.126
May U.S. Consumers Import Drugs from Abroad?
FDA, under the authority of the Federal Food, Drug, and Cosmetic Act, regulates the sale of pharmaceuticals in the United States.127131 Without an approved marketing application (either anew drug application, abbreviated new drug application, or a biologics license application), a manufacturer may not sell a drug in the U.S. market.128132 An approved marketing application has included the required clinical data on safety and effectiveness, manufacturing procedures (supported by an inspection) and reporting processes, and labeling, including packaging. Because the requirements are so detailed and explicit, no drug that a consumer might import would technically fulfill all the approval elements. (For example, a drug must include labeling that FDA has approved for U.S. sales; the labeling of a physically identical drug packaged for foreign sale would not have the U.S.-relevant packaging codes.) The Prescription Drug Marketing Act of 1987 (PDMA; P.L. 100-293) clarified that, even for a drug that FDA had approved for U.S. sales that had been sold or transferred to a foreign country, only the manufacturer of that FDA-approved prescription drug may legally bring the drug back into the United States.129
In 2000, during a period of high prescription drug inflation, the 106th Congress enacted the Medicine Equity and Drug Safety Act (MEDS Act; P.L. 106-387) to allow pharmacists and wholesalers to import FDA-approved prescription drugs. Despite outlining procedures to do so, the act, in practice, has not allowed such importation. The MEDS Act required that, before publishing implementing regulations to put the import provisions into effect, the HHS Secretary must first certify to Congress "that the implementation of this section will (1) pose no additional risk to the public's health and safety; and (2) result in a significant reduction in the cost of covered products to the American consumer."130134 Congress included a similarreworking of the MEDS Act provision in 2003 in the Medicare Modernization and Prescription Drug Act of 2003 (MMA; P.L. 108-173), which also created Medicare Part D). Because no HHS Secretary has ever made the necessary certifications, the importation provision has never been carried out and consumers, pharmacists, and wholesalers are prohibited from importing prescription drugs from abroad.131
The PDMA, MEDS Act, and MMA legislation addressed importation by entities other than the manufacturer that held the approved marketing application. ThereforeIf the importation provision were implemented, therefore, a company could produce and package a drug outside the United States according to manufacturing processes, facility inspections, and U.S.-audience designed labeling as outlined in theits FDA approval and then bring the drug into the United States for sale.
Lawmakers have tried several times to use the annual agriculture appropriations bill (which funds FDA) to get around administrative roadblocks to prescription drug importation by individuals, pharmacies, and wholesalers. For example, the House has passed versions of the agriculture spending bill that would prohibit FDA from using funds to prevent individuals, pharmacists, or wholesalers from importing prescription drugs that comply with the core requirements of the FDA drug approval system.132
FDA has chosen to be lenient in its enforcement of personal importation restrictions and has allowed individuals to bring into the United States a small amount (i.e., a 90-day supply) of non-FDA-approved drugs for personal use. FDA requires that individuals affirm in writing that the drugs are for their own use and provide the name and address of their treating physician. When FDA's personal-use import policy began, it was not envisioned as a way for consumers to bring lower-priced prescription drugs into the United States. According to FDA's policy statement on importing drugs for personal use,
the intent of the personal use importation guidance is to save FDA resources and to generally permit, through the exercise of enforcement discretion, medical treatments sought by individuals that are not otherwise available in the United States (where such treatments are not promoted/commercialized in the United States). Thus foreign-made chemical versions of drugs available in the United States are not intended to be covered by the policy.133
But where the policy once compassionately let a few people import—for personal use—cancer or AIDS drugs that were not available for sale in the United States, today that policy is used by consumers seeking lower foreign prices for FDA-approved drugs available in the United States.134138 Some states have attempted to enact their own laws allowing prescription drug importation. (See "What Are U.S. States Doing to Address Drug Costs?")
Appendix A.
. Relevant Congressional Drug Pricing Hearings in the 114th and 115th Congresses
Senate Committee on Appropriations
Prioritizing Public Health: The FDA's Role in the Generic Drug Marketplace, 114th Cong., 2nd sess., September 21, 2016, at http://www.appropriations.senate.gov/hearings/prioritizing-public-health_the-fdas-role-in-the-generic-drug-marketplace.
Senate Special Committee on Aging
Valeant Pharmaceuticals' Business Model: the Repercussions for Patients and the Health Care System, 114th Cong., 2nd sess., April 27, 2016, at http://www.aging.senate.gov/hearings/valeant-pharmaceuticals-business-model-the-repercussions-for-patients-and-the-health-care-system.
Sudden Price Spikes in Decades-Old Rx Drugs: Inside the Monopoly Business Model, 114th Cong., 2nd sess., March 17, 2016, at http://www.aging.senate.gov/hearings/sudden-price-spikes-in-decades-old-rx-drugs-inside-the-monopoly-business-model.
Sudden Price Spikes in Off-Patent Drugs: Perspectives from the Front Lines, 114th Cong., 1st sess., December 9, 2015, at http://www.aging.senate.gov/hearings/sudden-price-spikes-in-off-patent-drugs_perspectives-from-the-front-lines.
Senate Committee on Finance
Examining the Proposed Medicare Part B Drug Demonstration, 114th Cong., 2nd sess., June 28, 2016; at http://www.finance.senate.gov/hearings/examining-the-proposed-medicare-part-b-drug-demonstration.
Senate Committee on Health, Education, Labor, and Pensions
The Cost of Prescription Drugs: An Examination of The National Academies of Sciences, Engineering, and Medicine Report "Making Medicines Affordable: A National Imperative"115th Cong., 1st sess., December 12, 2017, at https://www.help.senate.gov/hearings/the-cost-of-prescription-drugs-an-examination-of-the-national-academies-of-sciences-engineering-and-medicine-report-making-medicines-affordable-a-national-imperative. The Cost of Prescription Drugs: How the Drug Delivery System Affects What Patients Pay, Part II, 115th Cong., 1st sess., October 17, 2017, at https://www.help.senate.gov/hearings/the-cost-of-prescription-drugs-how-the-drug-delivery-system-affects-what-patients-pay-part-ii. The Cost of Prescription Drugs: How the Drug Delivery System Affects What Patients Pay, 115th Cong., 1st sess., June 13, 2017, at https://www.help.senate.gov/hearings/the-cost-of-prescription-drugs-how-the-drug-delivery-system-affects-what-patients-pay.
Generic Drug User Fee Amendments: Accelerating Patient Access to Generic Drugs, 114th Cong., 2nd sess., January 28, 2016, at http://www.help.senate.gov/hearings/generic-drug-user-fee-amendments-accelerating-patient-access-to-generic-drugs.
Biosimilar Implementation: A Progress Report from FDA, 114th Cong., 1st sess., September 17, 2015, at http://www.help.senate.gov/hearings/biosimilar-implementation-a-progress-report-from-fda.
Continuing America's Leadership: Advancing Research and Development for Patients, 114th Cong., 1st sess., March 24, 2015, at http://www.help.senate.gov/hearings/continuing-americas-leadership-advancing-research-and-development-for-patients.
House Energy and Commerce Committee
Examining the Drug Supply Chain, 115th Cong., 2nd sess., December 13, 2017, at https://energycommerce.house.gov/hearings/examining-drug-supply-chain/. Examining How Covered Entities Utilize the 340B Drug Pricing Program, 115th Cong., 1st sess., October 11, 2017, https://energycommerce.house.gov/hearings/examining-covered-entities-utilize-340b-drug-pricing-program/. Examining Patient Access to Investigational Drugs, 115th Cong., 1st sess., October 3, 2017, at https://energycommerce.house.gov/hearings/examining-patient-access-investigational-drugs/.Modernizing FDA's Regulation of Over-the-Counter Drugs, 115th Cong., 1st sess., September 13, 2017, https://energycommerce.house.gov/hearings/modernizing-fdas-regulationof-counter-drugs/.
Examining FDA's Prescription Drug User Fee Program, 115th Cong., 1st sess., March 22, 2017, at https://energycommerce.house.gov/hearings-and-votes/hearings/examining-fda-s-prescription-drug-user-fee-program.
Examining FDA's Generic Drug and Biosimilar User Fee Program, 115th Cong., 1st sess., March 2, 2017, at https://energycommerce.house.gov/hearings-and-votes/Hearing.
The Obama Administration's Medicare Drug Experiment: The Patient and Doctor Perspective, 114th Cong., 2nd sess., May 17, 2016, at https://energycommerce.house.gov/hearings-and-votes/hearings/obama-administration-s-medicare-drug-experiment-patient-and-doctor.
House Judiciary Committee
Antitrust Concerns and the FDA Approval Process, 115th Cong., 1st sess., July 27, 2017, at https://judiciary.house.gov/hearing/antitrust-concerns-fda-approval-process/.
House Committee on Oversight and Government Reform
Federally Funded Cancer Research: Coordination and Innovation, 115th Cong., 1st sess., March 29, 2017, at https://oversight.house.gov/hearing/federally-funded-cancer-research-coordination-innovation/.
Examining the Impact of Voluntary Restricted Distribution Systems in the Pharmaceutical Supply Chain, 115th Cong., 1st sess., March 22, 2017, at https://oversight.house.gov/hearing/examining-impact-voluntary-restricted-distribution-systems-pharmaceutical-supply-chain/.
Reviewing the Rising Price of EpiPens, 114th Cong., 2nd sess., September 21, 2016, at https://oversight.house.gov/hearing/reviewing-rising-price-epipens-2/.
Developments in the Prescription Drug Market: Oversight, 114th Cong., 2nd sess., February 4, 2016, at https://oversight.house.gov/hearing/developments-in-the-prescription-drug-market-oversight/
Appendix B.
CRS Prescription Drug Experts
|
Name |
Subject |
|
Phone |
|
[author name scrubbed] |
Medicaid and Medicare Part B |
[email address scrubbed] |
[phone number scrubbed] |
|
[author name scrubbed] |
Food and Drug Administration |
[email address scrubbed] |
[phone number scrubbed] |
|
[author name scrubbed] |
Biodefense Drug Development |
[email address scrubbed] |
[phone number scrubbed] |
|
Judith Johnson |
National Institutes of Health |
[email address scrubbed] |
[phone number scrubbed] |
|
Suzanne Kirchhoff |
Medicare Part D and Private Health Insurance |
[email address scrubbed] |
[phone number scrubbed] |
|
Sidath Panangala |
Veterans Health Administration |
[email address scrubbed] |
[phone number scrubbed] |
|
[author name scrubbed] |
Food and Drug Administration |
[email address scrubbed] |
[phone number scrubbed] |
|
[author name scrubbed] |
Visiting Scholar, Intellectual Property Rights |
[email address scrubbed] |
Author Contact Information
Footnotes
| 1. |
Centers for Medicare & Medicaid Services (CMS), "National Health Expenditure Projections |
||||
| 2. |
|
||||
| 3. |
Although spending for drugs in institutional settings is not included in the NHE retail prescription drug category, it is included in other categories of spending and in overall national health care spending. For example, drugs dispensed in hospitals are included in the NHE hospital spending category. |
||||
| 4. |
Many over-the-counter products originally were prescription products, such as some antihistamines. See U.S. Food and Drug Administration (FDA), "Now Available Without a Prescription," at http://www.fda.gov/Drugs/ResourcesForYou/Consumers/ucm143547.htm. |
||||
| 5. |
CMS, "National Health |
||||
| 6. |
According to the NHE, retail prescription drug spending was 10% of national health expenditures in 1960. Retail drug spending declined to less than 5% of national health expenditures from 1960 to 1982. During this period, other areas of medical spending were increasing more quickly than drug spending due to the creation of government health programs such as Medicare and Medicaid and the expansion of private health insurance. Retail drug spending began to increase as a share of national health spending in the mid-1980s, due to price inflation and growing consumption. By the early 2000s, retail drug spending had once again reached about 10% of national health care expenditures. See Cynthia Smith, "Retail Prescription Drug Spending in the National Health Accounts," Health Affairs, vol. 233, no. 1 (January/February 2004), pp. 160-167, at |
||||
| 7. |
Department of Health and Human Services (HHS), Office of the Assistant Secretary for Planning and Evaluation, "Observations on Trends in Prescription Drug Spending," March 8, 2016, at https://aspe.hhs.gov/sites/default/files/pdf/187586/Drugspending.pdf. The HHS estimate is based on NHE retail prescription drug data and an outside analysis by the Altarum Institute, a nonprofit health systems research and consulting organization. According to Altarum, |
||||
| 8. |
IQVIA (formerly IMS Health) estimates that drug spending |
||||
| 9. |
Aaron Catlin and Cathy Cowan, History of Health Spending in the United States, 1960-2013, CMS, p. 23, at https://www.cms.gov/Research-Statistics-Data-and-Systems/Statistics-Trends-and-Reports/NationalHealthExpendData/Downloads/HistoricalNHEPaper.pdf. The implementation of Medicare Part D in 2006 caused a spike in prescription drug spending that year. |
||||
| 10. |
Ibid., p. 23. |
||||
| 11. |
CMS, "National Health Expenditure Projections |
||||
|
| |||||
| 13. | Ibid. |
||||
| 14. |
Anne B. Martin | ||||
| 15. |
FDA, "2016 Novel Drugs Summary," January 2017, at http://www.fda.gov/downloads/Drugs/DevelopmentApprovalProcess/DrugInnovation/UCM536693.pdf. |
||||
| 15.
|
|
Micah Hartman et al., "National Health Care Spending In 2016: Spending and Enrollment Growth Slow after Initial Coverage Expansions," Health Affairs, vol. 37, no.1 (January 2018), at https://www.healthaffairs.org/doi/abs/10.1377/hlthaff.2017.1299. 16.
|
|
FDA approved 46 novel drugs in 2017, 22 in 2016, and 45 in 2015. See FDA, "Novel Drug Approvals for 2017," January 2017, at https://www.fda.gov/Drugs/DevelopmentApprovalProcess/DrugInnovation/ucm537040.htm. |
CRS Report R44132, Specialty Drugs: Background and Policy Concerns |
|
| |||||
|
Murray Aitken et al., "Has the Era of Slow Growth for Prescription Drug Spending Ended?" Health Affairs, vol. 35, no. 9 (September 2016), p. 1601. The study looked at retail and institutional drug spending. Health Care Cost Institute, 2014 Health Care Cost and Utilization Report, October 2015, p. ii, at http://www.healthcostinstitute.org/files/2014%20HCCUR%2010.29.15.pdf. The report, based on claims data from three major commercial insurers, found that per capita brand-name drug spending in employer-sponsored plans rose by $45 from 2013 to 2014. About two-thirds of the increase, $29.60, was for newly introduced drugs for hepatitis C. Analysts expect new innovator drugs to account for an increasing share of spending going forward. Pharmacy benefits manager Express Scripts estimates that specialty drugs made up more than |
|||||
|
|
21.
IQVIA Institute, "Medicines Use and Spending in the U.S. A Review of 2016 and Outlook to 2021," May 2017. See Charts 4 and 13. Available for download at https://www.iqvia.com/institute/reports/medicines-use-and-spending-in-the-us-a-review-of-2016. |
Among the drugs losing patent protection was Pfizer's blockbuster Lipitor. |
|||
|
|
|||||
|
CRS Report RL34045, FDA Regulation of Follow-On Biologics |
|||||
|
Jonathan Rockoff, "Knockoffs of BioTech Drugs Bring Paltry Savings," The Wall Street Journal, May 5, 2016, at http://www.wsj.com/articles/knockoffs-of-biotech-drugs-bring-paltry-savings-1462458209. |
|||||
|
Retail inflation is a measure of the average change over time in prices for a set list of consumer goods and services The Consumer Price Index (CPI) is based on a market basket of goods and services. For prescription drugs, Department of Labor analysts survey a sample of drug stores and a list of the last 20 drugs dispensed. See http://www.bls.gov/cpi/cpifact4.htm. |
|||||
|
The CPI-U is the CPI value for urban consumers. It excludes rural populations and represents approximately 80% of the population. |
|||||
|
Murray Aitken et al., "Has the Era of Slow Growth for Prescription Drug Spending Ended?," Health Affairs, vol. 35, no. 9 (September 2016), pp. 1595-1603. The study looked at retail and institutional drug spending. |
|||||
|
HHS, "Understanding Recent Trends in Generic Drug Prices," January 27, 2016, at https://aspe.hhs.gov/pdf-report/understanding-recent-trends-generic-drug-prices. The study found that although some parts of the market had recently experienced large price increases, about two-thirds of generic products had price declines in 2014. |
|||||
|
Express Scripts, |
|||||
|
|||||
|
The essential health benefits are 10 categories of services required by private plans offered in the |
|||||
|
Express Scripts, "Exchange Pulse," June 2016, at http://lab.express-scripts.com/lab/publications/exchange-pulse-public-exchanges-report-june-2016. |
|||||
|
The ACA raised the income threshold used to qualify individuals for the Medicaid program, thereby expanding coverage to more people. The ACA originally made the state Medicaid expansion mandatory, but the Supreme Court found that the enforcement mechanism for the expansion was unconstitutional, basically rendering it voluntary. Although prescription drug coverage is an optional Medicaid benefit, all states include drug coverage. See CRS In Focus IF10399, Overview of the ACA Medicaid Expansion |
|||||
|
Medicaid and CHIP Payment and Access Commission (MACPAC), "Medicaid Spending for Prescription Drugs," January 2016, p. 6, at https://www.macpac.gov/wp-content/uploads/2016/01/Medicaid-Spending-for-Prescription-Drugs.pdf. Drug spending rose 24.6% in expansion states compared to 14.1% in non-expansion states in 2014. IQVIA Institute, "Medicines Use and Spending in the U.S., a Review of 2016 and Outlook to 2021," May 2017. Available for download at https://www.iqvia.com/institute/reports/medicines-use-and-spending-in-the-us-a-review-of-2016. | |||||
| 33. |
Ibid and HHS, Office of the Assistant Secretary for Planning and Evaluation, "Observations on Trends in Prescription Drug Spending," March 8, 2016, at https://aspe.hhs.gov/sites/default/files/pdf/187586/Drugspending.pdf. |
||||
| 34. |
|
||||
|
IMS, "Emergence and Impact of Pharmacy Deductibles: Implications for Patients in Commercial Health Plans," November 2015, at |
|||||
|
Jon Gabel et al., Commonwealth Fund, "Changes in Consumer Cost-Sharing for Health Plans Sold in the ACA's Insurance Marketplaces, 2015 to 2016," Exhibit 6, May 20, 2016, at http://www.commonwealthfund.org/~/media/files/publications/issue-brief/2016/may/1875_gabel_changes_cost_sharing_marketplaces_rb_v2.pdf. In 2016, 26% of exchange-based platinum plans, 44% of gold plans, 54% of silver plans, and 82% of bronze plans required enrollees to meet a deductible before prescription drug coverage began. Plans are listed in order from most comprehensive (platinum) to least comprehensive (bronze). |
|||||
|
Kaiser Family Foundation, Employer Health Benefits: |
|||||
|
Departments of Labor, HHS, and the Treasury, "FAQS About Affordable Care Act Implementation Part 36," January 9, 2017, at https://www.cms.gov/CCIIO/Resources/Fact-Sheets-and-FAQs/Downloads/ACA-FAQs-Part36_1-9-17-Final.pdf. |
|||||
|
See IMS, Medicines Use and Spending in the U.S.: A Review of 2015 and Outlook to 2020, p. 28, April 2016, at http://www.imshealth.com/en/thought-leadership/ims-institute/reports/medicines-use-and-spending-in-the-us-a-review-of-2015-and-outlook-to-2020. |
|||||
|
Peterson-Kaiser Health System Tracker, "Examining High Prescription Drug Spending for People with Employer Sponsored Health Insurance," October 27, 2016, at http://www.healthsystemtracker.org/insight/examining-high-prescription-drug-spending-for-people-with-employer-sponsored-health-insurance/. The 2009 figure of $167 is about $185 in 2014 dollars. |
|||||
|
Stacie B. Dusetzina1, "Share Of Specialty Drugs In Commercial Plans Nearly Quadrupled, 2003–14," Health Affairs, vol. 35 no. 7, July 2016 , pp. 1241-1246. Dollar figures were inflation-adjusted to 2014 levels. Mean spending for specialty drugs rose from $41 in 2003 to $77 in 2014, while mean spending on |
|||||
|
CMS, "National Health Expenditure Projections |
|||||
|
For example, the federal government subsidizes about 75% of the basic Medicare Part D benefit. See CRS Report R40611, Medicare Part D Prescription Drug Benefit |
|||||
|
CMS, "National Health Expenditure Projections |
|||||
|
See "Is U.S. Prescription Drug Spending Higher Than in Other Nations?" |
|||||
|
Beginning with the Food and Drugs Act of 1906, Congress has incrementally refined and expanded FDA's responsibilities regarding drug approval and regulation. CRS Report R41983, How FDA Approves Drugs and Regulates Their Safety and Effectiveness |
|||||
|
HHS, Office of Inspector General (OIG), "Medicaid Rebates for Brand-Name Drugs Exceeded Part D Rebates by a Substantial Margin," April 2015, at http://oig.hhs.gov/oei/reports/oei-03-13-00650.pdf. Medicare Part D rebates were a smaller 15% of drug spending in 2012, according to the HHS OIG. |
|||||
|
Other government health programs not in Table 2 include those run by the Department of Defense and the Indian Health Service. |
|||||
|
Part D plans must provide coverage that is at least equivalent to a set standard benefit, which is set and updated annually by HHS. Part D plans also may offer more generous coverage. |
|||||
|
CRS Report R40611, Medicare Part D Prescription Drug Benefit |
|||||
|
§1860D-11(i) of the Social Security Act. The actual wording of the noninterference provision is that "In order to promote competition under this part and in carrying out this part, the Secretary (1) may not interfere with the negotiations between drug manufacturers and pharmacies and PDP sponsors; and (2) may not require a particular formulary or institute a price structure for the reimbursement of covered Part D drugs." A PDP is a stand-alone Part D drug plan. Medicare beneficiaries also may obtain Part D benefits as part of a Medicare Advantage plan, or an MA-PD. |
|||||
|
Although Part D does not have a central formulary, Part D plans are required to cover at least two distinct drugs in each class and category, as defined by U.S. Pharmacopeial Convention (USP), an independent scientific organization. In addition, all Part D plans must cover substantially all drugs in six protected classes: immunosuppressant, antidepressant, antipsychotic, anticonvulsant, antiretroviral, and antineoplastic. The HHS Secretary may change the six protected classes through formal rulemaking, based on scientific evidence. |
|||||
|
For a more detailed discussion, see |
|||||
|
Boards of Trustees, Federal Hospital Insurance and Federal Supplementary Medical Insurance Trust Funds, |
|||||
|
CBO, Competition and the Costs of Medicare's Prescription Drug Program, July 2014, at https://www.cbo.gov/sites/default/files/113th-congress-2013-2014/reports/45552-PartD.pdf. |
|||||
|
CBO found that net Medicaid prices were lower than Part D prices due largely to Medicaid statutory rebates on brand-name drugs, including required rebates when prices rise faster than the rate of retail inflation. CBO, Competition and the Costs of Medicare's Prescription Drug Program, July 2014, at https://www.cbo.gov/sites/default/files/113th-congress-2013-2014/reports/45552-PartD.pdf; HHS OIG, "Medicaid Rebates for Brand-Name Drugs Exceeded Part D Rebates by a Substantial Margin," April 2015, at http://oig.hhs.gov/oei/reports/oei-03-13-00650.pdf; and Government Accountability Office, "Comparison of DOD, Medicaid, and Medicare Part D Retail Reimbursement Prices," June 30, 2014, at http://www.gao.gov/products/GAO-14-578. |
|||||
|
HHS OIG, "Medicaid Rebates for Brand-Name Drugs Exceeded Part D Rebates by a Substantial Margin," April 2015, at http://oig.hhs.gov/oei/reports/oei-03-13-00650.pdf; and Government Accountability Office, "Comparison of DOD, Medicaid, and Part D Retail Reimbursement Prices," June 2014, at http://www.gao.gov/assets/670/664521.pdf. |
|||||
|
Program data indicate that the Part D market is dominated by a small number of health payers. According to the Medicare Payment Advisory Commission (MedPAC), in |
|||||
|
The House passed the measure by a vote of 255-170 on January 12, 2007. See http://clerk.house.gov/evs/2007/roll023.xml. For a text of the bill, see https://www.congress.gov/bill/110th-congress/house-bill/4/text. |
|||||
|
CBO Letter to Rep. John Dingell, January 10, 2007, at https://www.cbo.gov/sites/default/files/cbofiles/ftpdocs/77xx/doc7722/hr4.pdf. See also CBO letter to Senator Ron Wyden, April 10, 2007, |
|||||
|
Letter to Congress from Coalition of Consumer and Health Care Groups, March 18, 2013, at http://www.nam.org/Issues/Health-Care/Letter-to-Congress-to-Protect-Medicare-Part-D(1)/. See also https://www.cbo.gov/sites/default/files/110th-congress-2007-2008/costestimate/s30.pdf. |
|||||
|
Legislation in the 114th Congress included H.R. 4207, H.R. 3061, S. 31, and S. 1884. In the 115th Congress, measures include S. 41. The measures vary from giving the Secretary authority to negotiate prices for all Part D drugs, to allowing negotiations only for sole-source drugs, to allowing the Secretary to negotiate prices and set formularies for special Part D plans that would be open to all enrollees on a national basis. |
|||||
|
HHS, "FY2017 Budget in Brief, CMS, Medicare," at http://www.hhs.gov/about/budget/fy2017/budget-in-brief/cms/medicare/index.html. As part of the negotiations, manufacturers would be required to supply HHS with cost and clinical data and any other information needed to reach a price agreement. The proposal was also part of the Obama Administration's FY2016 budget proposal. |
|||||
|
|
67.
HHS, "FY2019 Budget in Brief, CMS, Medicare," at https://www.hhs.gov/about/budget/index.html#bib. |
For example, see S. 252, the Medicare Drug Savings Act of 2017. |
|||
|
CBO, Budget Options, "Require Manufacturers to Pay a Minimum Rebate on Drugs Covered Under Part D of Medicare for Low-Income Beneficiaries," at https://www.cbo.gov/budget-options/2016/52239. |
|||||
|
For directories of state legislation see National Conference of State Legislatures, "2015- |
|||||
|
CA AB 339 was signed by Governor Jerry Brown on October 8, 2015. For the text of the bill, see https://leginfo.legislature.ca.gov/faces/billNavClient.xhtml?bill_id=201520160AB339. |
|||||
|
Senate Bill 35, 147th General Assembly, Delaware, at http://legis.delaware.gov/BillDetail?LegislationId=22620. See also Connecticut Office of Legislative Research, "State Laws Limiting Prescription Drug Cost Sharing," July 13, 2016, at https://www.cga.ct.gov/2016/rpt/pdf/2016-R-0134.pdf. |
|||||
|
Ed Silverman, "Vermont Becomes First State to Require Drug Makers to Justify Price Hikes," Pharmalot/ STAT, June 6, 2016, at https://www.statnews.com/pharmalot/2016/06/06/vermont-drug-prices-transparency/. See also http://legislature.vermont.gov/bill/status/2016/S.216. The law directs the state to identify up to 15 prescription drugs annually on which the state spends significant health care dollars and for which the wholesale acquisition cost has increased by 50% or more over the previous five years, or by 15% or more over the |
|||||
|
| |||||
|
Eric Russell, "Judge Strikes Down Maine Law Allowing Residents to Buy Drugs from Foreign Pharmacies," Portland Press Herald, February 25, 2015, at http://www.pressherald.com/2015/02/24/maine-residents-cant-order-drugs-from-foreign-pharmacies-judge-rules/. See also State of Maine, An Act to Facilitate the Personal Importation of Prescription Drugs from International Mail Order Prescription Pharmacies, at http://www.mainelegislature.org/legis/bills/getPDF.asp?paper=SP0060&item=4&snum=126. |
|||||
|
|
|||||
|
Ibid. |
|||||
|
| |||||
| 75. |
|
||||
|
University of Liverpool, "Americans Overpaying for Drugs Say Researchers," September 24, 2015, at https://news.liverpool.ac.uk/2015/09/24/americans-overpaying-for-cancer-drugs-say-researchers/. Andrew Hill et al., "Target Prices for Mass Production of Tyrosine Kinase Inhibitors for Global Cancer Treatment," BMJ Open, 2016, at http://bmjopen.bmj.com/content/6/1/e009586.full. Tyrosine kinase inhibitors are used to treat cancer by blocking a specific enzyme. |
|||||
|
Panos Kanavos et al., "Higher U.S. Branded Drug Prices and Spending Compared to Other Countries May Stem Partly from Quick Uptake of New Drugs," Health Affairs, vol. 32, no. 4 (April 2013), pp. 753-761. |
|||||
|
European Commission, Study on Enhanced Cross-County Coordination in the Area of Pharmaceutical Product Pricing, by Gesundheit Österreich Forschung-und Planungs GmbH, December 2015, at http://ec.europa.eu/health//sites/health/files/systems_performance_assessment/docs/pharmaproductpricing_frep_en.pdf. According to the report, reference pricing has limitations, including providing incentives for companies to launch medicines in countries with a high price level. |
|||||
|
Vallerie Paris, and Annalisa Belloni, "Value in Pharmaceutical Pricing," OECD Health Working Papers, No. 63, 2013, at http://dx.doi.org/10.1787/5k43jc9v6knx-en. |
|||||
|
CADTH Common Drug Review (CDR), at https://www.cadth.ca/about-cadth/what-we-do/products-services/cdr. |
|||||
|
Ed Silverman, "Another Big Insurer Will Pay for Key Drugs Based on Patient Outcomes," STAT, June 27, 2016, at https://www.statnews.com/pharmalot/2016/06/27/harvard-pilgrim-eli-lilly-novartis/. |
|||||
|
CMS, "Medicaid Drug Rebate Program Notice," Release No. 99, July 14, 2016, at https://www.medicaid.gov/Medicaid-CHIP-Program-Information/By-Topics/Prescription-Drugs/Downloads/Rx-Releases/MFR-Releases/mfr-rel-099.pdf; and Stephen Barlas,"Value Purchasing Programs Make Plodding Progress, Drug Manufacturers Question Some Pay-for-Performance Methodologies," P & T, vol. 41, no. 9 (September 2016), at https://pharmscope.com/journal/article/full/2016/09/562/value-purchasing-programs-make-plodding-progress. |
|||||
|
Institute for Clinical and Economic Review (ICER), "ICER Launches New Drug Assessment Program with $5.2 Million Award from the Laura and John Arnold Foundation," July 21, 2015, http://icer-review.org/announcements/icer-ljaf-drug-assessment-announcement/. |
|||||
|
PhRMA, "ICER Framework Threatens to Halt Continued Progress Against Multiple Myeloma," May 26, 2016. |
|||||
|
ICER, "ICER Value Assessment Framework," at https://icer-review.org/methodology/icers-methods/icer-value-assessment-framework/. |
|||||
|
Hamilton Moses et al., "The Anatomy of Medical Research: U.S. and International Comparisons," JAMA, vol. 313, no. 2 (January 13, 2015), pp. 174-189. |
|||||
|
Recombinant DNA is the joining of DNA molecules from different species in a host organism to produce a new genetic combination. Publicly funded research played an instrumental role in the development of recombinant DNA beginning in the 1970s. |
|||||
|
Joseph A. DiMasi, Ronald W. Hansen, Henry G. Grabowski, "The Price of Innovation: New Estimates of Drug Development Costs," Journal of Health Economics, vol. 22 (2003), pp. 151-185. |
|||||
|
Kenneth I. Kaitin, Natalie R. Bryant, Louis Lasagna, "The Role of the Research-Based Pharmaceutical Industry in Medical Progress in the United States," Journal of Clinical Pharmacology, vol. 33, no. 5 (May 1993), pp. 412-417. |
|||||
|
FDA, "New Drugs at FDA: CDER's New Molecular Entities and New Therapeutic Biological Products," at http://www.fda.gov/Drugs/DevelopmentApprovalProcess/DrugInnovation/ucm20025676.htm. |
|||||
|
Robert Kneller, "The Importance of New Companies for Drug Discovery: Origins of a Decade of New Drugs," Nature Review Drug Discovery, vol. 9 (2010), pp. 867-882. |
|||||
|
Ashley J. Stevens et al., "The Role of Public-Sector Research in the Discovery of Drugs and Vaccines," The New England Journal of Medicine, vol. 364, no. 6 (February 10, 2011), pp. 535-541. |
|||||
|
Ibid, p. 539. |
|||||
|
FDA, "Priority Review" at http://www.fda.gov/ForPatients/Approvals/Fast/ucm405405.htm. A priority review designation means FDA's goal is to take action on an application within 6 months (compared to 10 months under standard review). |
|||||
|
Ashley J. Stevens et al., "The Role of Public-Sector Research in the Discovery of Drugs and Vaccines," The New England Journal of Medicine, vol. 364, no. 6 (February 10, 2011), p. 541. |
|||||
|
Ibid., p. 537. |
|||||
|
|
Ekaterina Galkina Cleary et al., "Contribution of NIH Funding to New Drug Approvals 2010-2016," PNAS, vol. 115, no. 10 (March 6, 2018), pp. 2329-2334. 100.
|
|
Ibid., p. 2333 |
Tufts Center for the Study of Drug Development, "Cost to Develop and Win Marketing of a New Drug is $2.6 Billion," November 18, 2014, at http://csdd.tufts.edu/news/complete_story/pr_tufts_csdd_2014_cost_study. |
|
|
Tufts Center for the Study of Drug Development, "Tufts CSDD Assessment of Cost to Develop and Win Marketing Approval for a New Drug Now Published," March 10, 2016, at http://csdd.tufts.edu/news/complete_story/tufts_csdd_rd_cost_study_now_published. The figure rises to $2.9 billion when FDA-mandated post-approval costs (such as additional testing and monitoring) are added, according to Tufts. The study was based on data provided by 10 pharmaceutical companies on 106 randomly selected drugs that were first tested in human subjects anywhere in the world from 1995 to 2007. |
|||||
|
|
|||||
|
Tufts Center for the Study of Drug Development, "Tufts CSDD R&D Cost Study Includes Link to Questions and Answers About Study and Methodology," at http://csdd.tufts.edu/news/complete_story/cost_study_press_event_webcast. |
|||||
|
HHS, Prescription Drugs: Innovation, Spending and Patient Access, Chapter 2, December 7, 2016, at http://apps.who.int/medicinedocs/en/m/abstract/Js23128en/. Also see FDA "Developing Products for Rare Diseases & Conditions," at http://www.fda.gov/ForIndustry/DevelopingProductsforRareDiseasesConditions/ucm2005525.htm. |
|||||
|
For example, in Congress see S. 3335, which would require drug manufacturers to notify HHS and provide cost data before increasing the price of certain drugs by more than 10%. In states, see National Conference of State Legislatures, "2015-2016 State Legislation to Require Prescription Drug Cost and Price Transparency," at http://www.ncsl.org/documents/health/2015-16_Legislation_Cost_Transparency_Prescription_Drugs-Nov.pdf. |
|||||
|
U.S. Congress, Senate Committee on Finance, The Price of Sovaldi and its Impact on the U.S. Health Care System, 114th Cong., 1st sess., S.Rept. 114-20, December 2015, Executive Summary, at http://www.finance.senate.gov/imo/media/doc/11%20SFC%20Sovaldi%20Report%20Executive%20Summary.pdf. |
|||||
|
Jonathan D. Rockoff, "How Pfizer Set the Cost of Its New Drug at $9,850 a Month," Wall Street Journal, December 9, 2015, at http://www.wsj.com/articles/the-art-of-setting-a-drug-price-1449628081 (by subscription). |
|||||
|
The Federal Food, Drug, and Cosmetic Act (21 U.S.C. §301) is the main source of the FDA authority to regulate drug ads. The 1962 Kefauver-Harris amendments (PL 87-871) gave FDA rather than the Federal Trade Commission main regulatory authority over prescription drug advertising. |
|||||
|
FDA has issued regulations over the years that have broadened drugmakers' ability to advertise on television and other media. 21 C.F.R. §202.1. For a list of laws and regulations, see FDA, OPDP Regulatory Information, at http://www.fda.gov/AboutFDA/CentersOffices/OfficeofMedicalProductsandTobacco/CDER/ucm109905.htm. |
|||||
|
The ACA included "sunshine" provisions requiring reporting of industry payments for research, gifts, speaking fees, meals and other activities. See CMS, "Open Payments," at https://openpaymentsdata.cms.gov/summary. |
|||||
|
Julie Donohue, "A History of Drug Advertising: The Evolving Roles of Consumers and Consumer Protection," The Milbank Quarterly, vol. 84, no. 4 (2006), pp. 659–699, at https://www.ncbi.nlm.nih.gov/pmc/articles/PMC2690298/. |
|||||
|
See FDA, "OPDP Regulatory Information," at http://www.fda.gov/AboutFDA/CentersOffices/OfficeofMedicalProductsandTobacco/CDER/ucm109905.htm. |
|||||
|
Ibid. |
|||||
|
Pharmaceutical direct-to-consumer advertising is estimated by firms including IMS Health, Kantar Media, and Nielsen. Spending estimates vary, but the data sets show similar trends. See "Pharmaceutical Marketing," Advertising Age and Kantar Media, October 11, 2011, at http://gaia.adage.com/images/bin/pdf/WPpharmmarketing_revise.pdf. See also Rachel Kornfield et al., "Promotion of Prescription Drugs to Consumers and Providers, 2001–2010," PLOS One, March 4, 2013, at http://journals.plos.org/plosone/article?id=10.1371/journal.pone.0055504. |
|||||
|
Elizabeth Wilner "The Side Effects of Drug Ads," Kantar U.S. Insights, June 4, 2016, at http://us.kantar.com/tech/tv/2016/ad-and-opinion-research-on-rx-drug-ads/. |
|||||
|
Ibid. According to Kantar, the number of brand-name drugs with at least $500,000 of annual advertising rose from 147 in 2012 to 215 in 2015. |
|||||
|
Helen Sullivan et al., "Prescription Drug Promotion from 2001-2014: Data from the U.S. Food and Drug Administration," PLOS One, May 5, 2016, at http://journals.plos.org/plosone/article?id=10.1371/journal.pone.0155035#pone-0155035-g002. |
|||||
|
Abby Alpert, Darius Lakdawalla, and Neeraj Sood, "Prescription Drug Advertising and Drug Utilization: The Role of Medicare Part D," National Bureau of Economic Research, Working Paper 21714, November 2015, at http://www.nber.org/papers/w21714.pdf. |
|||||
|
Government Accountability Office, "Improvements Needed in FDA's Oversight of Direct-to-Consumer Advertising," November 2006, at http://www.gao.gov/new.items/d0754.pdf. |
|||||
|
Helen Sullivan and Margaret Campbell, "Do Prescription Drug Ads Tell Consumers Enough About Benefits and Side Effects? Results from the Health Information National Trends Survey, Fourth Administration," Journal of Health Communication, vol. 20, no. 12 (2015), at http://www.tandfonline.com/doi/full/10.1080/10810730.2015.1018635?scroll=top&needAccess=true. |
|||||
|
American Medical Association, "AMA Calls for Ban on Direct to Consumer Advertising of Prescription Drugs and Medical Devices," November 17, 2015, at http://www.ama-assn.org/ama/pub/news/news/2015/2015-11-17-ban-consumer-prescription-drug-advertising.page. |
|||||
|
States News Services, "Pharmacist Association Calls for Ban on Prescription Drug Advertising," January 14, 2016. |
|||||
|
The Supreme Court has held that the Constitution affords less protection to commercial speech than other constitutionally safeguarded forms of expression. Commercial speech is "speech that proposes a commercial transaction." The Court has further noted that the combination of speech in an advertising format, which references a specific product and for which the speaker has an underlying economic motivation is "strong support" for characterizing such speech as commercial speech. |
|||||
|
H.R. 4565 (114th Congress), the Responsibility in Drug Advertising Act of 2016. |
|||||
|
FDA reviews clinical evidence before approving drugs, but other indications and concerns can arise after drugs have been on the market. A 2016 study found that prescription drug television advertising increased online searches and clicks on information for advertised drugs, but |
|||||
|
Institute of Medicine, "The Future of Drug Safety: Action Steps for Congress," September 2006, at https://www.nationalacademies.org/hmd/~/media/Files/Report%20Files/2006/The-Future-of-Drug-Safety/futureofdrugsafety_reportbrief.pdf. |
|||||
|
Ira Teinowitz, "Senate Moves Closer to Giving FDA Power to Ban Drug Ads," Advertising Age, April 19, 2007, at http://adage.com/article/news/senate-moves-closer-giving-fda-power-ban-drug-ads/116174/. In a 2011 study, CBO analyzed the potential impact of restrictions on pharmaceutical advertising. See CBO, "Potential Effects of a Ban on Direct-to-Consumer Advertising of New Prescription Drugs," May 2011, at https://www.cbo.gov/sites/default/files/112th-congress-2011-2012/reports/5-25-prescriptiondrugadvertising.pdf. |
|||||
|
S. 2623 (114th Congress), the Protecting Americans from Drug Marketing Act. |
|||||
|
CRS In Focus IF10201, The Tax Reform Act of 2014 |
|||||
|
See, in particular, FFDCA §§505 (new drugs), 501 (adulteration), and 502 (misbranding). For an easier-to-read description, see CRS Report R41983, How FDA Approves Drugs and Regulates Their Safety and Effectiveness |
|||||
|
FDA approves drugs under the authority of the FFDCA; it licenses biologics under the authority of the PHSA. Most of FDA's regulations consider drugs and biologics together and refer to the group as drugs. |
|||||
|
The law was enacted to reduce the risk of adulterated or subpotent drugs entering the United States after concern about the resale of manufacturer drug samples and other situations. |
|||||
|
FFDCA §804(l). |
|||||
|
Imported pharmaceuticals that do not meet U.S. standards are considered "unapproved" drugs and cannot be imported legally. |
|||||
|
§749, H.R. 5384, in the 109th Congress. |
|||||
|
FDA, "Information on Importation of Drugs," prepared by Marvin A. Blumberg, Division of Import Operations and Policy, Office of Regulatory Affairs, FDA, HFC-170, April 3, 1998, page last updated September 25, 2015, at http://www.fda.gov/forindustry/importprogram/ucm173751.htm. |
|||||
|
HHS Task Force on Drug Importation, Report on Prescription Drug Importation, December 2004, at http://archive.hhs.gov/importtaskforce/Report1220.pdf. |