The Every Student Succeeds Act: Accountability for Schools with Low Graduation Rates
Changes from April 7, 2017 to March 14, 2018
This page shows textual changes in the document between the two versions indicated in the dates above. Textual matter removed in the later version is indicated with red strikethrough and textual matter added in the later version is indicated with blue.
Contents
- Introduction
- Measuring the Graduation Rate
- Improving National Trends
- State Distribution
- Implications for ESSA Accountability
Figures
Tables
Appendixes
Summary
The Every Student Succeeds Act (ESSA) comprehensively reauthorized the Elementary and Secondary Education Act of 1965 (ESEA). Among other changes, the ESSA amended federal K-12 educational accountability requirements for states and local educational agencies (LEAs) receiving ESEA funds, including those regarding the identification, support, and improvement of high schools with low graduation rates.
In addition to new accountability rules, the ESSA provided the first definition of the high school graduation rate in federal education law. States and LEAs have been reporting their rates using thisthe same definition, originally laid out in 2008 regulations, since the 2010-2011 school year.
Long-standing national surveys indicate a dramatic increase in educational attainment after World War II. While the rate of increase has slowed in recent decades, the proportion of the population with at least a high school education has reached a historically high level. At the same time, notable gaps in educational attainment persist among racial and ethnic groups.
The national graduation rate for the Class of 2015 was 83.2The national graduation rate for the Class of 2016 was 84.1%—the highest rate recorded using the new ESSA methodology. The graduation rate for the Class of 2011 was 79.0%. This national-level improvement has been accompanied by improvements in nearly every state and across all reported groups of students, including all racial and ethnic subgroups, low-income students, English learners, and students with disabilities. Still, graduation rate gaps persist among several student subgroups.
At the state level, 2927 states were above the national average in 2016 and 23and 21 were below. Three states graduated fewer than 75% of their students, twelvenine states graduated 75%-79.9%, eleven states graduated 80%-84.9%, sixteenseventeen states graduated 85%-87.9%, and eightten states graduated 88% or more.
Importantly for ESSA accountability implementation, analysis of 2014-2015 school-level data reveals that as many as 16% of high schools may fail to graduate at least one-third of their students. Implementation of the accountability rule occurs in school year 2017-2018 and relies on additional criteria that would undoubtedly impact this estimate.
Introduction
The Every Student Succeeds Act (ESSA), signed into law on December 10, 2015 (P.L. 114-95), comprehensively reauthorized the Elementary and Secondary Education Act of 1965 (ESEA). Among other changes, the ESSA amended federal K-12 educational accountability requirements for states and local educational agencies (LEAs) receiving ESEA funds, including those regarding the identification, support, and improvement of high schools with low graduation rates.
Under the ESSA, states seeking Title I-A1 funds are required to submit accountability plans to the Department of Education (ED) that must address, among other things, their approaches toward dealing with low high school graduation rates. In implementing these plans, states must identify for support and improvement all public schools failing to graduate one-third or more of their students. LEAs that serve schools identified for support and improvement are required to develop a plan to improve graduation rates. If a school does not improve within a state-determined number of years, the school is subject to more rigorous state-determined actions.
The national graduation rate for the Class of 20152016 was 83.284.1%—the highest rate recorded since 2010-2011, when most states and LEAs began consistently reporting under 2008 federal guidelines.2 Improvement in the national rate has been accompanied by improvements in nearly every state and across all reported groups of students, including all racial and ethnic subgroups, low-income students, English learners, and students with disabilities. However, graduation rate gaps persist among the several student subgroups.
Moreover, the graduation rate varies enormously among individual high schools across the country, with a large number of schools doing poorly on this measure. Importantly for ESSA accountability implementation, CRS analysis of school-level data reveals that as many as 16% of high schools may fail to graduate at least one-third of their students. Thus, there are potentially thousands of high schools nationwide that may be identified for intervention in the coming years.
Implementation of the accountability rule occurs in school year 2017-2018 and relies on additional criteria that would undoubtedly impact this estimate.Measuring the Graduation Rate
In addition to new accountability rules, the ESSA provided the first definition of the high school graduation rate in federal education law.23 This was the culmination of years of effort at the national, state, and local levels to achieve national uniformity of measurement and establish statewide longitudinal data systems. Put simply, the ESSA defines the Four-Year Adjusted Cohort Graduation Rate (ACGR) as the number of students who graduate in four years with a regular high school diploma divided by the number of students who form the adjusted cohort for the graduating class.
From the beginning of 9th grade, students entering that grade for the first time form a cohort that is adjusted by adding students who subsequently transfer into the cohort and subtracting students who subsequently transfer out, emigrate to another country, or die. The following formula provides an example of how the ACGR would beis calculated for the class of 20152016:
|
Number of cohort members who earned a regular high school diploma by the end of the |
|
Number of first-time 9th graders in fall |
Improving National Trends
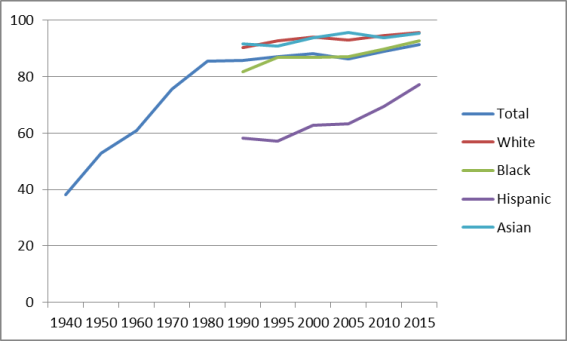
As Figure 1 shows, the rate of high school completion in the United States increased dramatically after World War II. The rate displayed in this figure is not the ACGR; rather, it represents the number of persons ages 25 to 29 whose highest level of educational attainment was at least a high school diploma (or its equivalent). It is based on responses to the Current Population Survey (CPS). After 10%-15% percentage-point increases every decade, this measure plateaued at about 85% in 1980 and stood at 9192.5% in 20152017.
Although the overall rate of high school completion has reached aan historically high level, inequities persist acrossamong racial and ethnic groups. AllIn general, these groups have made progress similar to the overall trend with one exception: Hispanics have seen a much more rapid increase in high school completion in recent years. Even with this increase, the attainment gap between whiteswhite, non-Hispanics and Hispanics remains wide—1813 percentage points in 20152017. Black attainment also continues to lag behind that of Asians and non-Hispanic whites—maintaining a roughly five percentage point gap below the latter since the early 1990s.. Black attainment also continues to lag behind that of whites, though the gap has narrowed from eight percentage points in 1990 to two percentage points in 2015.
The CPS educational attainment rate is presented here (in Figure 1) because it is useful for tracking long-term trends. It is important to note the differences between the ACGR and the CPS educational attainment rate. The CPS is a cross-sectional measure (i.e., taken at a single point in time) of those included in the survey sample. The ACGR is a longitudinal measure that tracks an entire cohort of students from entry into high school to graduation.
Another distinction between the two measures is that the CPS includes diploma equivalencies (such as the GEDGeneral Educational Development (GED) test) in its rate, while the ACGR only includes "regular" diplomas. The inclusion of equivalencies may partly explain why the CPS rate is higher than the ACGR. Additionally, the CPS rate shown in Figure 1 is for people ages 25 to 29—giving them more time to complete high school or receive a GED compared to the four years allotted to cohorts in the ACGR (Table 1). More broadly, while the ACGR is confined to those engaged in the school system, the CPS captures a wider population of persons in society, generally.
fourfive percentage points between 2011 and 20152016—a rate similar to the twothree percentage point increase in the overall CPS educational attainment rate estimate for the same time period. The ACGR shows somewhat different trends among racial/ethnic groups than the CPS. Across racial/ethnic groups, the ACGR rate among black students increased the most—nearly eight percentage points; Asian/Pacific Islander students saw the smallest increase—just over three percentage points.
|
Group |
Class of 2011 |
Class of 2012 |
Class of 2013 |
Class of 2014 |
Class of 2015 |
Change Between 2011 and 2015 Change 2011 to 2016 |
|
Total |
79.0% |
80.0% |
81.4% |
82.3% |
83.2% |
|
|
American Indian / Alaska Native |
65.0 |
67.0 |
69.7 |
69.6 |
71.6 |
71.9 6.9 |
|
Asian / Pacific Islander |
87.0 |
88.0 |
88.7 |
89.4 |
90.2 |
90.8 3.8 |
|
Hispanic |
71.0 |
73.0 |
75.2 |
76.3 |
77.8 |
6.8 8.3 |
|
Black |
67.0 |
69.0 |
70.7 |
72.5 |
74.6 |
7.6 9.4 |
|
White , non-Hispanic |
84.0 |
86.0 |
86.6 |
87.2 |
87.6 |
3.6 4.3 |
|
Low Income Students |
70.0 |
72.0 |
73.3 |
74.6 |
76.1 |
6.1 7.6 |
|
English Language Learners |
57.0 |
59.0 |
61.1 |
62.6 |
65.1 |
8.1 9.9 |
|
Students with Disabilities |
59.0 |
61.0 |
61.9 |
63.1 |
64.6 |
5.6 6.5 |
Source: U.S. Department of Education, Data Express website, http://eddataexpress.ed.gov/index.cfm.
The two high school completion measures show somewhat different trends among racial/ethnic groups. In the CPS data, the white, non-Hispanic rate increased less than 1% between 2011 and 2016, while it increased over 4% in the ACGR data. During the same period, the CPS rate for blacks increased less than 3%, while the ACGR for blacks increased over 9%. The CPS rate grew just over 1% for Asians while the ACGR grew almost 4%. Both measures had similar changes for Hispanics.
Because the ESSA accountability requirements apply to both the total student body within schools as well as specified subgroups, states must report the ACGR for several subgroups including low-income students, English language learners, students with disabilities, and various racial/ethnic categories. The data spanning 2011-2016 indicate progress among all three of these subgroups: graduation rates among low-income students increased sixmore than seven percentage points, English language learners increased eightnearly ten percentage points, and students with disabilities increased over fivesix and a half percentage points.
State Distribution
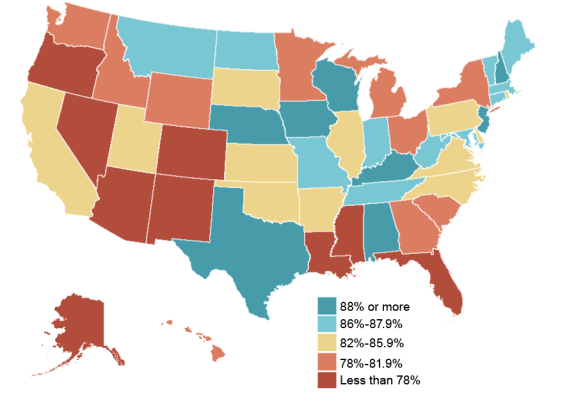
The rate of on-time high school completion varies widely across the country. For the Class of 20152016, the ACGR in 27 states was above the national average (83.2%) in 29 states84.1%) and below the national average in 2123 states. New Mexico had the lowest ACGR (6771%) and Iowa had the highest (91.3%). Figure 2 displays the ACGR for the Class of 20152016 by state. ThreeFour states graduated fewer than 7576.1% of their students, twelvenineteen states graduated 75%-79.9%, eleven76.2%-84.1%, seventeen states graduated 80%-84.9%, sixteen states graduated 8584.1%-87.97%, and eightten states graduated 8887.8% or more.
|
Figure 2. Adjusted Cohort Graduation Rates by State, Class of |
 |
|
Source: U.S. Department of Education, Data Express website, http://eddataexpress.ed.gov/index.cfm. |
As shown in Table 2, graduation rates have increased in nearly every state. The largest increaseor remained the same in every state between the graduating classes of 2011 and 20152016. The largest increase occurred in Alabama, which saw an increase from 72% (which was below the national average), to 89.387.1% (which was above the national average). FiveFour states—Alaska, Georgia, Nevada, Utah, and West Virginia—had increases of more than 10ten percentage -points. Seven states—Arizona, Ohio, Mississippi, North DakotaThree states—Indiana, South Dakota, Vermont, and Wyoming, and Vermont—saw increases of at least one percentage point. Iowa, Texas, and Nebraska maintained high graduation rates over the period, while Arizona's rate slipped from 78% to 77.4%less than one percentage point over this same period.
|
Class of 2011 |
Class of 2012 |
Class of 2013 |
Class of 2014 |
Class of 2015 |
Class of 2016 |
|
|
United States |
79% |
80% |
81.4% |
82.3% |
83.2% |
84.1% |
|
Alabama |
72 |
75 |
80.0 |
86.3 |
89.3 |
87.1 |
|
Alaska |
68 |
70 |
71.8 |
71.1 |
75.6 76.1 |
|
|
Arizona |
78 |
76 |
75.1 |
75.7 |
77.4 79.5 |
|
|
Arkansas |
81 |
84 |
84.9 |
86.9 |
84.9 |
87.0 |
|
California |
76 |
79 |
80.4 |
81.0 |
82.0 83.0 |
|
|
Colorado |
74 |
75 |
76.9 |
77.3 |
77.3 |
78.9 |
|
Connecticut |
83 |
85 |
85.5 |
87.0 |
87.2 87.4 |
|
|
Delaware |
78 |
80 |
80.4 |
87.0 |
85.6 85.5 |
|
|
Florida |
71 |
75 |
75.6 |
76.1 |
77.9 |
80.7 |
|
Georgia |
67 |
70 |
71.7 |
72.5 |
78.8 79.4 |
|
|
Hawaii |
80 |
81 |
82.4 |
81.8 |
81.6 82.7 |
|
|
Idaho |
– |
– |
– |
77.3 |
78.9 |
79.7 |
|
Illinois |
84 |
82 |
83.2 |
86.0 |
85.6 85.5 |
|
|
Indiana |
86 |
86 |
87.0 |
87.9 |
87.1 86.8 |
|
|
Iowa |
88 |
89 |
89.7 |
90.5 |
90.8 91.3 |
|
|
Kansas |
83 |
85 |
85.7 |
85.7 |
85.7 |
85.7 |
|
Kentucky |
– |
– |
86.1 |
87.5 |
88.0 88.6 |
|
|
Louisiana |
71 |
72 |
73.5 |
74.6 |
77.5 78.6 |
|
|
Maine |
84 |
85 |
86.4 |
86.5 |
87.5 87.0 |
|
|
Maryland |
83 |
84 |
85.0 |
86.4 |
87.0 87.6 |
|
|
Massachusetts |
83 |
85 |
85.0 |
86.1 |
87.3 87.5 |
|
|
Michigan |
74 |
76 |
77.0 |
78.6 |
79.8 79.7 |
|
|
Minnesota |
77 |
78 |
79.8 |
81.2 |
81.9 |
79.7 |
|
Mississippi |
75 |
75 |
75.5 |
77.6 |
75.4 82.3 |
|
|
Missouri |
81 |
84 |
85.7 |
87.3 |
87.8 89.0 |
|
|
Montana |
82 |
84 |
84.4 |
85.4 |
86.0 85.6 |
|
|
Nebraska |
86 |
88 |
88.5 |
89.7 |
88.9 |
89.3 |
|
Nevada |
62 |
63 |
70.7 |
70.0 |
71.3 73.6 |
|
|
New Hampshire |
86 |
86 |
87.3 |
88.1 |
88.1 |
88.2 |
|
New Jersey |
83 |
86 |
87.5 |
88.6 |
89.7 |
90.1 |
|
New Mexico |
63 |
70 |
70.3 |
68.5 |
68.6 71.0 |
|
|
New York |
77 |
77 |
76.8 |
77.8 |
79.2 80.4 |
|
|
North Carolina |
78 |
80 |
82.5 |
83.9 |
85.6 85.9 |
|
|
North Dakota |
86 |
87 |
87.5 |
87.2 |
86.6 87.5 |
|
|
Ohio |
80 |
81 |
82.2 |
81.8 |
80.7 83.5 |
|
|
Oklahoma |
– |
– |
84.8 |
82.7 |
82.5 81.6 |
|
|
Oregon |
68 |
68 |
68.7 |
72.0 |
73.8 74.8 |
|
|
Pennsylvania |
83 |
84 |
85.5 |
85.3 |
84.8 86.1 |
|
|
Rhode Island |
77 |
77 |
79.7 |
80.8 |
83.2 82.8 |
|
|
South Carolina |
74 |
75 |
77.6 |
80.1 |
80.3 82.6 |
|
|
South Dakota |
83 |
83 |
82.7 |
82.7 |
83.9 |
83.9 |
|
Tennessee |
86 |
87 |
86.3 |
87.2 |
87.9 88.5 |
|
|
Texas |
86 |
88 |
88.0 |
88.3 |
89.0 |
89.1 |
|
Utah |
76 |
80 |
83.0 |
83.9 |
84.8 85.2 |
|
|
Vermont |
87 |
88 |
86.6 |
87.8 |
87.7 |
87.7 |
|
Virginia |
82 |
83 |
84.5 |
85.3 |
85.7 86.7 |
|
|
Washington |
76 |
77 |
76.4 |
78.2 |
78.2 |
79.7 |
|
West Virginia |
78 |
79 |
81.4 |
84.5 |
86.5 89.8 |
|
|
Wisconsin |
87 |
88 |
88.0 |
88.6 |
88.4 88.2 |
|
|
Wyoming |
80 |
79 |
77.0 |
78.6 |
79.3 |
80.0 |
Source: U.S. Department of Education, Data Express website http://eddataexpress.ed.gov/index.cfm.
Notes: "–" = not available. Data for the classes of 2011 and 2012 were reported in whole numbers only.
Implications for ESSA Accountability
ESSA provisions require that, beginning with the 2017-2018 school year, each state must use the ACGR as an indicator in their accountability systems and in calculating long-term and interim goals.34
Analysis of school-level data for the Class of 2015 reveals 2,512 high schools—16% of schools nationwide—had an ACGR of less than 70% (Table 3). ([Note that, due to privacy protections imposed on publically available data, this analysis uses 70% (instead of 66.7%) as the cutoff for schools to be identified for intervention.45 These limitations only apply to published data; states would not face such constraints as they have access to the complete data of actual rates reported for every school.)] Because this analysis uses 70% instead of 66.7%, it likely overestimates the number of schools that may be identified for intervention due to low graduation rates. This analysis may further overestimate the number of schools that may be identified for intervention because the accountability provisions do not take effect until the 2017-2018 school year and graduation rates have been improving.
Even with these caveats, this analysis suggests that there are potentially thousands of high schools that may be identified for improvement due to failure to graduate more than one-third of their students. Whether or not these schools would be uniquely identified for intervention based upon graduation rates (or identified for other reasons as well) is unknown. That is, it is unclear how much overlap may exist among schools identified under category two and the other two categoriesby graduation rate and those identified for other reasons (i.e., the lowest-performing 5% of Title I schools and those with chronically underperforming subgroups). Nonetheless, the number of schools identified as being in need of comprehensive support for this reason may be large in some states.
|
High Schools |
|
|
U.S. Total |
18,213 |
|
Data Suppressed for Privacy Protectiona |
2,851 |
|
Data Reported Without Suppression |
15,362 |
|
ACGR less than 70% |
2,512 |
|
Percentage of Reported |
16% |
Source: CRS calculations using data from the U.S. Department of Education EDFacts data files available at http://www2.ed.gov/about/inits/ed/edfacts/data-files/index.html#acgr.
Notes: For analysis presented in this report, an ACGR of 70% (instead of 66.7%) was used as the cutoff for schools that may be identified, due to limitations in the published data.
a.
Department of Education data suppression techniques were applied to schools with small enrollments to protect student privacy. These actions prevented the reporting of data for certain schools. More information on these issues is available in the Appendix.
Appendix. ACGR Technical Notes
The Department of Education (ED) collects the ACGRAdjusted Cohort Graduation Rate (ACGR) from states through its EDFacts Initiative.56 These data are made public on ED's website. Disclosure avoidance techniques are applied to comply with privacy protections required by the Family Educational Rights and Privacy Act.67 These steps result in complete suppression of the ACGR for schools with cohorts of fewer than 6 students, reporting of ACGR ranges for cohorts between 6 and 200 students, and reporting of exact rates for cohorts of over 200 students. The widths of the ACGR ranges are determined by cohort size and get progressively wider as a cohort size decreases. The actual ACGR reported by states lies somewhere within the published range. ACGR ranges reported by EDFacts are shown in Table A-1.
|
Cohort Size |
ACGR Reported in EDFacts Data File |
|
1-5 |
Reported as "PS" |
|
6-15 |
<50%, ≥50% |
|
16-30 |
≤20%, 21%-39%, 40%-59%, 60%-79%, ≥80% |
|
31-60 |
≤10%, 11%-19%, 20%-29%, 30%-39%, 40%-49%, 50%-59%, 60%-69%, 70%-79%, 80%-89%, ≥90% |
|
61-200 |
≤5%, 6%-9%, 10%-14%, 15%-19%, 20%-24%, 24%-29%, 30%-34%, 35%-39%, 40%-44%, 45%-49%, 50%-54%, 55%-59%, 60%-64%, 65%-69%, 70%-74%, 75%-79%, 80%-84%, 85%-89%, 90%-94%, ≥95% |
|
201+ (301+ for subgroups) |
≤1%, [whole number percentages] 2%, 3%, ... , 98%, ≥99% |
Source: Regulatory Four Year Adjusted-Cohort Graduation Rates – School Year 2014-15, EDFacts Data Documentation, U.S. Department of Education, http://www2.ed.gov/about/inits/ed/edfacts/data-files/acgr-sy14-15-public-file-documentation.doc.
a. In school districts with only two schools where one school has a very small student population (n≤ 6) and the second school has a student population between 200 and 300 students, the department has implemented an additional routine that removes whole number reporting in the larger school within this subset of two-school districts. As a result, the reported graduation rate for the larger school is not a whole number percentage but instead is presented as a standard five percentage point range (i.e., 50-54% instead of 52%).
Author Contact Information
Acknowledgments
Jim Uzel provided GIS support for this report.
Kenneth Fassel assisted with updating this report.
Footnotes
| 1. |
Title I-A is the ESEA's largest grant program, distributing more than $ |
|
| 2. |
Moriah Balingit, "U.S. high school graduation rates rise to new high," Washington Post, December 4, 2017, https://www.washingtonpost.com/news/education/wp/2017/12/04/u-s-high-school-graduation-rates-rise-to-new-high/?utm_term=.98175e626019.
|
|
|
ESSA regulations issued by the Obama Administration would have also required states to use the ACGR to identify schools in need of comprehensive support and improvement. However, President Trump signed legislation (S.J.Res. 25) to nullify this requirement. |
||
|
ED uses data suppression techniques to protect student privacy in schools with small enrollments. In some cases, these actions constrained the analysis because data were reported as a range rather than a number (e.g., 65%-70% instead of 67.5%). In other cases, these privacy protections prevented the reporting of any data for a given school. Out of a total of 18,213 high schools in the ACGR dataset, 2,851 schools could not be analyzed due to these limitations. More information on the limitations is available in the Appendix. |
||
|
More information on EDFacts may be found at http://www2.ed.gov/about/inits/ed/edfacts/index.html . |
||
|
20 U.S.C. §1232g; 34 C.F.R. Part 99. |