Medicaid Disproportionate Share Hospital Payments
Changes from June 17, 2016 to November 14, 2019
This page shows textual changes in the document between the two versions indicated in the dates above. Textual matter removed in the later version is indicated with red strikethrough and textual matter added in the later version is indicated with blue.
Contents
- Introduction
- Background: Medicaid DSH
- States Slow to Implement DSH Programs
- Sharp Increase in DSH Expenditures
- Limits on DSH Payments
- DSH Allotments
- Exceptions for Certain States
- Low DSH States
- Hawaii and Tennessee
- Limits on DSH Expenditures
- States' DSH Allotments
- Exceptions for Certain States
- DSH Allotment Reductions
- DSH Payments
- Defining DSH Hospitals
- Calculating DSH Payments
- The Definition of Uninsured
- Definition of Uninsured
- Definition of Medicaid Shortfall
- Institutions for Mental Disease DSH Limits
- DSH Expenditures
- State Variation
- DSH as a Percentage of Total Medical Assistance Expenditures
- Hospital Versus IMD
- State Reporting and Auditing Requirements
- Conclusion
Figures
- Figure 1. Total Medicaid DSH Expenditures, FY1990-
FY2015FY2018
- Figure 2. Total DSH Expenditures as a Percentage of Total Medicaid Medical Assistance Expenditures
- Figure 3. States' Share of Total Medicaid DSH Expenditures
- Figure 4. Total State DSH Expenditures as a Percentage of Total Medicaid Medical Assistance Expenditures
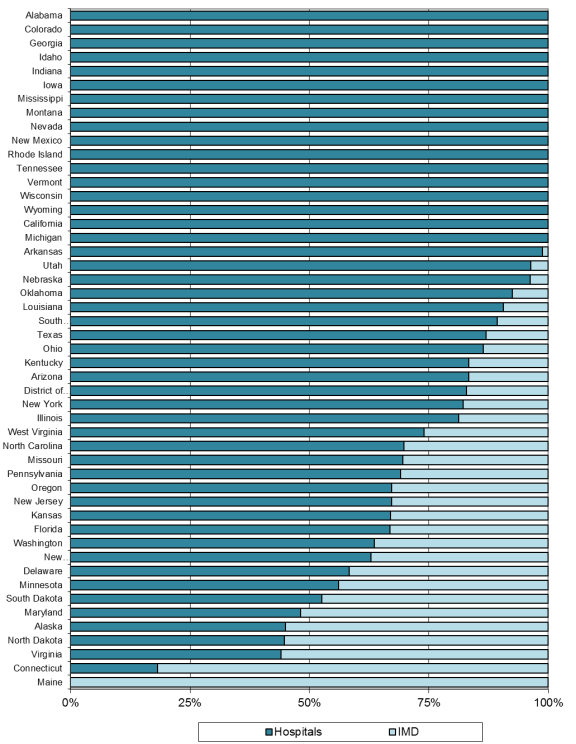
- Figure 5. Proportion of State DSH Expenditures Allocated to Hospitals and IMDs
Tables
- Table 1. Total DSH Expenditures and Total DSH Expenditures as a Percentage of Total Medicaid Medical Assistance Expenditures
- Table 2. DSH Allotments for
FY2012FY2017 Through FY2019Through FY2015 - Table 3. Federal DSH Funding Available to Tennessee and Hawaii
- Table B-1. States' IMD DSH Limits
- Table C-1. DSH Expenditures by Type and DSH Expenditures as a Percentage of Medical Assistance Expenditures , FY2018
Summary
The Medicaid statute requires states to make disproportionate share hospital (DSH) payments to hospitals treating large numbers of low-income patients. This provision is intended to recognize the disadvantaged financial situation of those hospitals because low-income patients are more likely to be uninsured or Medicaid enrollees. Hospitals often do not receive payment for services rendered to uninsured patients, and Medicaid provider payment rates are generally lower than the rates paid by Medicare and private insurance.
As with most Medicaid expenditures, the federal government reimburses states for a portion of their Medicaid DSH expenditures based on each state's federal medical assistance percentage (FMAP). While most federal Medicaid funding is provided on an open-ended basis, federal Medicaid DSH funding is capped. Each state receives an annual DSH allotment, which is the maximum amount of federal matching funds that each state is permitted to claim for Medicaid DSH payments. In FY2015FY2019, federal DSH allotments totaled $11.912.6 billion.
Built on the premise that the Patient Protection and Affordable Care Act (ACA; P.L. 111-148, as amended) insurance coverage provisions (including the ACA Medicaid expansion) would reduce the number of uninsured individuals, the ACA included a provision directing the Secretary of the Department of Health and Human Services (HHS) to make aggregate reductions in federal Medicaid DSH allotments for each year from FY2014 to FY2020. Since the initial enactment of the ACA, sevenACA, five laws have amended the DSH reductions. Under current law, the Medicaid DSH reductions are to be in effect for FY2018FY2020 through FY2025.
Although states must follow some federal requirements in defining DSH hospitals and calculating DSH payments, for the most part, states are provided significant flexibility. One way the federal government restricts states' Medicaid DSH payments is that the federal statute limits the amount of DSH payments forto institutions for mental disease and other mental health facilities.
Since Medicaid DSH allotments were implemented in FY1993, total Medicaid DSH expenditures (i.e., including federal and state expenditures) have remained relatively stable. Over this same period of time, total Medicaid DSH expenditures as a percentage of total Medicaid medical assistance expenditures (i.e., including both federal and state expenditures but excluding expenditures for administrative activities) dropped from 13% to 4%.
This report provides an overview of Medicaid DSH. It includes a description of the rules delineating how state DSH allotments are calculated and the exceptions to the rules, how DSH hospitals are defined, and how DSH payments are calculated. The DSH expenditures section shows the trends in DSH spending and explains variation in states' DSH expenditures. Finally, the basic requirements for state DSH reports and independently certified audits are also outlined.
The future of Medicaid DSH payments is uncertain, because Congress may decide to change the DSH reductions again or amend the distribution of federal Medicaid DSH funding among states. Congress could amend the Medicaid DSH reductions in the same way the reductions have been amended in the past, which includes eliminating the reductions for FY2014 through FY2019, changing the reduction amounts, and extending the reductions through FY2025.
In March 2019, the Medicaid and CHIP Payment and Access Commission (MACPAC) made a recommendation to Congress for restructuring the methodology for allocating Medicaid DSH reductions to states. In June 2019, the House Energy and Commerce Committee's Subcommittee on Health held a hearing on a number of health care bills, including the Patient Access Protection Act (H.R. 3022), that would repeal the Medicaid DSH reductions.
In 2019, there has been some discussion of amending the allocation of Medicaid DSH allotment funding among the states. In 2019, the State Accountability, Flexibility, and Equity (SAFE) for Hospitals Act (S. 18 and H.R. 3613) was introduced, which would change the methodology for allocating federal Medicaid DSH funding among the states, among other things. In addition, it has been reported that Senate Finance Chairman Grassley is considering options to amend the distribution of federal Medicaid DSH funding among states.
Introduction
Medicaid is a federal-state program providing medical assistance for low-income individuals.1 Historically, Medicaid eligibility has generally been limited to low-income children, pregnant women, parents of dependent children, the elderly, and individuals with disabilities. However, the Patient Protection and Affordable Care Act (ACA; P.L. 111-148, as amended) included the ACA Medicaid expansion, which expands Medicaid eligibility to individuals under the age of 65 with income up to 133% of the federal poverty level (FPL; effectively 138% of FPL) at state optionsince 2014, states have had the option to cover nonelderly adults with income up to 133% of the federal poverty level under the Patient Protection and Affordable Care Act (ACA; P.L. 111-148, as amended) Medicaid expansion.
Participation in Medicaid is voluntary for states, though all states, the District of Columbia, and territories2 choose to participate. In order to2 To participate in Medicaid, the federal government requires states to cover certain mandatory populations and benefits, but the federal government also allows states to cover optional populations and services. Due to this flexibility, there is substantial variation among the states in terms of factors such as Medicaid eligibility, covered benefits, and provider payment rates.
Medicaid is jointly financed by the federal government and the states. States incur Medicaid costs by making payments to service providers (e.g., for doctor visits) and performing administrative activities (e.g., making eligibility determinations), and the federal government reimburses states for a share of these costs.3 The federal government's share of a state's expenditures for most Medicaid services is called the federal medical assistance percentage (FMAP).4 The FMAP varies by state and is inversely related to each state's per capita income. For FY2016FY2019, FMAP rates range from 50% (1314 states) to 7476% (Mississippi).
The Medicaid statute requires that states make disproportionate share hospital (DSH) payments to hospitals treating large numbers of low-income patients.5For the most part, states establish their own payment rates for services rendered by Medicaid providers. Low Medicaid provider payment rates in many states and their impact on provider participation have been perennial policy concerns. Some states rely on supplemental payments to offset low Medicaid payments for services or to support safety-net providers. Supplemental payments are Medicaid payments to providers that are separate from and in addition to the payments for services rendered to Medicaid enrollees.5 Medicaid disproportionate share hospital (DSH) payments are the only type of supplemental payments that are mandatory for states.
The Medicaid statute requires that states make DSH payments to hospitals treating large numbers of low-income patients.6 This provision is intended to recognize the disadvantaged financial situation of such hospitals because low-income patients are more likely to be uninsured or Medicaid enrollees. Hospitals often do not receive payment for services rendered to uninsured patients, and Medicaid provider payment rates are generally lower than the rates paid by Medicare and private insurance.
While most federal Medicaid funding is provided on an open-ended basis, federal Medicaid DSH funding is capped. Each state receives an annual federal DSH allotment, which is the maximum amount of federal matching funds that each state can claim for Medicaid DSH payments. In FY2015, the FY2019, the preliminary federal DSH allotments to states totaled $11.912.6 billion.
This report provides an overview of Medicaid DSH, including how state DSH allotments are calculated and the exceptions to the DSH allotments calculation; how DSH hospitals are defined and how DSH payments to hospitals are calculated; trends in DSH spending; variation in states' DSH expenditures; and requirements outlining the basic requirements for state DSH reports and independently certified audits.
Background: Medicaid DSH
Medicaid DSH payments were established in the Omnibus Budget Reconciliation Act of 1981 (OBRA 1981; P.L. 97-35) when the methodology for Medicaid payment rates to hospitals was amended.67 Prior to OBRA 1981, state Medicaid programs were required to reimburse hospitals on a reasonable cost basis (as defined under Medicare) unless the state had approval to use an alternate payment method.78 This law deleted the reasonable cost methodology and transferred the responsibility for determining Medicaid payment rates to the states.
A new provision required Medicaid hospital payment rates to take into account the situation of hospitals that serve a disproportionate number of "low income patients with special needs."89 This requirement established the Medicaid DSH payments.
The inclusion of this Medicaid DSH provision in OBRA 1981 recognized that hospitals serving a disproportionate share of low income patients are particularly dependent on Medicaid payments because low income patients are mostly Medicaid enrollees and uninsured individuals.910 Hospitals often do not receive payment for services rendered to uninsured patients, and Medicaid provider payment rates are generally lower than the rates paid by Medicare and private insurance.
States Slow to Implement DSH Programs
While the requirement to make DSH payments was originally established in 1981, many states did not make DSH payments throughout the 1980s. As a result, other federal laws were enacted with provisions aimed at getting states to make DSH payments. For instance, a provision in the Omnibus Budget Reconciliation Act of 1986 (P.L. 99-509) was aimed at supporting state flexibility to make DSH payments. Also, the Omnibus Budget Reconciliation Act of 1987 (P.L. 100-203) required states to submit a Medicaid state plan amendment10 describing their DSH policies and establishing certain minimum qualifying standards and payments.
Sharp Increase in DSH Expenditures
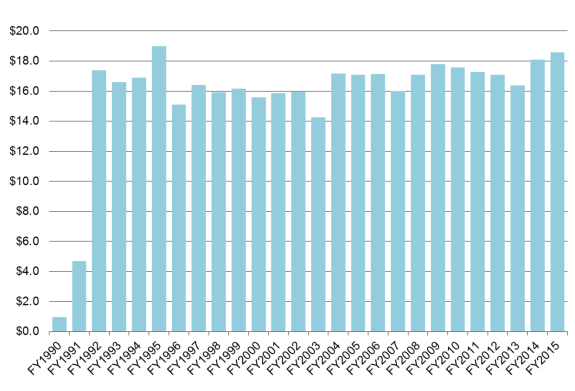
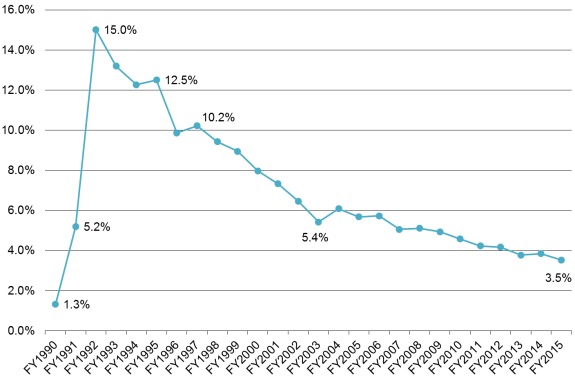
DSH payments quickly became a significant portion of Medicaid spending in the early 1990s. DSH expenditures (including federal and state expenditures) grew from $1.0 billion in FY1990 to $17.4 billion in FY1992. As a percent of total Medicaid medical assistance expenditures (i.e., including federal and state spending and excluding expenditures for administrative activities), DSH expenditures grew from 1.3% of total Medicaid medical assistance expenditures in FY1990 to 15.0% in FY1992 (see Table 1).
Table 1. Total DSH Expenditures and Total DSH Expenditures as a Percentage of Total Medicaid Medical Assistance Expenditures
(FY1990 to FY1992
)|
DSH Expenditures |
|
DSH Expenditures as a % of Medical Assistance Expenditures |
|
|
FY1990 |
$1.0 |
— |
1.3% |
|
FY1991 |
$4.7 |
370.0% |
5.2% |
|
FY1992 |
$17.4 |
270.2% |
15.0% |
Source: Payments estimated by the Urban Institute.
Notes: Total DSH expenditures include both federal and state spending on DSH payments. Total Medicaid medical assistance expenditures include federal and state spending and exclude Medicaid spending on administrative activities.
DSH = Disproportionate share hospital.
The significant increase in DSH expenditures was not attributed to the laws enacted by Congress. Instead, the growth in Medicaid expenditures coincided with states' increased use of provider taxes and donations to help finance the state share of Medicaid expenditures.1112 DSH payments were a popular mechanism for returning provider taxes or donations to hospitals. Medicaid payments for regular inpatient rates were subject to federal upper payment limits, but DSH payments were uncapped and did not need to be tied to specific Medicaid enrollees or services. As a result, states could increase DSH payments by any amount, tax away the state share of the increased DSH payments through provider taxes, and thus draw down unlimited federal funds.
Limits on DSH Payments
This dramatic growth in DSH expenditures again prompted congressional action. The Medicaid Voluntary Contribution and Provider-Specific Tax Amendments of 1991 (P.L. 102-234) established ceilings on federal Medicaid DSH funding for each state.1213 Since FY1993, each state has had its own DSH limit, which is referred to as a "DSH allotment.."
DSH Allotments
While most federal Medicaid funding is provided on an open-ended basis, certain types of federal Medicaid funding, such as federal DSH funding, are capped. Each state13 receives an annual DSH allotment,14 which is the maximum amount of federal matching funds a state is permitted to claim for Medicaid DSH payments.14
The original state DSH allotments provided in FY1993 were based on each state's FY1992 DSH payments. In FY1992, some states provided relatively more DSH payments to hospitals, and, as a result, these states locked in relatively higher Medicaid DSH allotments. Other states made relatively fewer DSH payments, and these states locked in relatively lower DSH allotments.
This disparity still remains to some extent in current DSH allotments because DSH allotments are not distributed according to a formula based on the number of DSH hospitals in a state or the amount of hospital services these hospitals provide to low-income patients. However, over time, the disparity in DSH allotments was reduced by providing larger annual increases to DSH allotments for states that initially made fewer DSH payments and limiting the growth of DSH allotments for states that initially provided relatively more DSH payments.
The methodology for calculating states' annual DSH allotments has changed a number of times over the years. A history of the DSH allotment calculations is provided in Appendix A.
Currently, states' Medicaid DSH allotments are based on each state's prior year DSH allotment. Specifically, a state's DSH allotment is the higher of (1) a state's FY2004 DSH allotment15 or (2) the prior year's DSH allotment increased by the percentage change in the consumer price index for all urban consumers (CPI-U) for the prior fiscal year. Louisiana had been the only state that continued to receive its FY2004 DSH allotment; however, FY2015 was the first year for which Louisiana will16 All states (with the exception of Tennessee) receive a Medicaid DSH allotment based on the prior year's DSH allotment increased by the percentage change in CPI-U.16
Each state's allotment can be no more than the greater of the prior year's allotment or 12% of its total Medicaid medical assistance expenditures (i.e., including federal and state spending and excluding expenditures for administrative activities) during the fiscal year.1718 This rule is referred to as the "12% limit."1819 This means the federal share of DSH expenditures cannot be more than 12% of each state's total Medicaid medical assistance expenditures.
In addition to the state-specific 12% limit, there is a national DSH target. Federal regulations specify that aggregate DSH payments, including federal and state expenditures for all states, should not be more than 12% of the total amount of Medicaid medical assistance expenditures for all 50 states and the District of Columbia.1920 This national limittarget is not an absolute cap but a target.2021 The national DSH payment limittarget is different from the 12% limit on state DSH allotments because the 12% national payment limittarget restricts both federal and state spending while the 12% limit for allotments caps only federal spending.
Due to the state-specific 12% limit for state DSH allotments, the Centers for Medicare & Medicaid Services (CMS) must publish preliminary DSH allotments before the start of the fiscal year based on estimated Medicaid expenditures. Then, after the fiscal year has ended, CMS uses actual expenditure data to calculate final DSH allotments.
CMS calculates annual allotments and publishes them in the Federal Register. The most recent Federal Register notice included final DSH allotments for FY2013FY2017 and preliminary DSH allotments for FY2015.21FY2019.22 The federal DSH allotments for FY2012FY2017 through FY2015FY2019 are shown in Table 2.
|
State |
FY2012 | FY2013 |
FY2014 |
FY2015 |
|
DSH Allotment |
DSH Allotment |
Preliminary DSH Allotment |
Preliminary DSH Allotment |
|
|
Alabama |
$315.5 |
$323.1 |
$327.9 |
$333.2 |
|
20.9 |
21.4 |
21.7 |
22.1 |
|
Arizona |
103.9 |
106.4 |
108.0 |
109.7 |
|
44.3 |
45.3 |
46.0 |
46.7 |
|
California |
1,124.8 |
1,151.8 |
1,169.1 |
1,187.8 |
|
Colorado |
94.9 |
97.2 |
98.6 |
100.2 |
|
Connecticut |
205.2 |
210.1 |
213.3 |
216.7 |
|
9.3 |
9.5 |
9.7 |
9.8 |
|
District of Columbia |
62.8 |
64.4 |
65.3 |
66.4 |
|
Florida |
205.2 |
210.1 |
213.3 |
216.7 |
|
Georgia |
275.8 |
282.4 |
286.6 |
291.2 |
|
10.0 |
10.2 |
10.4 |
10.6 |
|
16.9 |
17.3 |
17.5 |
17.8 |
|
Illinois |
220.6 |
225.9 |
229.3 |
233.0 |
|
Indiana |
219.3 |
224.6 |
228.0 |
231.6 |
|
40.4 |
41.4 |
42.0 |
42.7 |
|
Kansas |
42.3 |
43.3 |
44.0 |
44.7 |
|
Kentucky |
148.8 |
152.4 |
154.6 |
157.1 |
|
Louisiana |
732.0 |
732.0 |
732.0 |
743.7 |
|
Maine |
107.7 |
110.3 |
112.0 |
113.8 |
|
Maryland |
78.2 |
80.1 |
81.3 |
82.6 |
|
Massachusetts |
313.0 |
320.5 |
325.3 |
330.5 |
|
Michigan |
271.9 |
278.4 |
282.6 |
287.1 |
|
76.6 |
78.5 |
79.7 |
80.9 |
|
Mississippi |
156.5 |
160.2 |
162.6 |
165.2 |
|
Missouri |
486.1 |
497.8 |
505.2 |
513.3 |
|
11.6 |
11.9 |
12.1 |
12.3 |
|
29.0 |
29.7 |
30.2 |
30.7 |
|
Nevada |
47.5 |
48.6 |
49.3 |
50.1 |
|
New Hampshire |
164.3 |
168.2 |
170.7 |
173.5 |
|
New Jersey |
660.5 |
676.4 |
686.5 |
697.5 |
|
20.9 |
21.4 |
21.7 |
22.1 |
|
New York |
1,648.1 |
1,687.7 |
1,713.0 |
1,740.4 |
|
North Carolina |
302.7 |
310.0 |
314.6 |
319.6 |
|
9.8 |
10.0 |
10.2 |
10.3 |
|
Ohio |
416.8 |
426.9 |
433.3 |
440.2 |
|
37.2 |
38.0 |
38.6 |
39.2 |
|
46.4 |
47.6 |
48.3 |
49.0 |
|
Pennsylvania |
575.9 |
589.7 |
598.6 |
608.1 |
|
Rhode Island |
66.7 |
68.3 |
69.3 |
70.4 |
|
South Carolina |
336.0 |
344.1 |
349.3 |
354.9 |
|
11.3 |
11.6 |
11.8 |
12.0 |
|
123.6 |
53.1 |
0.0 |
53.1 |
|
Texas |
981.2 |
1,004.7 |
1,019.8 |
1,036.1 |
|
20.1 |
20.6 |
20.9 |
21.3 |
|
Vermont |
23.1 |
23.6 |
24.0 |
24.4 |
|
Virginia |
89.9 |
92.1 |
93.4 |
94.9 |
|
Washington |
189.8 |
194.4 |
197.3 |
200.5 |
|
West Virginia |
69.3 |
70.9 |
72.0 |
73.1 |
|
97.0 |
99.3 |
100.8 |
102.4 |
|
0.2 |
0.2 |
0.2 |
0.2 |
|
Total (in billions of dollars) |
$11,362.1 |
$11,543.8 |
$11,652.0 |
$11,891.6 |
Sources: Department of Health and Human Services (HHS), "Medicaid Program: Disproportionate Share Hospital Allotments and Institutions for Mental Diseases Disproportionate Share Hospital Limits for FY2012, and Preliminary FY2013 Disproportionate Share Hospital Allotments and Limits," 78 Federal Register 45217, July 26, 2013; HHS, "Medicaid Program; Preliminary Disproportionate Share Hospital Allotments (DSH) for Fiscal Year (FY) 2014 and the Preliminary Institutions for Mental Disease Disproportionate Share Hospital Limits for FY 2014," 79 Federal Register 11436, February 28, 2014; HHS, "Medicaid Program; Final FY 2013 and Preliminary FY 2015 Disproportionate Share Hospital Allotments, and Final FY 2013 and Preliminary FY 2015 Institutions for Mental Diseases Disproportionate Share Hospital Limits," 81 Federal Register 5448, February 2, 2016.
Notes: DSH allotments are different from DSH payments. Allotments reflect the maximum amount of federal DSH funding available to states, and DSH payments are the amounts paid to hospitals.
a. These states are low DSH states. In the past, low DSH states received higher annual percentage increases to their DSH allotments than the non-low DSH states. Currently, low DSH and other states receive the same annual percentage increases to their DSH allotments.
b. Hawaii has a special statutory arrangement that specifies the DSH allotment for the state. Beginning in FY2013, Hawaii's DSH allotment is determined the same way the DSH allotments are determined for low DSH states.
c. Tennessee has a special statutory arrangement that specifies the DSH allotment for the state. The statute limited Tennessee's Medicaid DSH payments to $91.6 million in FY2011, $70.1 million in FY2012, and $53.1 million in FY2013. After FY2013, the statute did not provide a federal DSH allotment to Tennessee until the Medicare Access and CHIP Reauthorization Act of 2015 (P.L. 114-10) provided a Medicaid DSH allotment to Tennessee in the amount of $53.1 million for each fiscal year from FY2015 through FY2025.
Exceptions for Certain States
While most states' DSH allotments are determined as described above, the DSH allotments for some states are determined by an alternative method. In the past, low DSH states received higher annual percentage increases to their DSH allotments, but currently low DSH states receive the same annual percentage increases to DSH allotments as other states. Also, Hawaii and Tennessee have special statutory arrangements for the determination of their respective DSH allotments.
Low DSH States
Special rules for low DSH states were initially established by the Medicare, Medicaid, and SCHIP Benefits Improvement and Protection Act of 2000 (BIPA; incorporated into the Consolidated Appropriations Act of 2001, P.L. 106-554). 22 Subsequently, the Medicare Prescription Drug, Improvement, and Modernization Act of 2003 (MMA; P.L. 108-173) amended the definition of low DSH state, and this definition continues to apply today.
Under the MMA definition, a low DSH state is defined as a state with FY2000 DSH expenditures greater than 0% but less than 3% of its total Medicaid medical assistance expenditures (i.e., including federal and state expenditures and excluding expenditures for administrative activities) for FY2000. States determined to be low DSH states in FY2004 continue to be low DSH states regardless of their DSH expenditures in years after FY2000.
States designated as low DSH states were provided greater annual increases to their DSH allotments in order to remove some of the inequities from the initial FY1993 state DSH allotments, which were based on states' DSH expenditures in FY1992. However, increasing DSH allotments does not necessarily mean states will increase their DSH payments. The increased DSH allotments provide states with access to additional federal DSH funding if the states choose to use it.
Sixteen states qualified as low DSH states under the MMA definition, and they continue to be defined as low DSH states. These states are Alaska, Arkansas, Delaware, Idaho, Iowa, Minnesota, Montana, Nebraska, New Mexico, North Dakota, Oklahoma, Oregon, South Dakota, Utah, Wisconsin, and Wyoming.
Each year, from FY2004 through FY2008, low DSH states received a 16% increase to their DSH allotments to increase their DSH allotments relative to other states.23
For FY2009 and subsequent years, low DSH states receive DSH allotments equal to the prior year's allotment increased by the percent change in CPI-U for the previous fiscal year, which is the same adjustment that non-low DSH states receive.
Hawaii and Tennessee
Tennessee and Hawaii operate their state Medicaid programs under Section 1115 research and demonstration waivers,24 which allow the Secretary of Health and Human Services (HHS) to waive various provisions of Medicaid law. Both states received waivers from making Medicaid DSH payments (among other things), and these states did not receive DSH allotments from FY1998 to FY2006. However, since FY2007, these two states received DSH allotments by special statutory authority provided through multiple laws.25 Table 3 shows the federal DSH funding available to Hawaii and Tennessee from FY2007 to FY2015.
Hawaii
Hawaii's DSH allotment was set at $10 million for each of FY2007 through FY2011. Under the ACA, Hawaii's FY2012 DSH allotment was also set at $10.0 million, but the allotment was split into two periods. For the first quarter of FY2012 (i.e., October 1, 2011, to December 31, 2011), Hawaii's DSH allotment was $2.5 million. Then, for the remaining three quarters of FY2012, Hawaii's DSH allotment was $7.5 million.
For FY2013 and subsequent years, Hawaii's annual DSH allotment will increase in the same manner applicable to low DSH states. Currently, all states, including low DSH states, receive DSH allotments equal to the prior year's allotment increased by the percent change in CPI-U for the previous fiscal year.
Tennessee
The federal statute specified that Tennessee's DSH allotment for each year from FY2007 to FY2011 was the greater of $280.0 million or the federal share of the DSH payments reflected in TennCare26 for the demonstration year ending in 2006. In accordance with this provision, Tennessee's DSH allotment was $305.4 million (i.e., the federal share of the DSH payments reflected in TennCare for the demonstration year ending in 2006) from FY2007 to FY2011. The statute further limited the amount of federal funds available to Tennessee for DSH payments to 30% of Tennessee's DSH allotment. Under this limit, the federal DSH funding available to Tennessee for each year from FY2007 to FY2011 was $91.6 million (i.e., 30% of $305.4 million).
For the first quarter of FY2012 (i.e., October 1, 2011, through December 31, 2011), Tennessee's DSH allotment was $76.4 million27 and was subject to the 30% limit. For the last three fiscal quarters of FY2012, Tennessee received a DSH allotment of $47.2 million that was not subject to the 30% limit. In total, Tennessee had access to $70.1 million28 in federal DSH funding in FY2012.
Preliminary DSH Allotment Alabama
Arizona
California
Colorado
Connecticut
District of Columbia
Florida
Georgia
Illinois
Indiana
Kansas
Kentucky
Louisiana
Maine
Maryland
Massachusetts
Michigan
Mississippi
Missouri
Nevada
New Hampshire
New Jersey
New York
North Carolina
Ohio
Pennsylvania
Rhode Island
South Carolina
Texas
Vermont
Virginia
Washington
West Virginia
Total (in millions of dollars)
Sources: Department of Health and Human Services (HHS), Centers for Medicare & Medicaid Services (CMS), "Medicaid Program; Final FY 2016 and Preliminary FY 2018 Disproportionate Share Hospital Allotments, and Final FY 2016 and Preliminary FY 2018 Institutions for Mental Diseases Disproportionate Share Hospital Limits," 83 Federal Register 31536, July 6, 2018; HHS, CMS, "Medicaid Program; Final FY 2017 and Preliminary FY 2019 Disproportionate Share Hospital Allotments, and Final FY 2017 and Preliminary FY 2019 Institutions for Mental Diseases Disproportionate Share Hospital Limits," 84 Federal Register 3169, February 11, 2019. Notes: DSH allotments are different from DSH payments. Allotments reflect the maximum amount of federal DSH funding available to states, and DSH payments are the amounts paid to hospitals. While most states' DSH allotments are determined as described above, the DSH allotments for some states are determined by an alternative method. In the past, low DSH states received higher annual percentage increases to their DSH allotments, but currently low DSH states receive the same annual percentage increases to DSH allotments as other states. (See the textbox for more information about low DSH states.) Low DSH States Special rules for low DSH states were initially established by the Medicare, Medicaid, and SCHIP Benefits Improvement and Protection Act of 2000 (BIPA; incorporated into the Consolidated Appropriations Act, 2001, P.L. 106-554).23 Subsequently, the Medicare Prescription Drug, Improvement, and Modernization Act of 2003 (MMA; P.L. 108-173) amended the definition of low DSH state, and this definition continues to apply today. A low DSH state is defined as a state with FY2000 DSH expenditures greater than 0% but less than 3% of its total Medicaid medical assistance expenditures for FY2000. States determined to be low DSH states in FY2004 continue to be low DSH states regardless of their DSH expenditures in years after FY2000. States designated as low DSH states were provided greater annual increases to their DSH allotments to remove some of the inequities from the initial FY1993 state DSH allotments. However, increasing DSH allotments does not necessarily mean states will increase their DSH payments. The increased DSH allotments provide states with access to additional federal DSH funding if the states choose to use it. The following sixteen states qualify as low DSH states: Alaska, Arkansas, Delaware, Idaho, Iowa, Minnesota, Montana, Nebraska, New Mexico, North Dakota, Oklahoma, Oregon, South Dakota, Utah, Wisconsin, and Wyoming. Each year, from FY2004 through FY2008, low DSH states received a 16% increase to their DSH allotments. For FY2009 and subsequent years, low DSH states receive DSH allotments equal to the prior year's allotment increased by the percentage change in the consumer price index for all urban consumers for the previous fiscal year, which is the same adjustment that non-low DSH states receive.In FY2013, Tennessee had a DSH allotment of $53.1 million that was not subject to the 30% limit. After FY2013, the statute did not provide a federal DSH allotment to Tennessee, and Tennessee did not receive a Medicaid DSH allotment in FY2014. Then, the Medicare Access and CHIP Reauthorization Act of 2015 (P.L. 114-10) provided a Medicaid DSH allotment to Tennessee Preliminary DSH Allotment
$337 .5
$345 .6
Alaskaa
$353 .9
22 .4
22 .9
23 .4
111 .1
113 .8
Arkansasa
116 .5
47 .4
48 .5
49 .7
1,203 .3
1,232 .2
1,261 .7
101 .5
104 .0
106 .5
219 .5
224 .8
Delawarea
230 .2
9 .9
10 .2
10 .4
67 .2
68 .8
70 .5
219 .5
224 .8
230 .2
295 .0
302 .1
Hawaiib
309 .3
10 .7
11 .0
Idahoa
11 .2
18 .0
18 .5
18 .9
236 .0
241 .7
247 .5
234 .6
240 .3
Iowaa
246 .0
43 .2
44 .3
45 .3
45 .3
46 .4
47 .5
159 .2
163 .0
166 .9
752 .6
770 .7
789 .2
115 .3
118 .0
120 .9
83 .7
85 .7
87 .8
334 .8
342 .8
351 .0
290 .9
297 .9
Minnesotaa
305 .0
82 .0
83 .9
86 .0
167 .4
171 .4
175 .5
520 .0
532 .5
Montanaa
545 .3
12 .5
12 .8
Nebraskaa
13 .1
31 .1
31 .8
32 .6
50 .8
52 .0
53 .2
175 .7
179 .9
184 .3
706 .6
723 .6
New Mexicoa
740 .9
22 .4
22 .9
23 .4
1,763 .1
1,805 .4
1,848 .7
323 .8
331 .6
North Dakotaa
339 .5
10 .5
10 .7
11 .0
445 .9
456 .6
Oklahomaa
467 .6
39 .7
40 .7
Oregona
41 .7
49 .7
50 .9
52 .1
616 .1
630 .8
646 .0
71 .3
73 .1
74 .8
359 .5
368 .1
South Dakotaa
376 .9
12 .1
12 .4
Tennesseec
12 .7
53 .1
53 .1
53 .1
1,049 .6
1,074 .8
Utaha
1,100 .6
21 .5
22 .1
22 .6
24 .7
25 .3
25 .9
96 .2
98 .5
100 .8
203 .1
207 .9
212 .9
74 .1
75 .9
Wisconsina
77 .7
103 .8
106 .3
Wyominga
108 .8
0 .2
0 .3
0 .3
$12,045 .1
$12,332 .9
$12,627 .6
in the amount of $53.1 million for each fiscal year from FY2015 through FY2025.
|
Fiscal Year |
Hawaii |
Tennessee |
|
FY2007 |
$10,000,000 |
$91,635,578 |
|
FY2008 |
$10,000,000 |
$91,635,578 |
|
FY2009 |
$10,000,000 |
$91,635,578 |
|
FY2010 |
$10,000,000 |
$91,635,578 |
|
FY2011 |
$10,000,000 |
$91,635,578 |
|
FY2012 |
$10,000,000 |
$70,108,895 |
|
FY2013 |
$10,240,000 |
$53,100,000 |
|
FY2014 |
|
$0 |
|
FY2015 |
|
$53,100,000 |
Sources: Section 1923(f)(6) of the Social Security Act; Centers for Medicare & Medicaid Services, "Medicaid Program; Final FY2009 and Preliminary FY2011 Disproportionate Share Hospital Allotments, and Final FY2009 and Preliminary FY2011 Institutions for Mental Diseases Disproportionate Share Hospital Limits," 76 Federal Register 148, January 3, 2011; Centers for Medicare & Medicaid Services, "Medicaid Program; Disproportionate Share Hospital Allotments and Institutions for Mental Diseases Disproportionate Share Hospital Limits for FYs 2010, 2011, and Preliminary FY2012 Disproportionate Share Hospital Allotments and Limits," 77 Federal Register 43301, July 24, 2012; HHS, "Medicaid Program: Disproportionate Share Hospital Allotments and Institutions for Mental Diseases Disproportionate Share Hospital Limits for FY2012, and Preliminary FY2013 Disproportionate Share Hospital Allotments and Limits," 78 Federal Register 45217, July 26, 2013; HHS, "Medicaid Program; Final FY 2013 and Preliminary FY 2015 Disproportionate Share Hospital Allotments, and Final FY 2013 and Preliminary FY 2015 Institutions for Mental Diseases Disproportionate Share Hospital Limits," 81 Federal Register 5448, February 2, 2016.
Notes: This chart does not provide DSH allotments for Hawaii and Tennessee but the federal DSH funding available to Hawaii and Tennessee. For Hawaii, the DSH allotment and the federal DSH funding available is the same. However, Tennessee's allotment for FY2007 to FY2011 is $305,451,928, but the federal DSH funding available to Tennessee is limited to 30% of the DSH allotment ($305,451,928 * 0.30 = $91,635,578). Tennessee's DSH funding for FY2012 is the combination of $22,908,895 (30% of $76,362,982) for the first fiscal quarter and $47,200,000 for the last three fiscal quarters.
CPI-U = Consumer Price Index for all Urban consumers.
a. This is the preliminary allotment for Hawaii.
DSH Allotment Reductions
The ACA was expected to reduce the number of uninsured individuals in the United States starting in 2014 through the health insurance coverage provisions (including the ACA Medicaid expansion). Built on the premise that with the ACA insurance coverage provisions (including the ACA Medicaid expansion) reducing the number of uninsured individuals, there should be less need for Medicaid DSH payments, the ACA included a provision directing the Secretary of the Department of Health and Human Services (HHS) to make aggregate reductions in Medicaid DSH allotments equal to $500 million in FY2014, $600 million in FY2015, $600 million in FY2016, $1.8 billion in FY2017, $5.0 billion in FY2018, $5.6 billion in FY2019, and $4.0 billion in FY2020.2924
Despite the assumption that reducing the uninsured would reduce the need for Medicaid DSH payments, the ACA was written so that, after the specific reductions for FY2014 through FY2020, DSH allotments would have returned to the amounts states would have received without the enactment of ACA. In other words, in FY2021, states' DSH allotments would have rebounded to their pre-ACA reduced level with the annual inflation adjustments for FY2014 to FY2021.
Since the initial enactment of the ACA, a number of laws have amended the ACA Medicaid DSH reductions by eliminating the reductions for FY2014 through FY2017FY2019, changing the reduction amounts, and extending the reductions through FY2025. Under current law, the aggregate reductions to the Medicaid DSH allotments equal $2.0 billion in FY2018, $3.0 billion in FY2019, $4.0 billion in FY2020, $5.0 billion in FY2021, $6.0 billion in FY2022, $7.0 billion in FY2023, $8.0 billion in FY2024, and $8.0 billion in FY2025.4.0 billion in FY2020 and $8.0 billion for each year from FY2021 through FY2025.25 In FY2026, DSH allotments are to rebound to the pre-ACA-reduced levels.30
DSH Payments
Medicaid state plans must include explanations for how DSH hospitals are defined and how DSH payments are calculated. There are federal requirements that states must follow in making these determinations, but for the most part, states are provided significant flexibility in defining DSH hospitals and calculating DSH payments.
Defining DSH Hospitals
The federal government provides states with the following three criteria for identifying DSH hospitals.
- At a minimum, states must provide DSH payments to all hospitals with (1) a Medicaid inpatient utilization rate
3127 in excess of one standard deviation3228 above the mean rate for the state or (2) a low-income utilization rate3329 of 25%. - All DSH hospitals must retain at least two obstetricians with staff privileges willing to serve Medicaid patients.
3430 - A hospital cannot be identified as a DSH hospital if its Medicaid utilization rate is below 1%.
As long as states include all hospitals meeting the criteria, states can identify as many or as few hospitals as DSH hospitals. Because of the flexibility, there is a great deal of variation across the states in the proportion and types of hospitals designated as DSH hospitals. Some states target their DSH funds to a few hospitals, while other states provide DSH payments to all the hospitals in the state with Medicaid utilization rates above 1%.3531 In state plan rate year36 (SPRY) 2011,2014,32 Medicaid DSH payments were made to less than 20% of the hospitals in 10nine states, and 11eight states provided Medicaid DSH payments to more than 80% of the hospitals in the state.3733
Calculating DSH Payments
States are also provided a good deal of flexibility in terms of the formulas and methods they use to distribute DSH funds among DSH hospitals. The federal government provides minimum and maximum payment criteria, but otherwise federal law does not address the specific payment amounts states should provide to each DSH hospital.
States must make minimum payments to DSH hospitals using one of three methodologies:38
- 34the Medicare DSH methodology,
- a formula providing Medicaid DSH payments that increase in proportion to the percentage by which the hospital's Medicaid inpatient utilization rate exceeds one standard deviation above the mean, or
- a formula that varies DSH payments according to the type of hospitals.
39
35 Hospital-Specific DSH Limits
DSH payments to individual hospitals are subject to a cap.40 36 The hospital-specific limit was implemented through the Omnibus Reconciliation Act of 1993 (P.L. 103-66), because Congress had received reports that hospitals had been receiving Medicaid DSH payments that exceeded the hospitals' costs.37
This hospital-specific limit prohibits DSH payments from being greater than 100% of the cost of providing inpatient and outpatient hospital services to Medicaid and uninsureduninsured and Medicaid patients less payments received from Medicaid and uninsured patients.41
The for those services.38 The components for calculating the hospital-specific DSH limit have changed in recent years. The definition of the uninsured component was amended most recently in 2014, and the definition of the Medicaid shortfall (i.e., the difference between costs and payments for Medicaid-eligible patients) is uncertain due to pending litigation.
Definition of Uninsured
Under the hospital-specific DSH limit, uninsured is defined in the statute as individuals who "have no health insurance (or other source of third-party coverage) for the services furnished during the year."4239 In the past, CMS has provided conflicting guidance regarding this definition; in December 2014, CMS issued a final rule to address this issue.43
The hospital-specific limit was implemented through the Omnibus Reconciliation Act of 1993 (P.L. 103-66), and, following the passage of the law, CMS did not issue a rule. However, CMS did issue a State Medicaid Director Letter delineating the agency's interpretation of the statute, which stated40
In 1994, CMS clarified that individuals who have no health insurance (or other third -party coverage) for the services provided during the year include those "who do not possess health insurance which applies to the service for which the individual sought treatment."44
41 This interpretation remained in effect until January 19, 2009, which was the effective date for the 2008 DSH final rule implementing the DSH auditing and reporting requirements (these requirements are discussed later in the report in the section titled "State Reporting and Auditing Requirements").45 In promulgating the 2008 DSH final rule,when CMS defined "uninsured"uninsured as individuals who do not have a legally liable third -party payer for hospital services.42party payer for hospital services.46 The 2008 DSH final rule relied on the existing regulatory definition of creditable coverage developed to implement the Health Insurance Portability and Accountability Act of 1996 (P.L. 104-191). The definition of uninsured from the 2008 final rule superseded the guidance from the 1994 State Medicaid Director Letter.
Concerns were raised about the new definition of uninsured because this definition appeared to exclude from uncompensated care (for Medicaid DSH purposes) the costs of many services that were provided to individuals with creditable coverage but were outside the scope of such coverage. For instance, the definition excluded individuals who exhausted their insurance benefits and who reached lifetime insurance limits for certain services, as well as services not covered in a benefit package.
In response to these concerns, CMS issued a final rule on December 3, 2014, that changed the definition of uninsured for Medicaid DSH purposes to a service-specific definition. The definition requires a determination of whether, for each specific service furnished during the year, the individual has third-party coverage. As a result, the definition of uninsured includes services not within a covered benefit package and services beyond the annual and lifetime limits.47
Institutions for Mental Disease DSH Limits
Federal statute limits the amount of DSH payments for institutions for mental disease (IMDs) and other mental health facilities.48 DSH payments to IMDs and other mental health facilities above the state-specific dollar limit are not eligible for federal matching funds.
Medicaid shortfall, for the purposes of the hospital-specific Medicaid DSH limit, is the difference between the cost to the hospital of providing hospital services to Medicaid-eligible patients and the payments the hospital receives for those services. For this definition, the Medicaid payments include non-DSH supplemental payments.44 The inclusion of payments for Medicaid-eligible patients with third-party coverage is uncertain due to pending litigation. For most Medicaid enrollees, Medicaid is the only source of coverage, but some Medicaid enrollees have third-party coverage, such as Medicare or private health insurance.45 For Medicaid enrollees with third-party coverage, Medicaid is usually the payer of last resort, which means the third-party coverage must make payment for claims before Medicaid makes payments.46 The inclusion of other third-party payments in the calculation of the Medicaid shortfall amount is the question of the pending litigation. CMS had provided guidance to states, through a State Medicaid Directors Letter from 2002 and a frequently asked questions (FAQ) document from 2010, to include third-party payments (e.g., payments from Medicare or private health insurance) for Medicaid-eligible patients in the calculation of Medicaid shortfall.47 However, after four appellate court decisions found that the change in policy required CMS to go through notice-and-comment rulemaking,48 CMS withdrew the relevant FAQ guidance (i.e., questions 33 and 34) as of December 30, 2018.49 During that litigation, CMS issued a final rule clarifying that third-party payments should be included in the calculation for Medicaid shortfall.50 This rule would have impacted hospital services after June 2, 2017. Enforcement of this final rule was blocked by several federal district courts that found the rule to be contrary to the plain meaning of the statute.51 However, CMS appealed these decisions. In August 2019, the U.S. Court of Appeals for the District of Columbia Circuit reversed the lower court and reinstated the 2017 final rule clarifying that third-party payments should be included in calculation for the Medicaid shortfall.52 In November 2019, the U.S. Court of Appeals for the Eighth Circuit also reversed the lower court and reinstated the 2017 final rule.53 Another appeal remains pending on this issue in the U.S. Court of Appeals for the Fifth Circuit, which held oral arguments on October 7, 2019. Parties in this litigation may ultimately seek review of these decisions by the Supreme Court. If it is decided that third-party payments cannot be included in the calculation of the Medicaid shortfall, then hospitals would be able to include the costs of the hospital services provided to Medicaid-eligible patients with third-party coverage but not the payments the hospital receives for those services. This would mean the hospital could potentially receive double payment for these services (i.e., the payment from the third-party coverage and Medicaid DSH payment). In June 2019, the Medicaid and CHIP Payment and Access Commission (MACPAC) recommended Congress change the statutory definition of Medicaid shortfall "to exclude costs and payments for all Medicaid-eligible patients for whom Medicaid is not the primary payer."54 Federal statute limits the amount of DSH payments to institutions for mental disease (IMDs) and other mental health facilities.55 DSH payments to IMDs and other mental health facilities above the state-specific dollar limit are not eligible for federal matching funds.Each state receives an IMD DSH limit that is the lesser of:43
Definition of Medicaid Shortfall
Third-Party Coverage Payments
- a state's FY1995 total IMD and other mental health facility DSH expenditures (i.e., including both state and federal spending) applicable to the state's FY1995 DSH allotment as reported on the Form CMS-64 as of January 1, 1997, or
- the amount equal to the product of the state's current year total DSH allotment and the applicable percentage, which is the lesser of 33% or the percent of FY1995 DSH expenditures that went to mental health facilities.
The IMD DSH limits fit within the state DSH allotments. In other words, when DSH payments to hospitals and IMDs and other mental health facilities are summed together, the total is required to be less than or equal to the state's DSH allotments in Table 2.
As with the DSH allotments, the IMD DSH limits are published in periodic Federal Register notices. In Appendix B, Table B-1 includes each state's IMD DSH limit for FY2013FY2017 through FY2015FY2019.
DSH Expenditures
The implementation of the DSH allotments effectively controlled the significant growth of DSH expenditures from the early 1990s. As shown in Figure 1, total Medicaid DSH expenditures (i.e., including both federal and state expenditures) have remained relatively stable since the implementation of the federal DSH allotments in FY1993. In FY2015FY2018, DSH expenditures totaled $18.616.5 billion, and the federal share of those payments was $10.69.5 billion.49
The law establishing DSH allotments (i.e., Medicaid Voluntary Contribution and Provider-Specific Tax Amendments of 1991, P.L. 102-234) specified a national DSH payment limittarget equal to 12% of the total amount of Medicaid medical assistance spending (i.e., including federal and state expenditures and excluding expenditures for administrative activities) for all 50 states and the District of Columbia.5057 This is a target but not an absolute cap.
As mentioned earlier, the national DSH payment limittarget is different from the state-specific 12% limit on state DSH allotments because the 12% national payment limittarget restricts both federal and state spending while the 12% limit for allotments caps only federal spending. TheUnder the national DSH payment target states that, aggregate DSH payments (including federal and state expenditures) should not be more than 12% of the total amount of Medicaid medical assistance expenditures for all 50 states and the District of Columbia. The federal statute limits state DSH allotments (i.e., the maximum amount of Medicaid DSH federal funds) to no more than 12% of each state's total Medicaid medical assistance expenditures (i.e., including federal and state expenditures but excluding administrative expenditures), which means the federal share of DSH expenditures cannot be more than 12% of each state's total Medicaid medical assistance expenditures.
This means if a state receives a federal DSH allotment equal to 12% of its total Medicaid medical assistance expenditures and the state uses all of its federal DSH allotment, then with the state matching funds, the state would provide DSH payments in excess of 12% of its total Medicaid medical assistance expenditures. As a result, it is possible that the national DSH target could be surpassed even if state DSH allotments are subject to the 12% limit. However, as shown in Figure 2, the implementation of DSH allotments effectively brought DSH payments under the 12% national target within a few years. DSH allotments were implemented in FY1993, and total DSH expenditures fell below 12% of total Medicaid medical assistance expenditures in FY1996. In FY2015FY2018, total DSH expenditures were 3.52.8% of the total Medicaid medical assistance expenditures.51
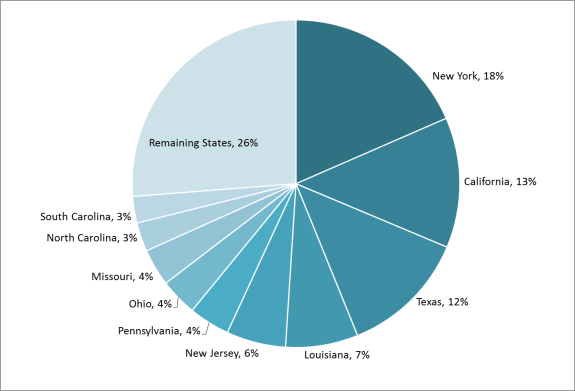
DSH expenditures are highly concentrated in a few states. As shown in Figure 3, 4 states (New York, California, Texas, and LouisianaTexas, Louisiana, and Pennsylvania) accounted for almost half of the FY2015FY2018 DSH expenditures, and 10 states accounted for almost three-quarters72% of all DSH expenditures. It makes sense that some of these states (California, New York, Texas, Pennsylvania, Michigan, and New JerseyNew York, California, Texas, New Jersey, Pennsylvania, and Ohio) accounted for a large portion of the total Medicaid DSH expenditures, because these states were among the top 10 highest- spending states in terms of total medical assistance expenditures (i.e., including federal and state expenditures and excluding expenditures for administrative activities) for FY2015. On the other handFY2018. By contrast, North Carolina, Louisiana, Missouri, North Carolina, and South Carolina ranked 2411th, 1618th, 1119th, and 2728th (respectively) in terms of total medical assistance expenditures (i.e., including federal and state expenditures and excluding expenditures for administrative activities) for FY2015FY2018, but these states were among the top 10 highest spending states in terms of Medicaid DSH expenditures. This means Louisiana, Missouri, North CarolinaNorth Carolina, Louisiana, Missouri, and South Carolina spent larger proportions of their Medicaid budgets on Medicaid DSH payments relative to most other states.
|
Figure 3. States' Share of Total Medicaid DSH Expenditures FY2015 |
 |
|
Source: CRS calculation using Centers for Medicare & Medicaid Services' Form CMS-64 data from Notes: The states included in the "remaining states" category had DSH expenditures that accounted for less than 3% of total DSH expenditures. In Appendix C, Table C-1 shows state-by-state DSH spending. |
State Variation
As mentioned previously, there is significant variation among the states in how each state DSH program is structured, and there is also variation from state to state with respect to DSH expenditures. Two distinct differences are (1) the percent of a state's total Medicaid medical assistance expenditures (i.e., including federal and state expenditures and excluding expenditures for administrative activities) a state's DSH expenditures account for and (2) the proportion of DSH payments going to hospitals versus IMDs.
DSH as a Percentage of Total Medical Assistance Expenditures
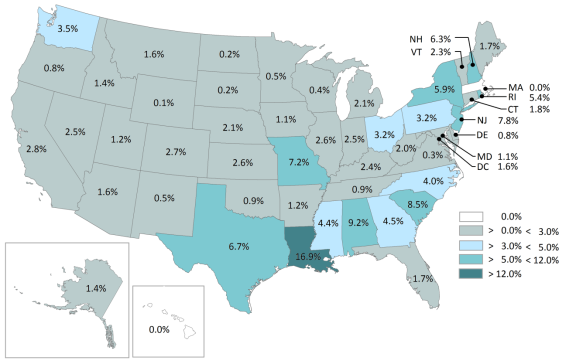
Figure 4 shows FY2015FY2018 total DSH expenditures (i.e., including both federal and state expenditures) as a percentage of total Medicaid medical assistance expenditures (i.e., including federal and state expenditures and excluding expenditures for administrative activities). DSH expenditures made in FY2015FY2018 ranged from 0.1% of total Medicaid medical assistance expenditures in Montana, North Dakota, and Wyoming to 16.911.5% in Louisiana.
|
Figure 4. Total State DSH Expenditures as a Percentage of Total Medicaid Medical Assistance Expenditures FY2015 |
 |
|
Source: CRS calculation using Centers for Medicare & Medicaid Services' Form CMS-64 data for Notes: Total DSH expenditures and total Medicaid medical assistance expenditures (i.e., excluding expenditures for administrative activities) include both the federal and state share of expenditures. Massachusetts and Hawaii do not have DSH expenditures because these states have Section 1115 waivers allowing each state to use its DSH allotment to fund its uncompensated care pools. In Appendix C, Table C-1 shows each state's total DSH expenditures and total Medicaid medical assistance expenditures. |
In FY2015, one state (Louisiana)FY2018, no states had DSH expenditures in excess of 12% of total Medicaid medical assistance expenditures,5259 which was the threshold used to determine "high"high DSH states when DSH allotments were first implemented.5360 This is down from FY1993, when 21 states were considered "high"high DSH states.
Hospital Versus IMD
Nationally, 8482% of DSH expenditures are allocated to hospitals, and the remaining 1618% is distributed to IMDs and other mental health facilities. ThisHowever, this distribution varies by state. As shown in Figure 5, in FY2015FY2018, most states targeted their DSH expenditures to hospitals, with 1518 states54 allocating all of their DSH expenditures to hospitals.61 Other states focused their DSH expenditures on IMDs and other mental health facilities. One state (Maine)Maine and Ohio made all of itstheir DSH expenditures to IMDs and other mental health facilities.
|
Figure 5. Proportion of State DSH Expenditures Allocated to Hospitals and IMDs FY2015 |
 |
|
Source: CRS calculation using Centers for Medicare & Medicaid Services' Form CMS-64 data from Notes: IMD = Institutions for mental diseases and other mental health facilities. Table C-1 shows each state's hospital and IMD DSH expenditures. California and Michigan made small DSH payments to IMDs. Specifically, California had DSH payments to IMDs in the amount of $26, 766, and Michigan had DSH payments to IMDs in the amount of $82,888. Massachusetts and Hawaii do not have DSH expenditures because these states have Section 1115 waivers allowing each state to use its DSH allotment to fund its uncompensated care pools. California and Connecticut were excluded from this figure because both states had negative Medicaid DSH payments in FY2018 due to prior-year adjustments. |
State Reporting and Auditing Requirements
Since FY1993, each state has been required to provide quarterly reports with information about the aggregate DSH payments made to hospitals. Then, in 1997 and again in 2003, Congress enhanced the DSH reporting requirements in response to HHS Office of the Inspector General audits and Government Accountability Office reports detailing state violations in the DSH program.
The Balanced Budget Act of 1997 (BBA; P.L. 105-33) required states to provide an annual report to the Secretary of HHS describing the method used to target DSH funds and to calculate DSH payments. Then, in 2003, MMA mandated that beginning in state plan rate year55 (SPRY) 2005,62 states were required to submit annual reports and independently certified audits.56
States' annual DSH reports must provide detailed information about each hospital receiving a DSH payment. For each hospital, the report must include the following information: the hospital-specific DSH limit, the Medicaid inpatient utilization rate, the low income utilization rate, state-defined DSH qualification criteria, Medicaid basic payments, other supplemental payments, total Medicaid uncompensated care, total uninsured uncompensated care, federal Section 1011 payments,5764 and DSH payments.
The annual independent certified audits must verify that hospitals retain the DSH payment; DSH payments are made in accordance with the hospital-specific DSH limits; uncompensated care only includes inpatient and outpatient services; and the state separately documented and retains records of DSH payments (including the methodology for calculating each hospital's DSH payments).
The annual independent certified audits must be completed by the last day of the federal fiscal year ending three years from the end of the SPRY under audit. The annual DSH reports are due at the same time as the independent certified audits. If a state does not submit the independent certified audit by this deadline, the state could lose the federal DSH matching funds for the SPRYs subsequent to the date the audit is due.58
To ensure a period for developing and refining the reporting and auditing techniques, findings of state reports and audits for SPRY2005 to SPRY2010 were not to be given weight except to the extent that the findings draw into question the reasonableness of the state uncompensated care cost estimates used for calculations of prospective DSH payments. For SPRY2011 and after, audit findings demonstrating that DSH payments exceed the hospital-specific cost limit are regarded as discovery of overpayment to providers requiring the state to return the federal share of the overpayment to the federal government (unless the DSH payments are redistributed to other qualifying hospitals).59
Conclusion
Since DSH allotments were implemented in FY1993, nominal DSH payments have remained relatively stable. Total DSH expenditures have dropped as a percentage of total Medicaid medical assistance expenditures from 15.0% in FY1992 to 3.5% in FY2015.
Over the next few years, DSH expenditures are to2.8% in FY2018.
Medicaid DSH allotment reductions are slated to take effect in FY2020 and continue through FY2025. If they take effect, DSH expenditures would likely continue to decline as a percentage of Medicaid medical assistance expenditures due to the DSH reductions. The impact of these reductions will vary by state according to the uninsurance rate of each state;, whether a state is a "low DSH state"; and how a state targets its DSH payments.
Currently, the DSH reductions are slated to end in FY2025 with state DSH allotments returning to the level states would have received without the DSH reduction for FY2026 and subsequent years. However, the future of Medicaid DSH payments is uncertain because Congress may decide to change the DSH reductions again. Also, as states build experience with the ACA Medicaid expansion, the role of DSH in Medicaid may be revisited and modified by Congress.
The future of Medicaid DSH payments is uncertain, because Congress may decide to change the DSH reductions again or amend the distribution of federal Medicaid DSH funding among states.
Congress could amend the Medicaid DSH reductions in the same way the reductions have been amended in the past, which includes eliminating the reductions for FY2014 through FY2019, changing the reduction amounts, and extending the reductions through FY2025.67 In March 2019, MACPAC made recommendations to Congress for phasing in the reductions and restructuring the methodology for allocating Medicaid DSH reductions to states.68 In June 2019, the House Energy and Commerce Committee's Subcommittee on Health held a hearing on a number of health care bills, including the Patient Access Protection Act (H.R. 3022), that would repeal the Medicaid DSH reductions.
In 2019, there has been some discussion of amending the allocation of Medicaid DSH allotment funding among the states. The State Accountability, Flexibility, and Equity (SAFE) for Hospitals Act (S. 18 and H.R. 3613) has been introduced in the Senate and the House of Representatives, and these bills would change the methodology for allocating federal Medicaid DSH funding among the states, among other things. In addition, Senate Finance Chairman Grassley stated that he is considering options to amend the distribution of federal Medicaid DSH funding among states.69
Appendix A. A Chronology of State DSH Allotments Calculations
The Medicaid Voluntary Contribution and Provider-Specific Tax Amendments of 1991 (P.L. 102-234) established ceilings on federal Medicaid DSH funding for each state. Since FY1993, each state has had its own DSH limit, which is referred to as "DSH allotments.." These allotments are calculated by the Centers for Medicare & Medicaid Services (CMS) and promulgated in the Federal Register. The methodology for calculating these allotments has changed a number of times over the years, and these different methodologies are described below.60
The original state DSH allotments provided in FY1993 were based on each state's FY1992 DSH payments. This resulted in funding inequities because states that had been providing relatively more DSH payments to hospitals in FY1992 locked in higher Medicaid DSH allotments (and vice versa). As a result, the DSH allotment a state receives is not entirely based on the number of DSH hospitals in the state or the hospital services provided in DSH hospitals to low-income patients.
The DSH allotments for FY1994 to FY1997 were based on each state's prior year DSH allotment. The annual growth for each state's DSH allotment depended on whether a state was classified as a "high-DSH" or "low-DSH" state. States with DSH expenditures greater than 12% of their total Medicaid medical assistance expenditures (i.e., federal and state Medicaid expenditures excluding expenditures for administrative activities) were classified as "high-DSH" states, and "high-DSH" states did not receive an increase to their DSH allotment. States with DSH expenditures less than 12% of their total Medicaid medical assistance expenditures were classified as "low-DSH" states, and the growth factor for the DSH allotment for "low-DSH" states was the projected percentage increase for each state's total Medicaid expenditures (i.e., including federal and state spending) for the current year. However, "low-DSH" states' DSH allotments could not exceed 12% of each state's total medical assistance expenditures.6171
Provisions included in the Balanced Budget Act of 1997 (BBA; P.L. 105-33) reduced Medicaid DSH expenditures by replacing the state DSH allotment calculations with fixed state DSH allotments specified in statute for FY1998 through FY2002.6272 The aggregate fixed allotments for FY1998 totaled $10.3 billion, which was a 50% decrease from the aggregate FY1997 DSH allotments. The aggregate allotments for FY1999 and FY2000 decreased to $10.0 billion and $9.3 billion respectively.
Adjustments for Specific States
A number of legislative adjustments were made to the BBA fixed DSH allotments. The Departments of Labor, Health and Human Services, and Education, and Related Agencies Appropriations Act, 1998 (P.L. 105-78) increased the FY1998 DSH allotments for Minnesota and Wyoming. The Omnibus Consolidated and Emergency Supplemental Appropriations Act, 1999 (P.L. 105-277) increased the FY1999 DSH allotments for Minnesota, New Mexico, and Wyoming. The Medicare, Medicaid, and SCHIP Balanced Budget Refinement Act of 1999 (included in the Consolidated Appropriations Act 2000, P.L. 106-113) increased the FY2000, FY2001, and FY2002 DSH allotments for the District of Columbia, Minnesota, New Mexico, and Wyoming.
FY2001 and FY2002
The fixed state allotments were supposed to last through FY2002 with the aggregate DSH allotments slated to decrease in FY2001 and again in FY2002. However, the Medicare, Medicaid, and SCHIP Benefits Improvement and Protection Act of 2000 (BIPA, which was incorporated into the Consolidated Appropriations Act of 2001, P.L. 106-554) eliminated the DSH reductions for FY2001 and FY2002 and provided states with increases to their DSH allotments. Specifically, the DSH allotments for those two years were determined by increasing each state's prior year DSH allotment by the percent change in the Consumer Price Index for all Urban Consumers (CPI-U) for the prior fiscal year. These state DSH allotments could not exceed 12% of a state's total medical assistance expenditures for the allotment year. This is referred to as the 12% rule.63
Extremely Low DSH States
BIPA also established a special rule for DSH allotments for "extremely low DSH states," which were defined as states with FY1999 DSH expenditures greater than 0% and less than 1% of total Medicaid medical assistance expenditures (i.e., federal and state Medicaid expenditures excluding expenditures for administrative activities).6474 The FY2001 DSH allotments for extremely low DSH states were increased to 1% of each state's FY2001 total medical assistance expenditures. Then, the FY2002 DSH allotments for extremely low DSH states were each state's FY2001 DSH allotment increased by the percentage change in CPI-U for FY2001, subject to the 12% rule.65
FY2003
For non-extremely low DSH states, FY2003 DSH allotments were each state's FY2002 fixed DSH allotment determined in BBA (i.e., not states' actual DSH allotment for FY2002 as provided by BIPA) increased by the percent change in CPI-U for FY2002, subject to the 12% rule. For most states, the FY2002 state DSH allotments provided by BBA were less than the actual state allotments states received in FY2002. As a result, in general, FY2003 DSH allotments were lower than the allotments states received in FY2002.6676 This was not the case for extremely low DSH states, which received FY2003 DSH allotments based on their actual FY2002 DSH allotment increased by percentage change in CPI-U for FY2002.6777
FY2004
The Medicare Prescription Drug, Improvement, and Modernization Act of 2003 (MMA; P.L. 108-173) addressed the drop in DSH allotments for many states from FY2002 to FY2003 by exempting FY2002 DSH allotment amounts from the 12% rule and providing a 16% increase in DSH allotments for FY2004.
Low DSH States
MMA also discontinued the special arrangement for extremely low DSH states and instead established low DSH states—defined as those states in which total DSH payments for FY2000 were less than 3% of the state's total Medicaid medical assistance expenditures. For such states, FY2004 DSH allotments were each state's FY2003 DSH allotment increased by 16%.
After FY2004
State DSH allotments for years after FY2004 are set to be equal to each state's FY2004 DSH allotment, unless a state's allotment as determined by the calculation in place prior to MMA would equal or exceed the FY2004 allotment for that state. For any years in which a state's DSH allotments would be higher under the pre-MMA calculation, that state's DSH allotment will be equal to its DSH allotment from the prior fiscal year increased by the percentage change in the CPI-U for the prior fiscal year, subject to the 12% rule.68
Low DSH States
By statute, the definition of low DSH state is a state with FY2000 DSH expenditures greater than 0% but less than 3% of total Medicaid medical assistance expenditures for FY2000. So states determined to be low DSH states in FY2004 continue to be low DSH states regardless of the states' DSH expenditures in years after FY2000.
For FY2004 through FY2008, low DSH states received DSH allotments in each year equal to each state's prior year DSH allotment increased by 16%, subject to the 12% rule. For FY2009 forward, the allotment for low DSH states is equal to the prior year allotment amount increased by the percentage change in the CPI-U (subject to the 12% rule), which is the same DSH increase provided to non-low DSH states.
District of Columbia
The Deficit Reduction Act of 2005 (DRA; P.L. 109-171) increased the fixed DSH allotments for the District of Columbia for FY2000, FY2001, and FY2002 from $32 million to $49 million. This change was effective as of October 1, 2005. Increasing the District of Columbia's DSH allotments for FY2000 to FY2002 was done for the purposes of determining the District of Columbia's FY2006 DSH allotment. This change made the District of Columbia's DSH allotment for FY2006 $57.7 million, which was a $20.0 million increase over what the District of Columbia would have gotten without the change. The provision took effect on October 1, 2005, and applies to FY2006 and subsequent fiscal years.
Hawaii and Tennessee Tennessee and Hawaii operate their state Medicaid programs under Section 1115 research and demonstration waivers,79 which allow the Secretary of Health and Human Services to waive various provisions of Medicaid law. Both states received waivers from making Medicaid DSH payments (among other things), and these states did not receive DSH allotments from FY1998 to FY2006. Since FY2007, the Medicaid DSH allotments for Hawaii and Tennessee have been set by special statutory authority provided through multiple laws: the Tax Relief and Health Care Act of 2006 (P.L. 109-432); the Medicare, Medicaid, and SCHIP Extension Act of 2007 (P.L. 110-173); the Medicare Improvements for Patients and Providers Act of 2008 (P.L. 110-275); the Children's Health Insurance Program Reauthorization Act of 2009 (P.L. 111-3); the Patient Protection and Affordable Care Act (P.L. 111-148, as amended); and the Medicare Access and CHIP Reauthorization Act of 2015 (MACRA, P.L. 114-10). Hawaii Hawaii's DSH allotment was set at $10 million for each of FY2007 through FY2011. Under the ACA, Hawaii's FY2012 DSH allotment was also set at $10.0 million, but the allotment was split into two periods. For the first quarter of FY2012 (i.e., October 1, 2011, to December 31, 2011), Hawaii's DSH allotment was $2.5 million. Then, for the remaining three quarters of FY2012, Hawaii's DSH allotment was $7.5 million. For FY2013 and subsequent years, Hawaii's annual DSH allotment increases in the same manner applicable to low DSH states. Tennessee The federal statute specified that Tennessee's DSH allotment for each year from FY2007 to FY2011 was the greater of $280.0 million or the federal share of the DSH payments reflected in TennCare for the demonstration year ending in 2006.80 In accordance with this provision, Tennessee's DSH allotment was $305.4 million (i.e., the federal share of the DSH payments reflected in TennCare for the demonstration year ending in 2006) from FY2007 to FY2011. The statute further limited the amount of federal funds available to Tennessee for DSH payments to 30% of Tennessee's DSH allotment. Under this limit, the federal DSH funding available to Tennessee for each year from FY2007 to FY2011 was $91.6 million (i.e., 30% of $305.4 million). For the first quarter of FY2012 (i.e., October 1, 2011, through December 31, 2011), Tennessee's DSH allotment was $76.4 million and was subject to the 30% limit.81 For the last three fiscal quarters of FY2012, Tennessee received a DSH allotment of $47.2 million that was not subject to the 30% limit. In total, Tennessee had access to $70.1 million in federal DSH funding in FY2012.82 In FY2013, Tennessee had a DSH allotment of $53.1 million that was not subject to the 30% limit. After FY2013, the statute did not provide a federal DSH allotment to Tennessee, and Tennessee did not receive a Medicaid DSH allotment in FY2014. Then, MACRA provided a Medicaid DSH allotment to Tennessee in the amount of $53.1 million for each fiscal year from FY2015 through FY2025. FY2009 and FY2010FY2009 and FY2010
The American Recovery and Reinvestment Act of 2009 (ARRA; P.L. 111-5) temporarily increased states' DSH allotments for FY2009 and FY2010.69 Specifically, ARRA provided states with a FY2009 DSH allotment that was 102.5% of the FY2009 allotment states would have received without ARRA. Then, states' FY2010 DSH allotments were 102.5% of each state's FY2009 DSH allotment as determined under ARRA. For both years, the ARRA DSH provisions were not applied to the DSH allotments for states that would have had a higher DSH allotment as determined without application of the ARRA DSH provisions. After FY2010, states' annual DSH allotments returned to being determined as they were prior to the enactment of ARRA.70
Under Sections 1923(h) of the Social Security Act, states cannot collectreceive Medicaid federal matching funds for DSH payments to IMDs and other mental health facilities that are in excess of state-specific aggregate limits. The aggregate limit for each state is the lesser of a state's FY1995 DSH expenditures to IMDs and other mental health facilities or the amount equal to the product of a state's current year DSH allotment and the applicable percentage (i.e., the percentage of FY1995 DSH expenditures paid to IMDs and other mental health facilities with a maximum of 33%). Table B-1 shows states' final IMD DSH limits for FY2013FY2017 and preliminary limits for FY2014 and FY2015FY2018 and FY2019.
|
State |
|
|
|
|
Alabama |
$3, |
$3, |
$3, |
|
Alaska |
7, |
7, |
7, |
|
Arizona |
18,702,314 |
19, |
19, |
|
Arkansas |
574,939 |
574,365 |
580,756 |
|
California |
777,960 |
777,960 |
777,960 |
|
Colorado |
297, |
297,388 |
303,395 |
|
Connecticut |
52,786,863 |
52,786,863 |
52,786,863 |
|
Delaware |
3, |
3, |
3, |
|
District of Columbia |
4,581,595 |
4,581,595 |
4,581,595 |
|
Florida |
69,346,847 |
70,387,050 |
71,513,243 |
|
Georgia |
0 |
0 |
0 |
|
Hawaii |
0 |
0 |
0 |
|
Idaho |
0 |
0 |
0 |
|
Illinois |
44,704,138 |
44,704,138 |
45,383,641 |
|
Indiana |
74,114,444 |
75,226,160 |
76,429,779 |
|
Iowa |
0 |
0 |
0 |
|
Kansas |
14, |
14,517,329 |
14,749,607 |
|
Kentucky |
26, |
26, |
26, |
|
Louisiana |
80,310,122 |
80,310,122 |
81,595,084 |
|
Maine |
36,407,095 |
36,953,201 |
37,544,452 |
|
Maryland |
26,438,486 |
26,835,063 |
27,264,424 |
|
Massachusetts |
52,817,527 |
52,817,527 |
52,817,527 |
|
Michigan |
91,884,573 |
93,262,842 |
94,755,047 |
|
Minnesota |
2,628,607 |
2,628,607 |
2,628,607 |
|
Mississippi |
0 |
0 |
0 |
|
Missouri |
127,179,885 |
128,547,634 |
131,490,365 |
|
Montana |
0 |
0 |
0 |
|
Nebraska |
1,010,002 |
991,526 |
964,899 |
|
Nevada |
0 |
0 |
0 |
|
New Hampshire |
47,376,974 |
47,376,974 |
47,376,974 |
|
New Jersey |
178,685,231 |
178,685,231 |
178,685,231 |
|
New Mexico |
175,981 |
176,312 |
177,458 |
|
New York |
302,500,000 |
302,500,000 |
302,500,000 |
|
North Carolina |
102,286,600 |
103,820,899 |
105,482,034 |
|
North Dakota |
516,677 |
494,239 |
494,239 |
|
Ohio |
59,404,548 |
58, |
58, |
|
Oklahoma |
2,094,879 |
2,095,533 |
2, |
|
Oregon |
12, |
12, |
12, |
|
Pennsylvania |
194,604,591 |
197,523,660 |
200,684,038 |
|
Rhode Island |
1, |
1, |
1, |
|
South Carolina |
50,763,367 |
50,864,274 |
50,914,727 |
|
South Dakota |
422,155 |
402,245 |
387,971 |
|
Tennessee |
0 |
0 |
0 |
|
Texas |
173,460,560 |
171,676,227 |
169,804,140 |
|
Utah |
650,565 |
657,388 |
659,444 |
|
Vermont |
5,083,555 |
5,148,868 |
5,098,976 |
|
Virginia |
3,885,134 |
3,885,134 |
3,885,134 |
|
Washington |
64,145,834 |
65,108,022 |
66,149,750 |
|
West Virginia |
13, |
13, |
13,475,907 |
|
Wisconsin |
2, |
2, |
2, |
|
Wyoming |
0 |
0 |
0 |
|
Total |
$1, |
$ |
$ |
2,032,756,181
Source: Department of Health and Human Services (HHS), "Medicaid Program: Disproportionate Share Hospital Allotments and Institutions for Mental Diseases Disproportionate Share Hospital Limits for FY 2016, and Preliminary FY 2018 Disproportionate Share Hospital Allotments and Limits," 83 Federal Register 31536, July 6, 2018; HHS, "Medicaid Program: Disproportionate Share Hospital Allotments and Institutions for Mental Diseases Disproportionate Share Hospital Limits for FY 2017, and Preliminary FY 2019 Disproportionate Share Hospital Allotments and Limits," 84 Federal Register 3169, February 11, 2019. Notes: DSH = Disproportionate Share Hospital. IMD = Institutions for mental diseases.
There is significant variation from state to state with respect to DSH expenditures. Two distinct differences are (1) the proportion of DSH payments going to hospitals and IMDs and (2) total DSH payments as a percent of total Medicaid medical assistance expenditures (i.e., including federal and state expenditures and excluding expenditures for administrative activities).
Nationally, 8482% of Medicaid DSH expenditures arewere allocated to hospitals in FY2018, and the remaining 16% is18% was distributed to IMDs and other mental health facilities. This distribution varies by state. As shown in Table C-1, in FY2015FY2018, most states targeted their DSH expenditures to hospitals, with 1518 states allocating all of their DSH expenditures to hospitals. However, some states focused their DSH expenditures on IMDs and other mental health facilities. One state (MaineTwo states (Maine and Ohio) used all of itstheir DSH expenditures for IMDs and other mental health facilities.
Table C-1 also shows FY2015FY2018 total DSH expenditures (i.e., including both federal and state expenditures) as a percentage of total Medicaid medical assistance expenditures (i.e., including federal and state expenditures and excluding expenditures for administrative activities). DSH expenditures made in FY2015FY2018 ranged from 0.1% of total Medicaid medical assistance expenditures in Montana, North Dakota, and Wyoming to 16.911.5% in Louisiana.
Table C-1. DSH Expenditures by Type and DSH Expenditures as a Percentage of Medical Assistance Expenditures
FY2015
($ in millions)
|
State |
DSH Expenditures |
Total Medical Assistance |
DSH Payments as a Percentage of Medical Assistance Expenditures |
|||||||||||||||||
|
Hospital |
IMD |
Total |
||||||||||||||||||
|
Alabama |
|
|
|
|
|
|||||||||||||||
|
Alaska |
|
|
|
|
|
|||||||||||||||
|
Arizona |
|
|
|
|
|
|||||||||||||||
|
Arkansas |
|
|
|
|
|
|||||||||||||||
|
Californiaa |
|
|
|
|
|
|||||||||||||||
|
Colorado |
|
|
|
|
|
|||||||||||||||
|
Connecticut b |
|
|
|
|
|
|||||||||||||||
|
Delaware |
|
|
|
|
|
|||||||||||||||
|
District of Columbia |
|
|
|
|
|
|||||||||||||||
|
Florida |
|
|
|
|
|
|||||||||||||||
|
Georgia |
|
|
|
|
|
|||||||||||||||
|
Hawaii |
|
|
|
|
|
|||||||||||||||
|
Idaho |
|
|
|
|
|
|||||||||||||||
|
Illinois |
|
|
|
|
|
|||||||||||||||
|
Indiana |
|
|
|
|
|
|||||||||||||||
|
Iowa |
|
|
|
|
|
|||||||||||||||
|
Kansas |
|
|
|
|
|
|||||||||||||||
|
Kentucky |
|
|
|
|
|
|||||||||||||||
|
Louisiana |
|
|
|
|
|
|||||||||||||||
|
Maine |
|
|
|
|
|
|||||||||||||||
|
Maryland |
|
|
|
|
|
|||||||||||||||
|
Massachusetts |
|
|
|
|
|
|||||||||||||||
|
Michigan |
|
|
|
|
|
|||||||||||||||
|
Minnesota |
|
|
|
|
|
|||||||||||||||
|
Mississippi |
|
|
|
|
|
|||||||||||||||
|
Missouri |
|
|
|
|
|
|||||||||||||||
|
Montana |
|
|
|
|
|
|||||||||||||||
|
Nebraska |
|
|
|
|
|
|||||||||||||||
|
Nevada |
|
|
|
|
|
|||||||||||||||
|
New Hampshire |
|
|
|
|
|
|||||||||||||||
|
New Jersey |
|
|
|
|
|
|||||||||||||||
|
New Mexico |
|
|
|
|
|
|||||||||||||||
|
New York |
|
|
|
|
|
|||||||||||||||
|
North Carolina |
|
|
|
|
|
|||||||||||||||
|
North Dakota |
|
|
|
|
|
|||||||||||||||
|
Ohio |
|
|
|
|
|
|||||||||||||||
|
Oklahoma |
|
|
|
|
|
|||||||||||||||
|
Oregon |
|
|
|
|
|
|||||||||||||||
|
Pennsylvania |
|
|
|
|
|
|||||||||||||||
|
Rhode Island |
|
|
|
|
|
|||||||||||||||
|
South Carolina |
|
|
|
|
|
|||||||||||||||
|
South Dakota |
|
|
|
|
|
|||||||||||||||
|
Tennessee |
|
|
|
|
|
|||||||||||||||
|
Texas |
|
|
|
|
|
|||||||||||||||
|
Utah |
|
|
|
|
|
|||||||||||||||
|
Vermont |
|
|
|
|
|
|||||||||||||||
|
Virginia |
|
|
|
|
|
|||||||||||||||
|
Washington |
|
|
|
|
|
|||||||||||||||
|
West Virginia |
|
|
|
|
|
|||||||||||||||
|
Wisconsin |
|
|
|
|
|
|||||||||||||||
|
Wyoming |
|
|
|
|
|
|||||||||||||||
|
Total |
|
|
|
|
|
|||||||||||||||
Source: CRS calculation using Centers for Medicare & Medicaid Services' Form CMS-64 Data for FY2015 as of March 31, 2016.
Notes: Medicaid medical assistance expenditures exclude administrative expenditures.
DSH = Disproportionate share hospital. IMD = Institutions for mental diseases.
a. California made smallhad small, negative DSH payments to IMDs. Specifically, California had DSH paymentsexpenditures to IMDs in the amount of $26, 766 in FY2015.
b. -$1,237 in FY2018. States may have negative expenditures due to prior period adjustments.
b. Connecticut had negative expenditures for hospitals due to prior period adjustments.
c. Massachusetts and Hawaii do not have DSH expenditures because these states have Section 1115 waivers allowing each state to use its DSH allotment to fund its uncompensated care pools.
Author Contact Information
Footnotes
| 1. |
For more information about the Medicaid program, see CRS Report R43357, Medicaid: An Overview |
||||||||||||||||||||||||
| 2. |
The territories are American Samoa, Guam, the Commonwealth of the Northern Mariana Islands, Puerto Rico, and the Virgin Islands. |
||||||||||||||||||||||||
| 3. |
For an overview of Medicaid financing issues, see CRS Report R42640, Medicaid Financing and Expenditures |
||||||||||||||||||||||||
| 4. |
For more information about the federal medical assistance percentage (FMAP), see CRS Report R43847, Medicaid's Federal Medical Assistance Percentage (FMAP) 5.
|
For more information about Medicaid supplemental payments, see CRS Report R45432, Medicaid Supplemental Payments. |
|||||||||||||||||||||||
|
The Medicare program also makes |
|||||||||||||||||||||||||
|
The DSH provision was included in a package of provisions referred to as the "Boren amendment" after its sponsor, Senator David Boren from Oklahoma. |
|||||||||||||||||||||||||
|
The Secretary of the Department of Health and Human Services (HHS) could approve an alternate system only if the Secretary determined that (1) a reasonable cost was paid (though the state could develop its own methods and standards for determining what was reasonable) and (2) the reasonable cost did not exceed the amount which would be determined reasonable under Medicare. |
|||||||||||||||||||||||||
|
§1902(a)(13)(A)(iv) of the Social Security Act. |
|||||||||||||||||||||||||
|
|
|||||||||||||||||||||||||
|
A Medicaid |
|||||||||||||||||||||||||
|
In the mid-1980s, states began using provider taxes along with provider donations to help finance Medicaid. Essentially, Medicaid providers would donate funds or agree to be taxed, and the revenue from these taxes and donations would be used to finance a portion of the state's share of Medicaid expenditures. Some states were |
|||||||||||||||||||||||||
|
Also, the Medicaid Voluntary Contribution and Provider-Specific Tax Amendments (P.L. 102-234) restricted the use of provider donations in financing Medicaid to extremely limited situations and limited states' ability to draw down federal Medicaid matching funds with provider tax revenue. |
|||||||||||||||||||||||||
|
|
|||||||||||||||||||||||||
|
Each state's regular FMAP rate is used to determine the federal share of DSH payments. |
|||||||||||||||||||||||||
|
The Medicare Prescription Drug, Improvement, and Modernization Act of 2003 (MMA; P.L. 108-173) addressed the drop in DSH allotments for many states from FY2002 to FY2003 by providing a 16% increase in DSH allotments for states in FY2004. If a state's FY2004 DSH allotment is higher than the DSH allotment calculated under the pre-MMA calculation, then the state has received that higher DSH allotment amount since FY2004. |
|||||||||||||||||||||||||
|
|
|||||||||||||||||||||||||
|
§1923(f)(3)(B) of the Social Security Act. |
|||||||||||||||||||||||||
|
When DSH allotments were first implemented, a state with DSH expenditures greater than 12% of its total Medicaid medical assistance expenditures were classified as "high-DSH" states, and "high-DSH" states did not receive annual increases to their DSH allotment. |
|||||||||||||||||||||||||
|
42 C.F.R. §447.297. |
|||||||||||||||||||||||||
|
This means if a state receives a federal DSH allotment equal to 12% of its total Medicaid medical assistance expenditures and the state uses all of its federal DSH allotment, then with the state matching funds, the state would provide DSH payments in excess of 12% of its total Medicaid medical assistance expenditures. As a result, the national DSH target could be surpassed. However, in |
|||||||||||||||||||||||||
|
HHS, CMS, "Medicaid Program; Final FY |
|||||||||||||||||||||||||
|
BIPA defined extremely low DSH states as those for which FY1999 total DSH payments (federal and state shares) were greater than zero but less than 1% of the state's total Medicaid medical assistance expenditures (i.e., the federal and state share of Medicaid expenditures excluding administrative expenditures). (§1923(f)(5)(A) of the Social Security Act.) |
|||||||||||||||||||||||||
|
§1923(f)( The Continuing Appropriations Act, 2020, and Health Extenders Act of 2019 (P.L. 116-59) delayed the implementation of the FY2020 Medicaid DSH reductions until November 22, 2019. | |||||||||||||||||||||||||
| 24. |
§1115 of the Social Security Act gives the Secretary of Health and Human Services authority to approve experimental, pilot, or demonstration projects that promote the objectives of the Medicaid and CHIP programs. |
||||||||||||||||||||||||
| 25. |
These laws include the Tax Relief and Health Care Act of 2006 (P.L. 109-432), the Medicare, Medicaid, and SCHIP Extension Act of 2007 (P.L. 110-173), the Medicare Improvements for Patients and Providers Act of 2008 (P.L. 110-275), the Children's Health Insurance Program Reauthorization Act of 2009 (P.L. 111-3), and the Patient Protection and Affordable Care Act (P.L. 111-148 as amended). |
||||||||||||||||||||||||
| 26. |
TennCare is the name of Tennessee's Medicaid program, which operates under a §1115 waiver. |
||||||||||||||||||||||||
| 27. |
This amount is one-fourth of $305,451,928, which was the DSH allotment for Tennessee for each year from FY2007 to FY2011. |
||||||||||||||||||||||||
| 28. |
$70,108,895 = $22,908,895 (i.e., 30% of $76,362,982) + $47,200,000. |
||||||||||||||||||||||||
| 29. |
§1923(f)(7) of the Social Security Act. |
||||||||||||||||||||||||
|
For more information about the ACA Medicaid DSH reductions, see CRS In Focus IF10422, Medicaid Disproportionate Share Hospital (DSH) Reductions |
|||||||||||||||||||||||||
|
The formula for the Medicaid utilization rate is the number of days of care furnished to Medicaid beneficiaries during a given period divided by the total number of days of care provided during the period. (§1923(b)(2) of the Social Security Act.) |
|||||||||||||||||||||||||
|
The "standard deviation" is a statistical measure of the dispersion of hospitals' utilization rates around the average; the use of this measure identifies hospitals whose Medicaid utilization is unusually high. |
|||||||||||||||||||||||||
|
The formula for the low-income utilization rate is the sum of two fractions. The first fraction is total Medicaid revenue for services plus other payments from state and local governments divided by the total amount of hospital revenue for patient services. The second fraction is the total amount of hospital charges for inpatient hospital services minus the total amount of revenue from state and local governments divided by total hospital charges. (§1923(b)(3) of the Social Security Act.) |
|||||||||||||||||||||||||
|
There are exceptions to this rule for children's hospitals, hospitals that do not offer non-emergency obstetric services, and certain rural hospitals. (§1923(d) of the Social Security Act.) |
|||||||||||||||||||||||||
|
|
|||||||||||||||||||||||||
|
Medicaid state plan rate year means the 12-month period defined by a state's approved Medicaid state plan in which the state estimates eligible uncompensated care costs and determines corresponding DSH payments as well as all other Medicaid payment rates. The period usually corresponds with the state's fiscal year or the federal fiscal year but can correspond to any 12-month period defined by the state as the Medicaid state plan rate year. |
|||||||||||||||||||||||||
|
|
|||||||||||||||||||||||||
|
§1923(c) of the Social Security Act. |
|||||||||||||||||||||||||
|
If a state chooses to reimburse according to the type of hospital, the state must ensure that all hospitals of each type are treated equally and payments are reasonably related to the hospitals' Medicaid or low-income patient cost, volume, or proportion of Medicaid or low-income patients. |
|||||||||||||||||||||||||
|
§1923(g) of the Social Security Act. |
|||||||||||||||||||||||||
|
|
38.
|
In California, the hospital-specific cap for public hospitals is 175% of the unreimbursed costs. California's hospital-specific DSH cap for public hospitals was established in the Balanced Budget Act of 1997 (P.L. 105-33) and made permanent by the Medicare, Medicaid, and SCHIP Balanced Budget Refinement Act of 1999 (which was included in the Consolidated Appropriations Act |
|||||||||||||||||||||||
|
§1923(g)(1)(A) of the Social Security Act. |
|||||||||||||||||||||||||
|
HHS, CMS, "Medicaid Program; Disproportionate Share Hospital Payments - Uninsured Definition," 79 Federal Register 71679, December 3, 2014. |
|||||||||||||||||||||||||
|
State Medicaid Directors letter, "Summary of OBRA 93 DSH Limit Requirements," August 17, 1994. |
|||||||||||||||||||||||||
|
| |||||||||||||||||||||||||
| 46. |
HHS, CMS, "Medicaid Program: Disproportionate Share Hospital Payments," 73 Federal Register 77904, December 19, 2008. |
||||||||||||||||||||||||
| 47. |
HHS, CMS, "Medicaid Program; Disproportionate Share Hospital Payments - Uninsured Definition," 79 Federal Register 71679, December 3, 2014. |
||||||||||||||||||||||||
| 43.
|
|
HHS, CMS, "Medicaid Program; Disproportionate Share Hospital Payments - Uninsured Definition," 79 Federal Register 71679, December 3, 2014. 44.
|
|
42 C.F.R. 422.304(d)(4). 45.
|
|
In 2017, MACPAC estimates that 27% of Medicaid enrollees had sources of third-party coverage: Medicare (17% of Medicaid enrollees), private health insurance (13%), Veterans and military health programs (3%), and Indian Health Service (1%). (MACPAC, Report to Congress on Medicaid and CHIP, Chapter 2: Treatment of Third-Party Payments in the Definition of Medicaid Shortfall, June 2019.) 46.
|
|
In the case of the Indian Health Service, Medicaid is not the payer of last resort, and Medicaid pays prior to Indian Health Service. (25 U.S.C. 1603). 47.
|
|
CMS, "Additional Information on DSH Reporting and Audit Requirements," January 2010; CMS, "Medicaid Disproportionate Share Hospital (DSH) Program - Supplemental Upper Payment Limit Payments and Payment for Prison Inmate Care," State Medicaid Director Letter, SMDL #02-013, August 16, 2002. 48.
|
|
Children's Health Care v. Ctrs. for Medicare & Medicaid Servs., 900 F.3d 1022, 1026–27 (8th Cir. 2018); Children's Hosp. of the King's Daughters, Inc. v. Azar, 896 F.3d 615, 623, (4th Cir. 2018); N.H. Hosp. Ass'n v. Azar, 887 F.3d 62, 74 (1st Cir. 2018); Tenn. Hosp. Ass'n v. Azar, 908 F.3d 1029, 1046 (8th Cir. 2018). 49.
|
|
CMS, "Additional Information on DSH Reporting and Audit Requirements," December 2018. 50.
|
|
HHS, CMS, "Medicaid Program; Disproportionate Share Hospital Payment-Treatment of Third Party Payers in Calculating Uncompensated Care Costs," 82 Federal Register 16114, April 3, 2017. 51.
|
|
Missouri Hospital Ass'n v. Azar, No. 2:17-cv-04052 (W.D. Mo. Feb. 9, 2018); Children's Hosp. Ass'n of Texas v. Azar, 300 F. Supp. 3d 190 (D.D.C. Mar. 6, 2018); Baptist Mem'l Hosp.-Golden Triangle, Inc. v. Azar, No. 3:17-cv-491 (S.D. Miss. June 25, 2018). 52.
|
|
Children's Hosp. Ass'n of Texas v. Azar, No. 18-5135, (DC Cir. Aug. 13, 2019). 53.
|
|
Missouri Hospital Ass'n v. Azar, No. 18-1778, (8th Cir. Nov. 4, 2019). 54.
|
|
MACPAC, Report to Congress on Medicaid and CHIP, Chapter 2: Treatment of Third-Party Payments in the Definition of Medicaid Shortfall, June 2019. |
An institution for mental diseases is defined as "a hospital, nursing facility, or other institution of more than 16 beds, that is primarily engaged in providing diagnosis, treatment, or care of persons with mental diseases, including medical attention, nursing care and related services." (§1905(i) of the Social Security Act.) See also §1923(h) of the Social Security Act. |
|
Form CMS-64 Data as of |
|||||||||||||||||||||||||
|
42 C.F.R. §447.297. |
|||||||||||||||||||||||||
|
Form CMS-64 Data as of |
|||||||||||||||||||||||||
|
The 12% limit on DSH allotments caps the federal share of DSH expenditures to no more than 12% of a state's total Medicaid medical assistance expenditures. However, when the federal DSH allotment funds are matched with the state share of the Medicaid DSH payments, a state could provide DSH payments in excess of 12% of its total Medicaid medical assistance expenditures. |
|||||||||||||||||||||||||
|
When DSH allotments were first implemented, states with DSH expenditures greater than 12% of their total Medicaid medical assistance expenditures were classified as "high-DSH" states, and "high-DSH" states did not receive annual increases to their DSH allotment. |
|||||||||||||||||||||||||
|
The |
|||||||||||||||||||||||||
|
Medicaid state plan rate year means the 12-month period defined by a state's approved Medicaid state plan in which the state estimates eligible uncompensated care costs and determines corresponding DSH payments as well as all other Medicaid payment rates. The period usually corresponds with the state's fiscal year or the federal fiscal year but can correspond to any 12-month period defined by the state as the Medicaid state plan rate year. |
|||||||||||||||||||||||||
|
§1923(j) of the Social Security Act. |
|||||||||||||||||||||||||
|
Under §1011 of MMA, hospitals, physicians, and ambulance service providers are eligible for §1011 payments for services furnished to the following types of patients: undocumented aliens; aliens who have been paroled into a United States port of entry for the purpose of receiving eligible services; and Mexican citizens permitted to enter the United States on a laser visa, issued in accordance with the requirements of regulations prescribed under the Immigration and Nationality Act. (CMS, Section 1011: Fact Sheet Federal Reimbursement of Emergency Health Services Furnished to Undocumented Alien.) |
|||||||||||||||||||||||||
|
42 |
|||||||||||||||||||||||||
|
HHS, CMS, "Medicaid Program; Disproportionate Share Hospital Payments," 73 Federal Register 77904, December 19, 2008. |
|||||||||||||||||||||||||
|
|
For more information about the Medicaid DSH reductions, see CRS In Focus IF10422, Medicaid Disproportionate Share Hospital (DSH) Reductions. 68.
|
|
MACPAC, Report to Congress on Medicaid and CHIP, Chapter 1: Improving the Structure of Disproportionate Share Hospital Allotment Reductions, March 2019. 69.
|
|
Michelle M. Stein, "Grassley Is Considering Changes To Medicaid DSH Formula," Inside Health Policy, March 13, 2019; Susannah Luthi, "Congress Eyes Temporary Delay to DSH Cuts," Modern Healthcare, September 17, 2019. |
Tennessee and Hawaii have had special statutory arrangements for their federal DSH funding since FY2007. |
|||||||||||||||||||
|
The definition of "low-DSH" state has changed over the years. |
|||||||||||||||||||||||||
|
§1923(f)(2) of the Social Security Act. |
|||||||||||||||||||||||||
|
HHS, CMS, "Medicaid Program; Disproportionate Share Hospital Payments," 69 Federal Register 15850, March 26, 2004. |
|||||||||||||||||||||||||
|
Ten states were classified as extremely low DSH states for FY2001 and FY2002: Arkansas, Idaho, Iowa, Montana, Nebraska, North Dakota, South Dakota, Utah, Virginia, and Wisconsin. |
|||||||||||||||||||||||||
|
HHS, CMS, "Medicaid Program; Disproportionate Share Hospital Payments," 69 Federal Register 15850, March 26, 2004. |
|||||||||||||||||||||||||
|
This is referred to as the "DSH dip." |
|||||||||||||||||||||||||
|
HHS, CMS, "Medicaid Program; Disproportionate Share Hospital Payments," 69 Federal Register 15850, March 26, 2004. |
|||||||||||||||||||||||||
|
Ibid. |
|||||||||||||||||||||||||
|
|
§1115 of the Social Security Act gives the Secretary of HHS authority to approve experimental, pilot, or demonstration projects that promote the objectives of the Medicaid and CHIP programs. 80.
|
|
TennCare is the name of Tennessee's Medicaid program, which operates under a Section 1115 waiver. 81.
|
|
This amount is one-fourth of $305,451,928, which was the DSH allotment for Tennessee for each year from FY2007 to FY2011. 82.
|
|
$70,108,895 = $22,908,895 (i.e., 30% of $76,362,982) + $47,200,000. |
The ARRA increase to DSH allotments did not apply to the allotments for Hawaii and Tennessee. |
|||||||||||||||||
|
§5001(e) of ARRA specifies that the ARRA temporary increase to the FMAP does not apply to DSH payments. |