The U.S. fruit and vegetable industry entered 2020 following a difficult 2019 characterized by both lower prices and reduced production in some sectors. By broad market category, the U.S. Department of Agriculture (USDA) reported that grower prices for both fruits and tree nuts1 and vegetables and pulses2 began 2020 at low levels, with expectations for continued price declines.
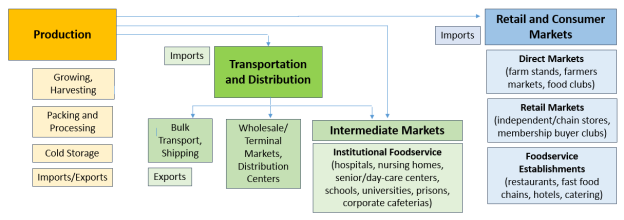
In mid-March 2020, the foodservice industry, which accounts for a substantial share of the produce industry's sales, was largely shut down as most states closed all but essential businesses in response to the coronavirus (COVID-19) public health emergency. This situation resulted in major supply chain disruptions for the U.S. produce industry. Reportedly, up to one-half of the produce industry sells its products to foodservice distributors (e.g., Sysco Corporation, U.S. Foods), according to former California Agricultural Commissioner A.G. Kawamura,3 which in turn supply schools, restaurants, and other institutional customers (Figure 1). The sudden decrease in the foodservice market left many produce growers with nowhere to sell their crops. Given the highly perishable (non-storable) nature of most fresh fruits and vegetables, many growers were unable to pivot quickly to other marketing channels. Some growers reportedly resorted to plowing under their fields to avoid incurring the added costs of harvesting, cooling, and packaging. Some sectors are reporting plans to reduce acreage due to loss of foodservice demand.4
Another up to one-half of the produce industry reportedly relies on sales to larger retail chain stores (e.g., Walmart or membership clubs such as Costco) with some produce growers selling nearly all of their production to some combination of the foodservice market and larger retail chain stores. Fruits and vegetables also are sold to wholesale distributors and produce markets that serve independent grocery stores and restaurants. Direct-to-consumer sales of fruits and vegetables comprise a small portion of total U.S. produce sales. Available data from the 2017 Census of Agriculture indicate that the value of all food sold directly to consumers accounted for an estimated 3% of the value of total U.S. agricultural production.5 Figure 1 broadly depicts the U.S. value chain and the various produce marketing channels.
The U.S. produce sector is highly streamlined and specialized. Many perishable produce items are pre-sold and packaged in bulk to certain specifications, and producers cannot readily shift such items from one marketing channel to another. Most produce is planted, harvested, packed, and shipped to a precise schedule to replenish stores' inventories "just in time," according to a University of California report.6 This limits the industry's flexibility in responding to market disruptions. Cash flow concerns pose an added challenge to produce growers, according to A.G. Kawamura, especially if a business's supplier or buyer defaults on a commitment, or is unable to deliver supplies or move outgoing products due to the current pandemic.7
Challenges for the U.S. produce industry are further compounded by ongoing agricultural labor concerns. Fruit and vegetable production is labor-intensive and few automation/mechanization options are available for handling perishable fruits and vegetables. On April 15, 2020, in an effort to lessen labor disruption impacts on the industry, the Department of Homeland Security and USDA announced a temporary final rule to change certain H-2A visa requirements.8 Related concerns involve the potential effects if farmworkers and other produce industry workers become ill from the virus, as happened in some U.S. meatpacking plants. COVID-19 outbreaks have disrupted meat processing and caused some shortages of certain meat products in grocery stores.9
Market Overview Based on Limited Aggregated Data
Analysis of producer price changes for fruits and vegetables is complicated given the sheer number of crops and markets in the U.S. produce industry. Spot market prices for selected fruits and vegetables (i.e., price paid in the physical market, and not a futures/contract price or paper transaction) are available through USDA's Specialty Crop Market News.10 These pricing data cover roughly 790 commodities across 1,450 terminal markets in 11 U.S. locations.11 A compilation of these data from USDA, as posted by The Packer magazine,12 suggests that prices for all fruits and vegetables in April 2020 averaged more than 10% lower compared to April 2019. These aggregate data mask differences in price performance for individual crops.
Other more readily accessible data are available from the Federal Reserve Bank of St. Louis based on aggregated Producer Price Indexes (PPI) for farm goods compiled by the U.S. Bureau of Labor Statistics.13
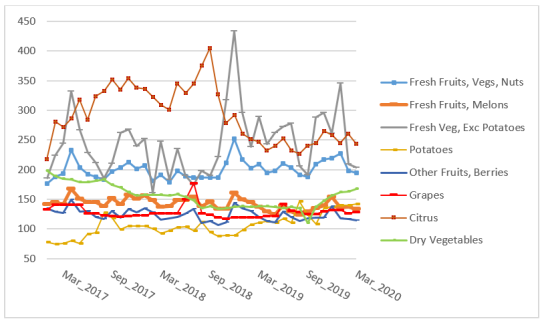
Figure 2 shows monthly PPI for selected product groupings (March 2015 through March 2020). Data are not yet available for April. In aggregate, PPI for all fruits and all vegetables have roughly followed seasonal pricing cycles from previous years. As shown, price changes vary depending on the crop. Price variability may also be by growing location and other factors. A University of California report, for example, shows how recent price fluctuations differ among red potatoes (marked by increasing prices), green bell peppers (decreasing prices), and navel oranges (stable prices), which the researchers attributed to each crop's relative storability.14
Table 1 ranks the leading fruit, vegetable, and tree nut producing states in terms of the number of farms and farm-gate sales in 2017. At the farm level, the value of U.S. market sales for all fruits, vegetables, and tree nuts totaled $48.2 billion in 2017.15
|
Figure 2. Producers Prices Indexes (PPI) for Selected Fruits and Vegetables |
 |
|
Source: CRS from Federal Reserve Economic Data, Producer Price Indexes (PPI) for Farm Products (https://fred.stlouisfed.org/release/tables?rid=46&eid=142105#snid=142107). Data are monthly, not seasonally adjusted. March 2020 are the most recent available data. |
Table 1. Sales of Fruit, Vegetables, and Tree Nuts, Selected States (2017)
Sales in millions of dollars
|
Fruits, Tree Nuts, Berries |
Vegetables, Melons, Potatoes |
|||||
|
State |
Number of Farms |
Sales |
Number of Farms |
Sales |
Total Sales |
Share |
|
California |
35,087 |
19,708.7 |
5,048 |
8,167.8 |
27,876.5 |
58% |
|
Washington |
5,237 |
3,614.9 |
2,437 |
1,094.9 |
4,709.8 |
10% |
|
Florida |
6,650 |
1,298.7 |
1,835 |
1,284.1 |
2,582.8 |
5% |
|
Idaho |
532 |
25.1 |
1,355 |
1,147.1 |
1,172.2 |
2% |
|
Oregon |
4,923 |
612.1 |
2,112 |
539.2 |
1,151.4 |
2% |
|
Arizonaa |
818 |
(D) |
1,115 |
1,009.1 |
1,009.1 |
2% |
|
Georgia |
3,865 |
421.8 |
1,899 |
566.4 |
988.2 |
2% |
|
Michigan |
2,876 |
440.7 |
3,089 |
535.1 |
975.8 |
2% |
|
New York |
3,083 |
399.8 |
3,588 |
378.7 |
778.5 |
2% |
|
Wisconsin |
1,942 |
177.4 |
3,184 |
543.0 |
720.4 |
1% |
|
North Carolina |
2,205 |
109.1 |
3,508 |
553.4 |
662.6 |
1% |
|
Texas |
5,714 |
213.3 |
2,221 |
352.4 |
565.7 |
1% |
|
Minnesota |
1,118 |
25.8 |
2,860 |
383.3 |
409.1 |
1% |
|
New Jersey |
949 |
141.3 |
1,390 |
222.5 |
363.8 |
1% |
|
Pennsylvania |
2,978 |
171.6 |
4,266 |
187.3 |
358.9 |
1% |
|
All Other |
32,017 |
1,221 |
35,413 |
2,620 |
3,840 |
8% |
|
Total U.S. |
109,994 |
28,581.4 |
75,320 |
19,584 |
48,165 |
100% |
Source: CRS from USDA Quick Stats (https://quickstats.nass.usda.gov/). Reflects most recent available data from the 2017 Census of Agriculture. States ranked based on share of total fruit, vegetable, and tree nut sales. Individual state figures may not add to total U.S. figures due to rounding.
Notes: (D) = Withheld to avoid disclosing data for individual operations. Totals shown exclude withheld totals for some states to avoid disclosing individual operations. Vegetable category includes sweet potatoes. Tree nuts exclude peanuts.
a. State total reflects vegetable, melon, and potato sales only, as sales data for fruits, tree nuts, and berries not disclosed.
USDA Assistance
On April 17, 2020, USDA announced the Coronavirus Food Assistance Program (CFAP), which is to provide $19 billion in emergency aid to farmers and ranchers to address ongoing market disruptions.16 CFAP includes $16 billion in direct payments to producers and $3 billion in purchases. Details have not been finalized by USDA, but Senator John Hoeven issued a statement,17 according to which the produce sector may expect about $2.1 billion in direct payments and one-third of the $3 billion in purchases. In addition to the CFAP, USDA has announced its plans to buy $470 million of agricultural commodities, including $170 million in specialty crops, for delivery beginning in July.18 Purchases include: asparagus ($5 million), orange juice ($25 million), pears ($5 million), potatoes ($50 million), prunes ($5 million), raisins ($15 million), strawberries ($35 million), sweet potatoes ($10 million) and tart cherries ($20 million). USDA's purchase plan is to establish "Farmers to Families Food Boxes" consisting of fresh fruits and vegetables, meat, and/or dairy products, or some combination of these products for delivery to food banks and other nonprofits,19 which could help provide additional distribution and procurement options for U.S. agricultural producers. USDA stated it would begin purchasing an estimated $100 million per month each for fresh produce, livestock (pork and chicken), and dairy products. USDA has said the purchase and distribution of these commodities will begin in May 2020.
For the direct payment portion of the CFAP, according to Senator Hoeven's statement, agricultural producers would receive a payment based on 85% of price losses that occurred between January 1 and April 15, 2020, and a second payment for 30% of losses occurring from April 15 through the following two quarters. Producers may be subject to a payment limit of $125,000 per commodity and an overall limit of $250,000 per individual, but USDA has not yet indicated this specifically. The statement notes that USDA is expediting its rulemaking to begin enrollment in May and to distribute initial payments by early June.
Producer Response
Industry groups have expressed appreciation for the support that USDA announced, but claim the amounts fall short of expected industry losses. Some industry stakeholders assert that a $250,000 payment limit per entity (as described in Senator Hoeven's statement) is insufficient for the produce industry's high-value crops. On April 23, 2020, 28 Senators sent a letter to President Trump requesting these limits be removed for specialty crop, livestock, and dairy producers.20 A group of 126 Members of the House sent a similar letter.21
Beyond the USDA food purchase plans, the U.S. fruit and vegetable industry continues to consider alternative produce distribution options to expand beyond the more traditional foodservice and chain store sectors, including various direct-to-consumer sales and streamlined government procurement options. The United Fresh Produce Association (UFPA), an industry trade association, maintains a COVID-19 resources page with information for the fresh produce industry with specific information on how to access these and other support programs.22
