Introduction: U.S. Natural Gas Sets a High Mark
|
1998 |
2008 |
2018 |
|
|
Production |
2 |
2 |
1 |
|
Consumption |
1 |
1 |
1 |
|
Imports |
1 |
1 |
3 |
|
Exports Pipeline Liquefied Natural Gas (LNG) |
11 8 7 |
9 6 16 |
4 4 4 |
|
Primary Energy |
29 |
33 |
28 |
Source: BP Statistical Review of World Energy, https://www.bp.com/content/dam/bp/business-sites/en/global/corporate/pdfs/energy-economics/statistical-review/bp-stats-review-2019-full-report.pdf.
Notes: Primary Energy ranks countries by the percent of natural gas as a primary energy source.
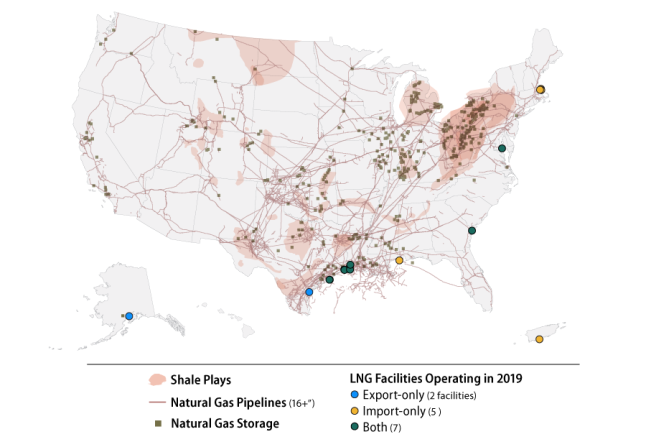
In 2019, the United States stands atop the international natural gas world.1 The United States is the largest producer of natural gas (NG) (Figure 11), is the largest consumer of natural gas, has the most natural gas storage capacity, and has the biggest and most expansive pipeline network. Production from shale formations (Figure 7) has transformed the United States from a growing importer of natural gas to an increasing exporter (Figure 12), with some of the lowest prices in the world (Figure 10). The United States is the 4th largest exporter of natural gas (Figure 17), but its capacity by pipeline and by ship is growing. How the United States transformed its natural gas sector is a story of market competition, technological innovation, and other factors. As natural gas has played a bigger role in the U.S. economy, congressional interest in it has grown, as measured by the number of bills introduced (Figure 19).
1998–2008: Prices Spark Innovation
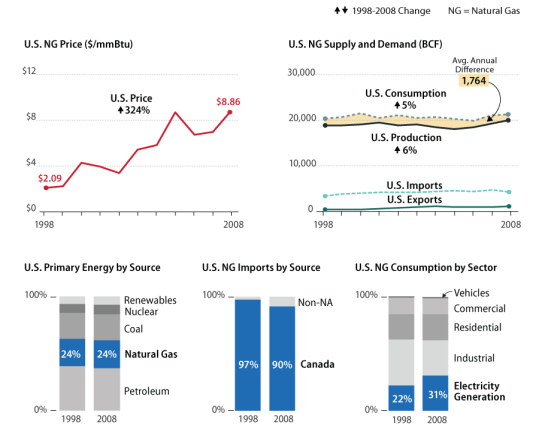
In 1998, the United States was the 2nd largest national producer of natural gas behind Russia (Figure 11), and the largest consumer.2 U.S. consumption outpaced production that year by more than 1,400 billion cubic feet (BCF) or 7% of consumption, and the United States was viewed as a growing importer of natural gas. Natural gas comprised 24% of the U.S. energy mix in 1998, and that figure remained unchanged in 2008. Canada supplied about 97% of U.S. imports in 1998.3 Between 1998 and 2008, the difference between U.S. production and consumption averaged 1,764 BCF annually. In 1998, U.S. natural gas consumption was mainly in the industrial sector, but by 2008 natural gas used to generate electricity equaled its use in the industrial sector. During this same time period, average annual U.S. natural gas prices quadrupled, reaching a peak in June, 2008.
|
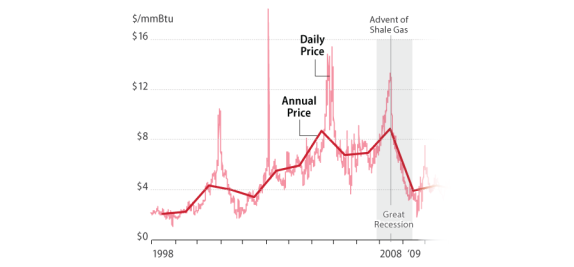
Figure 2. The Impetus for Change Rising Prices and Growing Demand |
 |
|
Source: U.S. Energy Information Administration (EIA), https://www.eia.gov/naturalgas/. Notes: The NG price represented above is the spot price, the current market price at which natural gas may be bought and sold. BCF = billion cubic feet. $/mmBtu = U.S. dollars per million British thermal units. |
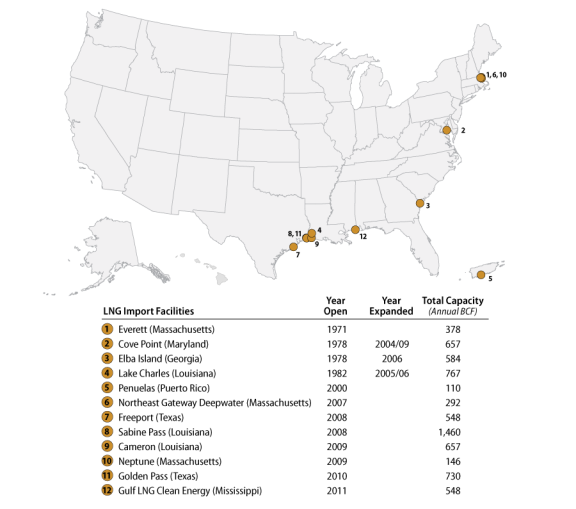
From 1998 to 2008, the United States added to its LNG import capacity by expanding existing facilities and constructing new import terminals. Import capacity in 2008 was almost 4,800 BCF, with an additional 2,000 BCF added later. There were also more than 20 additional import projects at various stages of development, most of which were never built because the market did not need additional import capacity as the United States moved toward being an exporter.
 |
|
Source: S&P Global Platts, March 2019. Notes: BCF = billion cubic feet. |
Shale Gas: Technological Breakthroughs
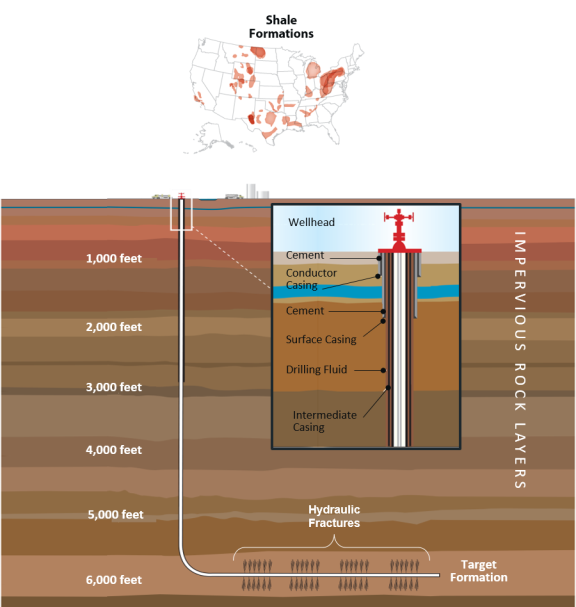
In the mid-2000s, as LNG import terminals were capturing headlines in the U.S. effort to meet growing demand, some small and mid-size production companies were trying to figure out how to produce the massive resources of natural gas that were trapped in shale formations. Multi-stage hydraulic fracturing and improved directional drilling capability were the keys to unlocking these resources.
 |
|
Source: American Petroleum Institute (API), modified by CRS. Notes: Although hydraulic fracturing is an enhanced recovery technique used by the oil and natural gas industry for decades, advances in the technology were needed to enable cost-effective production of natural gas from shale and other low permeability rocks. This graphic shows a simplified representation of the two key advances, horizontal drilling and multi-stage hydraulic fracturing. |
During this time, there were wide swings in U.S. daily natural gas prices as market conditions changed, sometimes quickly. Nevertheless, prices trended upward until the loss of economic activity from the Great Recession decreased demand. As prices rose, interest in developing shale gas grew.
 |
|
Source: EIA, https://www.eia.gov/dnav/ng/hist/rngwhhdd.htm, and BP Statistical Review of World Energy, p. 37, https://www.bp.com/content/dam/bp/business-sites/en/global/corporate/pdfs/energy-economics/statistical-review/bp-stats-review-2019-full-report.pdf. Notes: Demand for natural gas is closely linked to economic activity; however, short-term price spikes tend to be weather related. $/mmBtu = U.S. dollars per million British thermal units. |
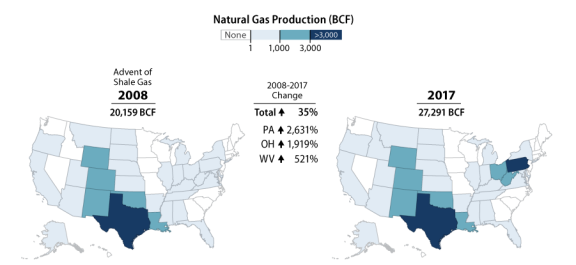
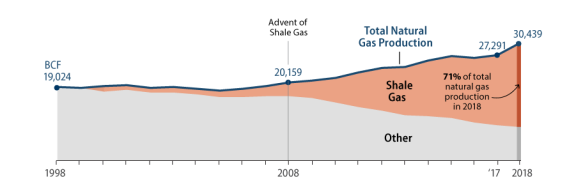
Shale gas started to come to market near the end of 2008 concurrent with the start of the Great Recession. The increased supply of natural gas, together with reduced demand, caused prices globally to plummet (Figure 10). New production in the northeast, especially in Pennsylvania, began to grow rapidly. The percentage of U.S. natural gas production from shale also started to rise.
 |
|
Source: EIA, https://www.eia.gov/dnav/ng/ng_prod_sum_a_EPG0_FPD_mmcf_a.htm. Notes: 2017 is the latest year for which EIA has reported natural gas production by state. The Marcellus Field in Pennsylvania catapulted production in that state as well as Ohio and West Virginia. BCF = billion cubic feet. |
 |
|
Source: EIA, https://www.eia.gov/dnav/ng/ng_prod_shalegas_s1_a.htm. Notes: The U.S. natural gas industry knew there were large quantities of natural gas in shale formations, but could not produce the gas economically in significant quantities until 2008. BCF = billion cubic feet. |
2008–2018: Growing Importer to Net Exporter
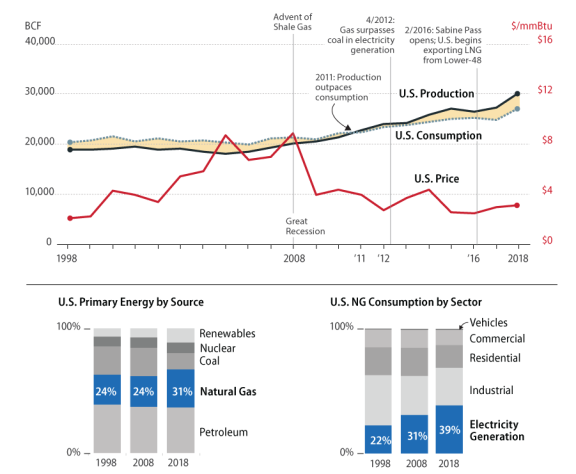
Between 2008 and 2018, U.S. production and consumption of natural gas rose, 51% and 28%, respectively, while domestic prices fell about 65%. Despite the fall in prices, U.S. production continued to increase almost every year between 2008 and 2018. The cost of producing shale gas fell as the industry innovated to remain competitive. In 2011, U.S. production started to outpace consumption and the interest in exporting U.S. natural gas took hold. During this period, natural gas became more incorporated in the nation's energy mix, especially in the electrical sector.
 |
|
Source: EIA, https://www.eia.gov/naturalgas/. Notes: Natural gas produced with oil, known as associated gas, has been rising as U.S. oil production in tight formations has also increased. Sabine Pass the name of the first LNG export terminal in the lower-48 states and is owned by the company Cheniere Energy. BCF = billion cubic feet. $/mmBtu = U.S. dollars per million British thermal units. |
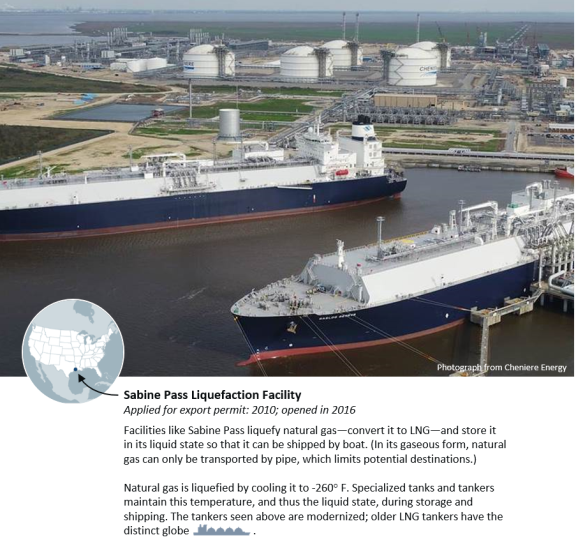
As U.S. prices fell, the world took note. In 2010, Cheniere Energy became the first U.S. company to apply for a permit to export U.S. natural gas from the lower-48 states from its Sabine Pass facility (which was originally an import terminal), transporting it as LNG.4 Liquefaction facilities like Sabine Pass liquefy natural gas—convert it to LNG—and store it in liquid state so that it can be shipped globally in specialized tankers. Liquefaction of natural gas is achieved by cooling the gas to -260" F. At this temperature, the natural gas becomes a liquid and occupies only 1/600th of its gaseous volume making it economical to send by ship.
 |
|
Source: Photograph from Cheniere Energy. Text and map from CRS. Notes: During shipping, the -260"F temperature must be maintained or the LNG will regasify. |
U.S. companies were looking to exports of natural gas for additional demand and a way to access higher world prices. As the global economy improved, natural gas prices outside the United States began to climb, which increased the number of companies looking to export U.S. natural gas.
|
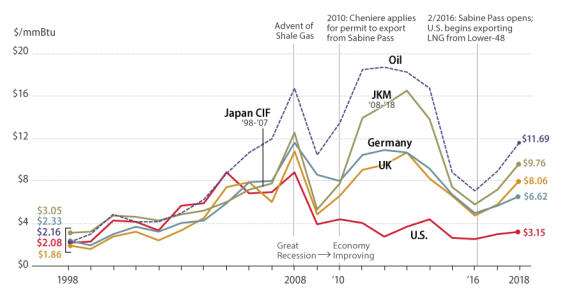
Figure 10. U.S. Natural Gas Prices Delink from Other Markets |
 |
|
Source: BP Statistical Review of World Energy, p. 37, https://www.bp.com/content/dam/bp/business-sites/en/global/corporate/pdfs/energy-economics/statistical-review/bp-stats-review-2019-full-report.pdf. Notes: U.S. natural gas prices delinked from oil and the rest of the world after the Great Recession and the rise in shale gas production. JKM is the current Asian spot price, also known as the Japan Korea Marker. Prior to 2008, the Asian spot prices was referred to as Japan CIF, which stands for cargo, insurance, and freight. $/mmBtu = U.S. dollars per million British thermal units. |
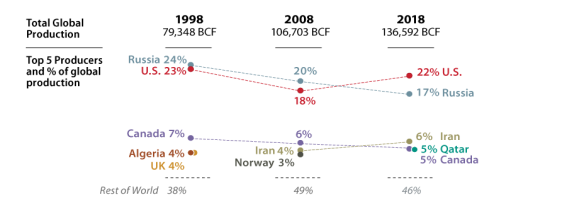
By the end of 2009, the United States surpassed Russia as the world's largest producer of natural gas. Global production of natural gas rose 28% between 2008 and 2018. U.S. production outpaced other producers and its share of the global natural gas market rose from 18% to 22%, while Russia's fell from 20% to 17%.
 |
|
Source: BP Statistical Review of World Energy, p. 32, https://www.bp.com/content/dam/bp/business-sites/en/global/corporate/pdfs/energy-economics/statistical-review/bp-stats-review-2019-full-report.pdf. Notes: Some countries experienced declines in economically producible resources, while other countries were developing their resources, which led to changes in production rankings. The United States became the largest natural gas producer in 2009. BCF = billion cubic feet. |
U.S. Exports on the World Stage
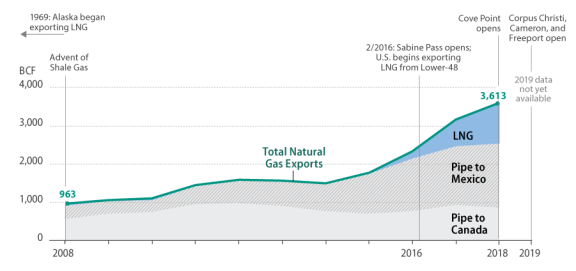
The United States did not begin exporting LNG from the lower-48 states until February 2016. However, export of natural gas by pipeline, mainly to Mexico, more than doubled during the 2008 and 2018 timeframe.5 Mexico imported two-thirds of U.S. pipeline exports and about half of all U.S. gas exports in 2018.
 |
|
Source: EIA, https://www.eia.gov/dnav/ng/ng_move_expc_s1_a.htm. Notes: BCF = billion cubic feet. Sabine Pass, Cove Point, Corpus Christi, Cameron, and Freeport are LNG ports that are open or scheduled to open in 2019. |
U.S. LNG export capacity is on the rise, with six different facilities in operation in 2019 with a capacity of approximately 2,700 billion cubic feet per year or 7.32 BCF per day. The United States is the world's 4th largest exporter of natural gas overall, and the 6th largest LNG exporter (Figure 17). With another 3,000 BCF per year under construction, the United States is poised to rise in the export rankings and may have the most capacity, worldwide, within the next five years.
|
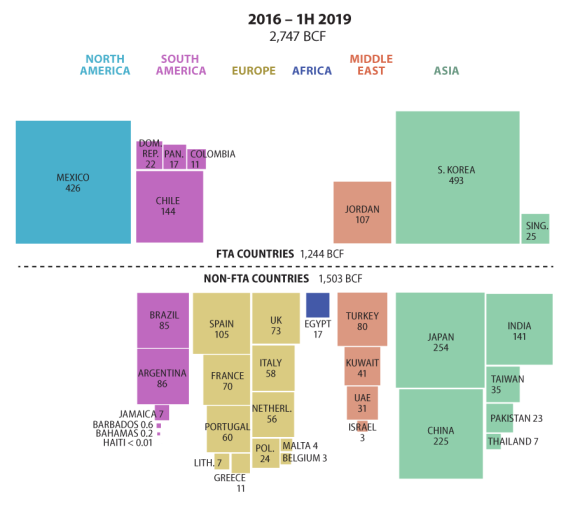
Figure 13. Growing U.S. LNG Infrastructure U.S. LNG Goes to the World |
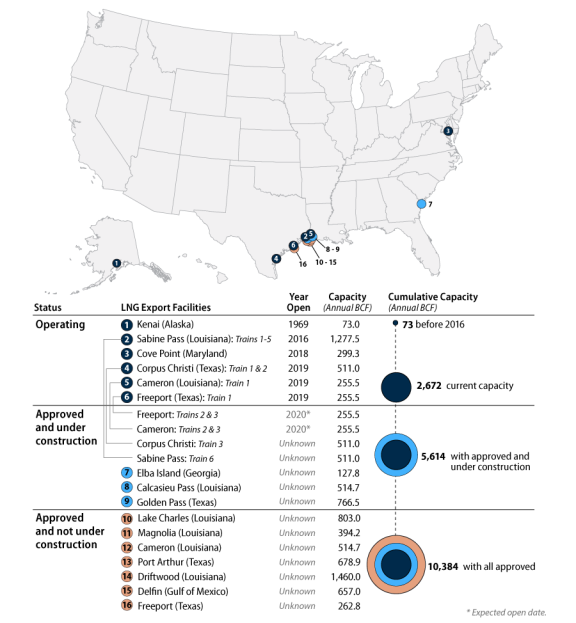 |
|
Source: S&P Global Platts, March 2019. Notes: BCF = billion cubic feet. |
Regionally, Asian countries have imported the most LNG from the United States (44%). Within Asia, the nations of South Korea, Japan, China, and India are the biggest consumers. However, in the first half of 2019, China's imports of U.S. LNG declined by 83% over the same time period in 2018, in part because of the trade dispute between the countries. Thirty-six countries have imported U.S. LNG since 2016.6 Almost half the gas has gone to countries with which the United States has a free trade agreement, a stipulation for an expedited Department of Energy permit. Both South Korea and Mexico, the two largest overall importers of U.S. LNG exports, have free trade agreements with the United States.
Conclusion: Growth of Natural Gas Continues
Between 2016 and the first half of 2019, U.S. LNG exports have grown by 489%. On a monthly basis, LNG exports were largest in May 2019 and are expected to continue to grow as additional port facilities become operational. Meanwhile, there has been no corresponding rise in U.S. natural gas prices due to increased exports.
 |
|
Source: EIA, https://www.eia.gov/naturalgas/data.php#imports and https://www.eia.gov/outlooks/aeo/data/browser/#/?id=76-AEO2019&cases=ref2019&sourcekey=0. Notes: BCF = billion cubic feet. |
Since February 2016, there has been about, on average, a $1.74 price differential between U.S. spot prices and U.S. LNG export prices. In addition to the price of U.S. spot natural gas, the current price at which natural gas can be bought or sold, importers take into account the cost of liquefying the natural gas, transporting it, regasifying it, and moving it to consumers. Natural gas is expensive to liquefy and transport and requires sophisticated technology.
|
Figure 16. Export Growth Produces Little Effect on Domestic Natural Gas Prices |
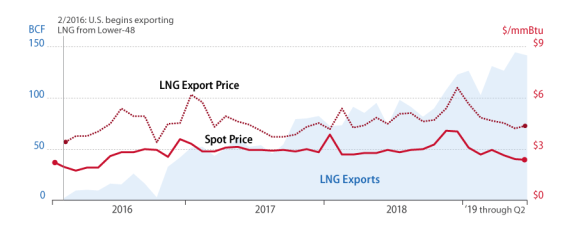 |
|
Source: EIA, https://www.eia.gov/dnav/ng/hist/rngwhhdd.htm and DOE. Notes: The spot price is the current market price that natural gas may be bought and sold. BCF = billion cubic feet. $/mmBtu = U.S. dollars per million British thermal units. |
Even though the United States is the largest producer of natural gas in the world, it is not the largest exporter. Russia, mainly through its pipeline exports to Europe, remains the largest overall exporter of natural gas. Qatar was the largest exporter of LNG in 2018, but Australia is projected to surpass it in 2019.
|
Figure 17. United States Rising in the Ranks of Natural Gas Exporters |
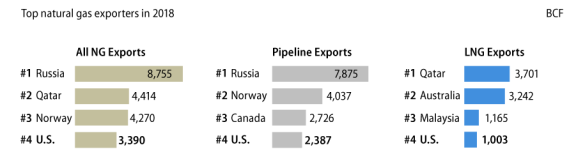 |
|
Source: BP Statistical Review of World Energy, pp. 40-41, https://www.bp.com/content/dam/bp/business-sites/en/global/corporate/pdfs/energy-economics/statistical-review/bp-stats-review-2019-full-report.pdf. Notes: BCF = billion cubic feet. |
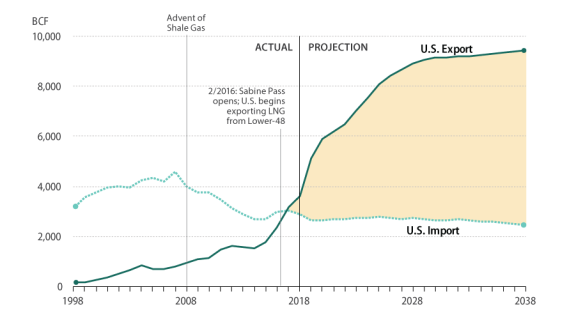
Whereas the United States was the target market for LNG exporters in 2008, it is now a net exporter of natural gas and has seen its imports diminish by 27% since 2008. Industry analysts expect U.S. exports to rise significantly over the next few years. LNG now accounts for 35% of global natural gas trade.
|
Figure 18. Continued Growth Projected for Natural Gas 1998-2038 |
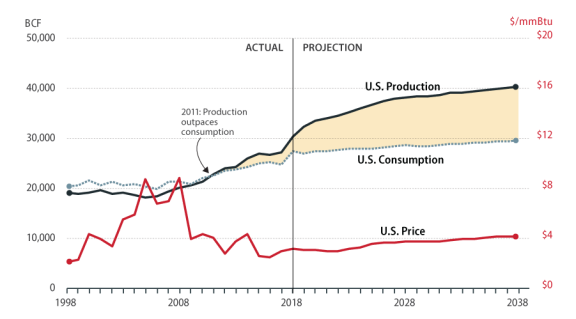 |
|
Source: EIA, https://www.eia.gov/naturalgas/ and https://www.eia.gov/outlooks/aeo/data/browser/. Notes: EIA projections assume that current market conditions and U.S. policy continue throughout the time period. BCF = billion cubic feet. $/mmBtu = U.S. dollars per million British thermal units. |
Energy issues have been a perennial topic of interest to Congress. Natural gas, especially since the advent of shale gas, has grown in importance and congressional interest. Exports of natural gas by pipeline and particularly LNG by ship have added to the significance of natural gas' interest to Congress. In the 116th Congress, 100 bills have been introduced covering a wide variety natural gas related topics, from production, exports, infrastructure, the environment, and employment, among other things.
|
Figure 19. Congressional Interest Grows as Natural Gas Plays a Bigger Role |
 |
|
Source: http://www.congress.gov. Notes: CRS searched the Congress.gov website for any bill introduced since the 105th Congress that contained the term "natural gas." Each Congress encompasses two years. The 105th Congress includes 1998, which is the beginning of the time period for most of analysis in this report. The 116th Congress only includes 2019 data. |