Introduction
Household debt among older Americans—including mainly residential debt, auto loans, student loans, and credit cards—has grown substantially from 1989 to 2016.1 The proportion of households headed by individuals aged 65 and older (hereinafter referred to as elderly households) who held any debt increased from 37.8% to 61.1%, and the real median household debt among elderly households with debt increased from $7,463 to $31,050 (in 2016 dollars).2
The increase in debt among older Americans has raised concerns about financial security for people near or during retirement for several reasons. First, Americans aged 65 and older represent a large and growing proportion of the U.S. population. Over the next 20 years, the share of the U.S. population aged 65 and older is expected to increase from about 17% to 22%.3 The increase in debt, together with the aging population, suggests that a large group of older Americans are not retiring debt free. Second, many older Americans, especially low-income people, rely on Social Security or other government-sponsored income transfers as their major sources of income.4 Increases in household debt might require retirees to devote a larger share of their fixed income and savings toward paying debt. Excessive debt payments may put more seniors, especially those living on limited incomes, at greater risk of financial insecurity. Third, researchers have shown that higher levels of debt may increase psychological stress and decrease physical health.5 These effects may be exacerbated for older people, as they usually have fixed income and limited ability to offset higher monthly debt obligations by working more.
This report presents evidence of the increase in debt from 1989 to 2016 among households headed by those aged 65 and older, using Survey of Consumer Finances (SCF) data.6 The discussion focuses on changes in the percentage of households holding debt; in median and average household debts; in selected types of debt; and in relative measures, such as the debt payments-to-income ratio and the total debt-to-asset ratio. This report also analyzes how household debt among older Americans varies across different age groups and asset distributions, and it explores various groups of elderly households with the largest debt burdens. Major types of debt discussed in this report mainly include residential debt, auto loans, student loans, and credit card balances. Nonloan debt—such as medical debt, past-due utility and other bills, and government-assessed fines and fees—is not covered in this report, because the population with those debts tends to be underrepresented in the SCF.
Household Debt by Age
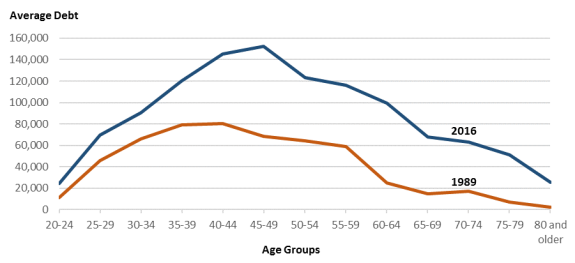
Traditional life-cycle theories predict that people tend to borrow in young adulthood when incomes are low but some costs such as education and housing are high, continue to borrow but at a slower pace during middle age as income and expenses converge, and then slowly deleverage through old age as they pay down debt.7 The SCF data show that Americans' debt experiences have generally conformed to life-cycle theories' predictions. During 1989 to 2016, the share of households who held any debt and the median and average level of household debts were highest among those headed by Americans aged 35 to 54 and lower among younger and older ages.8
In the past three decades, debt among households headed by individuals aged 65 and older grew faster than that among households headed by those aged 64 and younger. In 2016, average household debt increased from $59,134 in 1989 to $110,204 (in 2016 dollars) for households whose head was between the ages of 20 and 64, an increase of 86%, whereas the average household debt grew from $11,278 to $53,269 (in 2016 dollars) for households headed by those aged 65 and older, an increase of 372%. The average household debt nearly doubled for households in age groups younger than age 60, but it increased by about 4 times for the age groups 60-64, 65-69, and 70-74; by about 7 times for the age group 75-79; and by more than 10 times for the age group 80 and older (see Figure 1).
Trends in Household Debt Among Older Americans
From 1989 to 2016, debt increased among households whose head was aged 65 and older. Both the share of elderly households with any debt and the median and average levels of debt have increased. Household debt includes mortgages, auto loans, student loans, and credit cards, as well as other debt products.9
Share of Elderly Households Holding Debt and Median and Average Debt
From 1989 to 2016, the share of households headed by individuals aged 65 and older who held debt increased, as did median and average household debt among elderly households with debt (see Figure 2). In 1989, about 37.8% of elderly households held debt, whereas in 2016 the share increased to 61.1%. The median debt of those elderly households with debt increased from $7,463 to $31,050 (in 2016 dollars) during the same time, and the real average debt increased from $29,918 to $86,797.10 The median debt lies at the middle of the debt distribution, and the average debt is generally higher than the median debt because a relatively small percentage of people have very high debt.
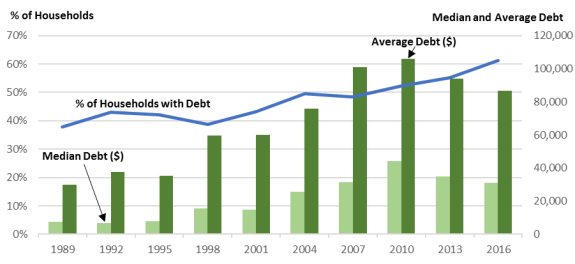
The share of elderly households holding any debt has generally trended upward from 1989 to 2016. However, median and average debt peaked in 2010, the year after the 2007-2009 economic recession, and declined from 2010 to 2016. In 2016, the median amount of debt was about the same as in 2007, before the economic recession, and the average amount of debt was at about the midpoint of the averages in 2004 and 2007.11
The financial crisis might have had a profound effect on the older population for several reasons. First, older people are likely to have been affected by employment instability. Research suggests that when the elderly lose jobs, it takes them significantly longer to find new ones, and their new jobs, if any, typically pay less than their previous jobs.12 Second, defined contribution (DC) retirement plans have replaced defined benefit (DB) plans, and they have become an important source of income for older Americans.13 Unlike DB plans, which provide a steady stream of income during retirement, DC plans fluctuate in value with the financial market, and their value depends in part on employees' investment skills. Employees generally bear the risk in DC plans.14 A recent study indicates that individuals' retirement account mismanagement and the large drop in the stock market during the financial crisis reduced potential retirement income for many older Americans during the past decade.15
Components of Debt
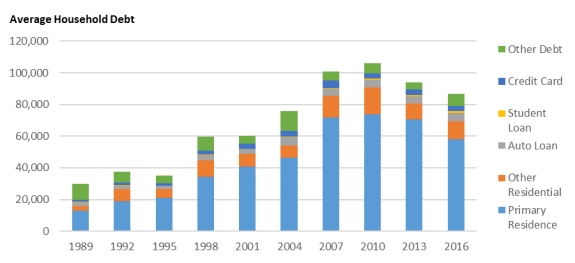
The growth in average household debt between 1989 and 2016 largely came from mortgages (see Figure 3), including both debt secured by a primary residence (from $12,970 to $57,943 in 2016 dollars) and debt for other residential properties (from $2,970 to $11,446 in 2016 dollars).16 In addition, the increase in auto loans (from $2,437 to $5,262) may explain part of the growth in household debt among elderly households. In 2016, primary residential mortgages accounted for 66.8% of overall elderly household debt on average, other residential debt for 13.2%, auto loans for 6.1%, student loans for 1.5%, credit card balances for 3.5%, and other debts for 8.9%.17
Residential loans are usually considered long-term wealth builders, as the residence's market value may increase over time, which is generally not true for auto loans or credit card debt. Researchers have found that both residential and nonresidential debt may contribute to debt-related stress for older households, but residential debt is much less stressful than other debt, such as credit card debt.18
Selected Components of Debt
The share of elderly households who held certain selected types of debt, such as debt on a primary and other residences, auto loans, student loans, and credit card balances, increased from 1989 to 2016. The median amounts of those types of debt have also increased among elderly households with those debts.
Debt Secured by Residential Properties19
The share of elderly households who held debt secured by a primary residence increased from 15.4% in 1989 to 33.4% in 2016 (see Table 1). During the same time, the median primary residential debt among those households with residential debt increased from $16,793 to $72,000 in real 2016 dollars (see Table 2). Studies suggest that much of the growth through 2007 might have resulted from the increased availability of mortgage credit during the build-up to the financial crisis.20 Some research indicates that millions of older Americans are carrying more mortgage debt than ever before, and recent cohorts have taken on more mortgage debt mostly because they purchased more expensive homes with smaller down payments.21 Since 2010, some scholars argue that tightening mortgage underwriting standards have made it more difficult for young borrowers to qualify for mortgages. Consequently, this trend has resulted in a shift of new mortgage originations toward older borrowers and an increase in the ages of borrowers with existing debt.22
|
Year |
Any Debt |
Primary Residence |
Other Residential |
Auto Loan |
Student Loan |
Credit Card |
||||||||||||
|
1989 |
|
|
|
|
|
|
||||||||||||
|
1992 |
|
|
|
|
|
|
||||||||||||
|
1995 |
|
|
|
|
|
|
||||||||||||
|
1998 |
|
|
|
|
|
|
||||||||||||
|
2001 |
|
|
|
|
|
|
||||||||||||
|
2004 |
|
|
|
|
|
|
||||||||||||
|
2007 |
|
|
|
|
|
|
||||||||||||
|
2010 |
|
|
|
|
|
|
||||||||||||
|
2013 |
|
|
|
|
|
|
||||||||||||
|
2016 |
|
|
|
|
|
|
Source: CRS analysis of the SCF, 1989 to 2016.
Note: Elderly households are those headed by individuals aged 65 and older.
Table 2. Median of Selected Types of Debt Among Elderly Households
with Specified Type of Debt, 1989 to 2016
(in 2016 dollars)
|
Year |
Total Debt |
Primary Residence |
Other Residential |
Auto Loan |
Student Loan |
Credit Card |
||||||
|
1989 |
|
|
|
|
|
|
||||||
|
1992 |
|
|
|
|
|
|
||||||
|
1995 |
|
|
|
|
|
|
||||||
|
1998 |
|
|
|
|
|
|
||||||
|
2001 |
|
|
|
|
|
|
||||||
|
2004 |
|
|
|
|
|
|
||||||
|
2007 |
|
|
|
|
|
|
||||||
|
2010 |
|
|
|
|
|
|
||||||
|
2013 |
|
|
|
|
|
|
||||||
|
2016 |
|
|
|
|
|
|
Source: CRS analysis of the Survey of Consumer Finances, 1989 to 2016.
Notes: Elderly households are those headed by individuals aged 65 and older. Median debt for each type is measured among elderly households with that specified type of debt.
A small proportion of elderly households held debt secured by other residential properties, such as a second house or a vacation property. The share of elderly households who held other residential debt slightly increased from 2.7% to 4.4% between 1989 and 2016, and the median debt on other residences increased from $23,323 to $98,000. Those types of debt were primarily concentrated among relatively higher-income elderly households.23
Auto Loans
Auto loans also increased among households headed by individuals aged 65 and older from 1989 to 2016. The share of elderly households who held any auto loan increased from 10.3% to 21.2%, and the median auto loan grew from $7,463 to $11,000 (in 2016 dollars) for those households with auto debt. Rising auto loan debt among elderly households may have partly resulted from rising vehicle costs and longer auto loan maturities.24
Student Loans
A small share of elderly households held student loans, but the proportion increased over time. About 0.5% of elderly households held some student loans in 1989, and this share increased to 2.4% in 2016. Among those elderly households who held student loans, the median amount in 2016 dollars was $7,463 in 1989, which increased to $12,000 in 2016. Although the number of student loan borrowers aged 65 and older is much smaller than the younger population, elderly borrowers are more likely to default than their nonelderly counterparts.25 Student loan debt can be especially problematic for older Americans because, in the event of default on federal student loans,26 a portion of the borrower's Social Security benefits can be claimed to pay off the loans.27 The number of individuals aged 65 and older whose Social Security benefits were offset to pay student loans increased from about 6,000 in FY2002 to 38,000 in FY2015.28 Most of these federal student loans were incurred primarily for older Americans' own education rather than for their dependents' education.29
Credit Card Balances
Credit card balances among elderly households increased from 1989 to 2016, and they were the most common type of debt for elderly households in 2016. From 1989 to 2016, the share of elderly households who held some credit card debt increased from 10.0% to 35.1%, and the median credit card balance increased from $952 to $2,400 (in 2016 dollars) among those with credit card debt. Studies suggest that credit card and other noncollateralized debt tends to carry higher interest rates than other types of credit, so with rising credit card debt, older Americans may need to dedicate more of their income to servicing their debt.30 Credit card debt is a leading reason for bankruptcy filings among older consumers. One study shows that elderly debtors in bankruptcy carried 50% more credit card debt than younger debtors, and the elderly cited credit card interest and fees as the main reason for filing bankruptcy.31
Relative Measures Related to Debt
Measures of outstanding household debt say little about how much of a burden the debt is or how much risk it poses to the population's financial health. The debt payment-to-income ratio and the debt-to-asset ratio are relative measures commonly used to address the degree of debt burden on households.
The Debt Payment-to-Income Ratio
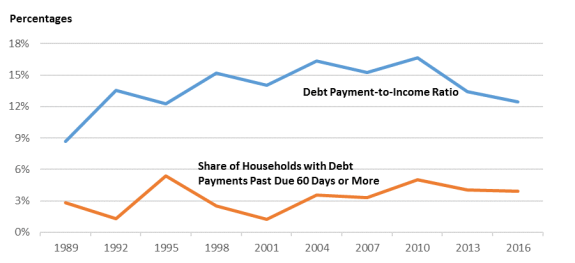
One measure of debt burden is calculated by comparing required debt payments to the income available to make those payments—the debt payment-to-income ratio. The ratio can measure the effects of interest rate changes and loan sizes on a household's liquidity. The debt payment-to-income ratio among elderly households who had some debt increased from 8.7% in 1989 to 16.7% in 2010, and then it declined to 12.4% in 2016 (see Figure 4). This ratio among elderly households was much lower than that for nonelderly households in 1989 (8.7% for elderly households compared with 16.1% for nonelderly households), but the difference in the ratio between elderly households and nonelderly households decreased over time. In 2016, the debt payment-to-income ratio for nonelderly households was 13.8%, compared with 12.4% for elderly households.
Delinquency on loan payments (e.g., the percentage of debtors with debt payment past due 60 days or more) can also suggest trouble meeting debt obligations. About 3.9% of households headed by individuals aged 65 and older with any debt had some payments past due 60 days or more in 2016 (see Figure 4). The share fluctuated between 1% and 5% from 1989 to 2016, and it did not show an increasing trend over time for older Americans. The share is generally higher for young households (around 10% for households headed by those aged between 18 and 34) and decreases as the head of household ages. These data suggest that although the debt payment-to-income ratio for elderly households is rising, this pattern might not indicate trouble meeting debt obligations.
|
Figure 4. The Debt Payment-to-Income Ratio and Delinquency on Loan Payments for Elderly Households with Debt, 1989 to 2016 |
 |
|
Source: CRS analysis of the SCF, 1989 to 2016. Notes: Elderly households are those headed by individuals aged 65 and older. Household income in the SCF includes wages and salaries, business and farm income, rent income, interest and dividends, withdrawals from IRAs and tax-deferred pension accounts, Social Security and pension benefits, transfers from public assistant programs, alimony income, and other income from family relatives. For more information, see Board of Governors of the Federal Reserve System, Survey of Consumer Finances, at https://www.federalreserve.gov/econres/scfindex.htm. |
The Debt-to-Asset Ratio
Another measure of debt burden is the debt-to-asset ratio. In addition to income, households can use assets to guard against financial risks.32 In general, the more assets a household has, the less likely it is to default on its debt.
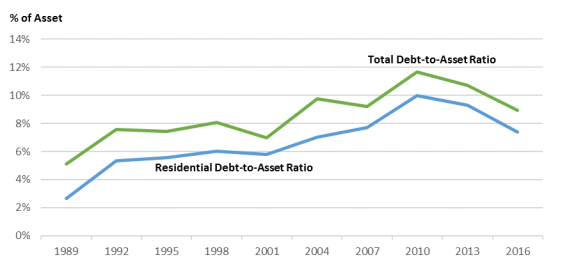
As predicted by the life-cycle model, the debt-to-asset ratio is generally lower for elderly households than for nonelderly households, but from 1989 to 2016, the ratio grew more quickly for elderly households than for nonelderly households. According to the SCF, the debt-to-asset ratio increased from 5.1% in 1989 to 9.0% in 2016 for elderly households with debt (see Figure 5), whereas the ratio remained relatively stable for nonelderly households, at around 20%, during the same time. Among all debt types, the residential debt-to-asset ratio, which increased from 2.7% in 1989 to 7.4% in 2016, contributed to a large proportion of the growth in the debt-to-asset ratio for elderly households. The debt-to-asset ratio reached 11.7% in 2010, including a residential debt-to-asset ratio of 10.0%, which might have resulted from the increased availability of mortgage credit through 2007. In addition to the rise in the debt-to-asset ratio, the proportion of elderly households whose debt-to-asset ratio was greater than 50% increased from 7.4% in 1989 to 11.2% in 2016.33
Bankruptcy Among Older Americans
In addition to the increase in the debt-to-asset ratio, researchers have found a rise in the percentage of older Americans filing for relief under the bankruptcy code.34 Individuals may file for bankruptcy when they cannot meet their debt obligations. Scholars find that the proportion of bankruptcy filers aged 65 and older increased from 2.1% in 1991 to 12.2% in 2013-2016 (approximately 97,600 households),35 and the elderly cohort is the fastest-growing age demographic even after adjusting for the aging of the population.36 Those studies also suggest that although both younger (under age 65) and older (age 65 and older) bankruptcy debtors are financially struggling, older filers overall are in worse financial shape than younger filers in terms of secured and unsecured debt, income, assets, and the debt-to-income ratio.37
Bankruptcy can be even more problematic for older debtors than younger debtors because it is generally harder for them to accumulate assets postbankruptcy. For example, compared with younger debtors, elderly debtors are less likely to find well-paying jobs because of perceptions of decreasing productivity and are less likely to build retirement savings because they have less time to accumulate wealth. Scholars argue that if the debtors filed bankruptcy as a result of chronic illness, bankruptcy does not improve their health or access to affordable healthcare or prescriptions.38 For this and other reasons, research suggests that older bankruptcy filers are significantly more likely to continue to struggle financially than younger filers.39
Increased Debt Among Elderly Households by Age Groups
Although household debt rose over the past three decades for elderly households overall and on average, the oldest Americans experienced the largest increase in debt. Among all elderly households, those headed by people aged 80 and older saw the fastest growth in the share of households with any debt, the median household debt, and the debt-to-asset ratio.
Share of Elderly Households Holding Debt and Median Debt
Figure 6 displays the share of elderly households who held any debt among four age groups from 1989 to 2016. In general, the proportion of elderly households with any debt declined with age for most survey years. For example, in 2016, about 70% of households headed by individuals aged 65-74 held debt, but the proportion was 61% for households in the 75-79 age group and 42% for those in the age group 80 and older. Over time, the proportion of elderly households with any debt increased for all age groups. In 2016, the share of households headed by those aged 65-69 with debt increased from 54.0% in 1989 to 69.8%, from 44.6% to 70.7% for the age group 70-74, from 27.6% to 60.7% for the age group 75-79, and from 12.5% to 41.5% for the age group 80 and older. Among all age groups, the largest growth was for the oldest age groups, aged 75-79 and aged 80 and older.
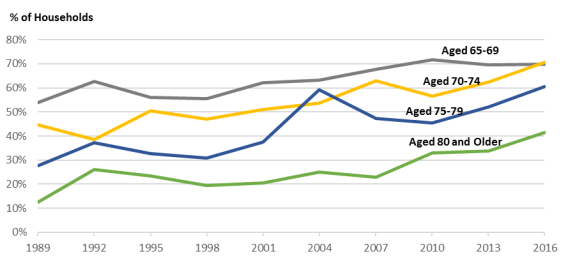
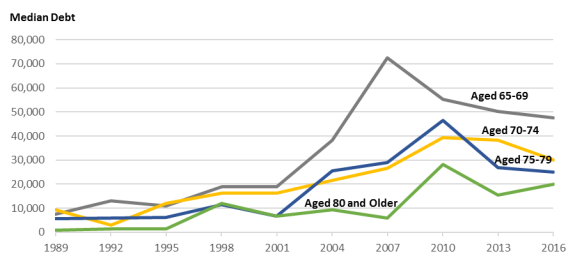
Figure 7 shows median household debt among elderly households who had some debt by age groups from 1989 to 2016. Median household debt generally increased over time for each age group and peaked around the financial crisis. For households headed by those aged 80 and older, real median debt (in 2016 dollars) was $933 in 1989 and increased to $20,000 in 2016, almost 20 times greater.
Average Debt and Components of Debt
On average, elderly households in all age groups hold more debt today than did similar households three decades ago in real dollars (see Table 3). Among all types of debt, primary residential debt experienced the largest growth, increasing by between 315% and 536% within the four elderly age groups. Following primary residential debt, elderly households experienced growth in other residential debt, auto loans, credit card balances, and student loans. Elderly households held almost no student loans in 1989, but the average amount in 2016 increased to more than $2,000 for households headed by those aged 65 to 69 and more than $1,000 for households headed by those aged 70 to 79.
Table 3. Average Debt Among Elderly Households with Debt by Age Groups,
1989 Versus 2016
(in 2016 dollars)
|
Age Group |
Average Debt |
Primary Residence |
Other Residential |
Auto |
Student Loan |
Credit Card |
Other Debt |
|||||||
|
1989 |
||||||||||||||
|
65-69 |
|
|
|
|
|
|
|
|||||||
|
70-74 |
|
|
|
|
|
|
|
|||||||
|
75-79 |
|
|
|
|
|
|
|
|||||||
|
80 and older |
|
|
|
|
|
|
|
|||||||
|
2016 |
||||||||||||||
|
65-69 |
|
|
|
|
|
|
|
|||||||
|
70-74 |
|
|
|
|
|
|
|
|||||||
|
75-79 |
|
|
|
|
|
|
|
|||||||
|
80 and older |
|
|
|
|
|
|
|
|||||||
Source: CRS analysis of the SCF, 1989 and 2016.
Notes: Elderly households are those headed by individuals aged 65 and older. Other debts include lines of credit, installment loans, loans against pensions or life insurance, margin loans, and miscellaneous.
The Debt-to-Asset Ratio
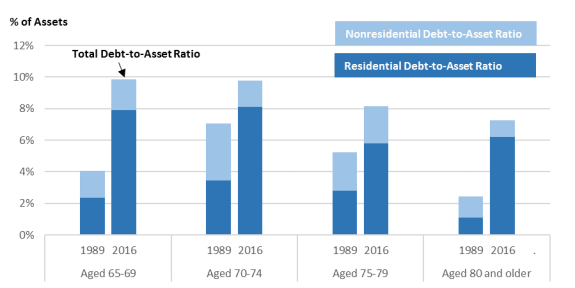
The debt-to-asset ratio increased for all age groups among elderly households from 1989 to 2016, and the ratio increased the most among households headed by people aged 80 and older (see Figure 8). The debt-to-asset ratio among elderly households with any debt increased from 4.0% to 9.9% for households headed by those aged 65 to 69, from 7.1% to 9.8% for the age group 70-74, from 5.3% to 8.2% for the age group 75-79, and from 2.4% to 7.2% for the age group 80 and older. Residential debt explains the majority of the growth in total debt for every elderly household age group.
Increased Debt Among Elderly Households by Quintile of Total Assets
This section discusses changes in debt from 1989 to 2016 for elderly households with different asset levels. It is important to analyze changes in debt across the household asset distribution for several reasons. First, a small group of wealthy households hold high levels of assets and debt; thus, average measures may not accurately reflect less wealthy households' financial situations.40 Second, elderly households are more likely than their nonelderly counterparts to draw down existing assets, such as withdrawing from retirement savings accounts and other investment accounts. Asset measurement may provide an important view of an elderly household's ability to afford debt obligations.
The change in household debt among elderly households from 1989 to 2016 varies widely across the household asset distribution. During this time period, elderly households in the middle of the asset distribution had a relatively larger growth in the probability of holding any debt, and those in the middle and the top of the asset distribution had the largest growth in median and average household debt. Elderly households in the bottom of the asset distribution usually held the least debt, but had the largest debt burden as reflected in the debt-to-asset ratio, whereas elderly households in the top of the asset distribution held the most debt, but had the smallest debt-to-asset ratio.
Share of Elderly Households Holding Debt and Median Debt
Table 4 presents data on household debt by quintile of the total asset distribution among the elderly household population. Each quintile represents 20% of the elderly household population. The first quintile depicts the 20% of the elderly household population with the least assets, and the fifth quintile depicts the 20% of elderly households with the most assets.
The share of elderly households that held some debt generally increased from 1989 to 2016 for all asset quintiles. Elderly households in the first asset quintile were generally least likely to hold debt, and the share of those households who held any debt increased from 36.2% to 49.5%. Elderly households in the second, third, and fourth quintiles of total assets had the largest growth in the probability of holding any debt, with an increase of about 30 percentage points. The share of elderly households in the highest 20% of the asset distribution that held debt also increased from 37.3% in 1989 to 54.9% in 2016, but the increase was not as large as that among households in the middle of the asset distribution.
Table 4. Share of Elderly Households Holding Any Debt
by Quintile of Total Assets, 1989 to 2016
(in percentages)
|
Quintile of Total Assets |
|||||||||||||||
|
Year |
First |
Second |
Third |
Fourth |
Fifth |
||||||||||
|
1989 |
|
|
|
|
|
||||||||||
|
1992 |
|
|
|
|
|
||||||||||
|
1995 |
|
|
|
|
|
||||||||||
|
1998 |
|
|
|
|
|
||||||||||
|
2001 |
|
|
|
|
|
||||||||||
|
2004 |
|
|
|
|
|
||||||||||
|
2007 |
|
|
|
|
|
||||||||||
|
2010 |
|
|
|
|
|
||||||||||
|
2013 |
|
|
|
|
|
||||||||||
|
2016 |
|
|
|
|
|
||||||||||
Source: CRS analysis of the SCF, 1989 to 2016.
Notes: Elderly households are those headed by individuals aged 65 and older. Assets include real assets, such as houses, automobiles, business interests, and personal properties, and financial assets, such as checking and savings accounts, retirement savings accounts, and investment accounts. The quintile limits in real 2016 dollars are $26,122, $104,712, $203,379, and $466,465 in 1989 and are $77,670, $208,600, $401,500, and $1,001,020 in 2016.
Table 5 presents median debt among elderly households with any debt by quintile of total assets from 1989 to 2016. Median debt generally increased for elderly households in all asset quintiles, with a larger percentage increase for elderly households in the middle of the asset distribution. Real median debt (in 2016 dollars) increased by about three times for elderly households in the first and the fifth asset quintiles, and it increased by about four times or more for elderly households in the second, third, and fourth quintiles.
Table 5. Median Debt Among Elderly Households with Debt
by Quintile of Total Assets, 1989 to 2016
(in 2016 dollars)
|
Quintile of Total Assets |
||||||||||
|
Year |
First |
Second |
Third |
Fourth |
Fifth |
|||||
|
1989 |
|
|
|
|
|
|||||
|
1992 |
|
|
|
|
|
|||||
|
1995 |
|
|
|
|
|
|||||
|
1998 |
|
|
|
|
|
|||||
|
2001 |
|
|
|
|
|
|||||
|
2004 |
|
|
|
|
|
|||||
|
2007 |
|
|
|
|
|
|||||
|
2010 |
|
|
|
|
|
|||||
|
2013 |
|
|
|
|
|
|||||
|
2016 |
|
|
|
|
|
|||||
Source: CRS analysis of the SCF, 1989 to 2016.
Notes: Elderly households are those headed by individuals aged 65 and older. Median debt is measured among elderly households with debt. Assets include real assets, such as houses, automobiles, business interests, and personal properties, and financial assets, such as checking and savings accounts, retirement savings accounts, and investment accounts. The quintile limits in real 2016 dollars are $26,122, $104,712, $203,379, and $466,465 in 1989 and are $77,670, $208,600, $401,500, and $1,001,020 in 2016.
Average Debt and Components of Debt
Average debt generally increased from 1989 to 2016 for elderly households across the asset distribution, but the magnitude of growth differed among asset quintiles (see Table 6). Real average debt (in 2016 dollars) for elderly households in the lowest asset quintile was approximately twice as much in 2016 compared to 1989, whereas average debt for elderly households in the second through the fourth asset quintiles was generally three times as much in 2016 as in 1989. Average debt for households in the highest asset quintile also doubled, with the largest real increase of about $135,000.
For households in the lowest asset quintile, the growth in average debt mainly resulted from growth in primary residential debt, credit card debt, and auto loans. From 1989 to 2016, the increase in average primary residential debt contributed to 54% of the growth in average debt. The increase in average credit card debt explained about 30% of the growth in average debt among elderly households in the bottom asset quintile, and the increase in average auto loans explained almost 20% of the growth in average debt among those households.
The growth in debt among middle- and high-asset elderly households also mainly resulted from growth in residential debt. For higher-asset households, mortgage debt for second homes was also a part of this increase in debt. For households in the second through the fourth quintiles of total assets, growth in debt secured by primary residences generally accounted for about 80% of the growth in average debt. For households in the top asset quintile, growth in primary residential debt explained almost 70% of the growth in average debt, and the remaining 30% came mostly from other residential debt.
In addition, elderly households in the bottom asset quintile were more likely to have a higher proportion of debt held in other debt, including lines of credit, installment loans, loans against pensions or life insurance, margin loans, and miscellaneous, but the proportion decreased from 1989 to 2016. Elderly households in the first asset quintile on average held about 45% of their debt in other debt in 1989, and this proportion has declined to 20% in 2016.
Table 6. Average Debt Among Elderly Households with Debt
by Asset Quintiles, 1989 Versus 2016
(in 2016 dollars)
|
Asset Quintile |
Average Debt |
Primary Residence |
Other Residential |
Auto Loan |
Student Loan |
Credit Card |
Other Debt |
|||||||
|
1989 |
||||||||||||||
|
First |
|
|
|
|
|
|
|
|||||||
|
Second |
|
|
|
|
|
|
|
|||||||
|
Third |
|
|
|
|
|
|
|
|||||||
|
Fourth |
|
|
|
|
|
|
|
|||||||
|
Fifth |
|
|
|
|
|
|
|
|||||||
|
2016 |
||||||||||||||
|
First |
|
|
|
|
|
|
|
|||||||
|
Second |
|
|
|
|
|
|
|
|||||||
|
Third |
|
|
|
|
|
|
|
|||||||
|
Fourth |
|
|
|
|
|
|
|
|||||||
|
Fifth |
|
|
|
|
|
|
|
|||||||
Source: CRS analysis of the SCF, 1989 and 2016.
Notes: Elderly households are those headed by individuals aged 65 and older. Other debts include lines of credit, installment loans, loans against pensions or life insurance, margin loans, and miscellaneous. The top 1% of the sample with the highest credit card balance in 1989 is excluded from the calculation to mitigate the effect of outliers. Assets include real assets, such as houses, automobiles, business interests, and personal properties, and financial assets, such as checking and savings accounts, retirement savings accounts, and investment accounts. The quintile limits in real 2016 dollars are $26,122, $104,712, $203,379, and $466,465 in 1989 and are $77,670, $208,600, $401,500, and $1,001,020 in 2016.
The Debt-to Asset-Ratio
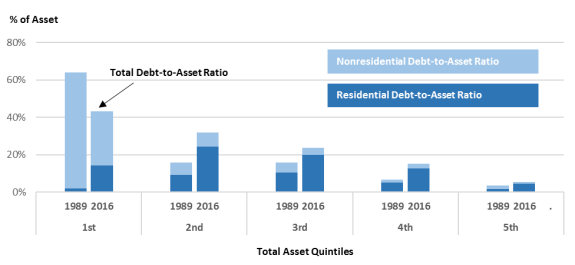
Figure 9 displays the debt-to-asset ratio among elderly households with debt by total asset quintiles in 1989 and 2016, decomposed into residential and nonresidential debt-to-asset ratios. The debt-to-asset ratios for households in the lowest asset quintile decreased during this time, although the residential debt-to-asset ratio slightly increased. In 2016, however, elderly households in the bottom 20% of the asset distribution still had a 43% debt-to-asset ratio, and most of the debt was based on nonresidential loans, such as credit card debt, auto loans, and student loans, which are usually considered as less effective long-term wealth builders than residential loans.
Among households in the second through the fourth asset quintiles, the debt-to-asset ratio generally increased by around 10 percentage points from 1989 to 2016, with most of the increase in the residential debt-to-asset ratio. The debt-to-asset ratio increased slightly for elderly households in the top asset quintile, primarily because of growth in the residential debt-to-asset ratio, including debt on both the primary residence and other residences.
Conclusion
Debt among households headed by individuals aged 65 and older has increased substantially over the past 30 years. The share of elderly households who held any debt almost doubled, and median debt among households with debt increased by about four times.
Much of the rise in debt among older Americans is not necessarily associated with financial insecurity in retirement. Much of the change in debt among elderly households, across some age groups and through most of the asset distribution, is well balanced by their assets. As shown earlier, from 1989 to 2016, the debt-to-asset ratio among elderly households with debt increased from 5.1% to 9.0%. Individuals may also adjust behavior to meet their debt obligations. For instance, one study finds that both the presence and the level of debt increase the likelihood that older adults work and reduce the likelihood that they are retired.41 Data from the SCF also show that the percentage of elderly households with either the head of the household or a spouse working increased from 19.8% in 1989 to 29.7% in 2016.
Rising debt among certain elderly households, however, has shown signs of an increase in debt burden. For example, the debt-to-asset ratio among households headed by individuals aged 80 and older increased by 5 percentage points between 1989 and 2016, and the ratio among elderly households with middle asset levels increased by more than 10 percentage points during the same time. Rising debt might be more problematic for persons aged 80 and older because they might be more vulnerable to income risks, as they are more likely to have lower or no earnings (as they phase out of the labor force),42 exhaust existing retirement resources,43 have reduced purchasing power in certain defined benefit pensions,44 and incur higher medical expenses.45 In addition, older Americans now hold historically high levels of housing debt, which might make them more vulnerable to housing market swings than previous cohorts of retirees. Therefore, in addition to retirement income and saving adequacy, debt management may also be an important determinant of retirement security.