Introduction
A number of states and local governments have taken actions to address greenhouse gas (GHG) emissions. These efforts cover a wide spectrum, from developing climate action plans to setting mandatory GHG emission standards.1 In addition, 29 states, 3 U.S. territories, and the District of Columbia are implementing mandatory renewable portfolio standards, which generally require a specific percentage of electricity to be generated from renewable energy sources.2
One of the most significant developments in state level climate policy is the Regional Greenhouse Gas Initiative (RGGI, pronounced "Reggie"), which is based on an agreement signed by RGGI governors in 2005.3 In the 2005 agreement, RGGI participants highlighted the role of anthropogenic emissions in climate change and a range of potential risks to human health and the environment related to climate change. RGGI participants stated that "continued delay in taking action … will make any later necessary investments in mitigation and adaptive infrastructure much more difficult and costly." In the 2005 agreement, RGGI states committed to first stabilize and subsequently reduce carbon dioxide emissions from fossil fuel-fired electric power plants in the RGGI states.
RGGI is the nation's first mandatory GHG emissions cap-and-trade program, which went into effect January 1, 2009 (see text box, "What Is a Cap-and-Trade System?").4 RGGI currently involves nine states—Connecticut, Delaware, Maine, Maryland,5 Massachusetts,6 New Hampshire, New York, Rhode Island, and Vermont. New Jersey is scheduled to rejoin RGGI in 2020 (see text box below).
The RGGI program may be informative to policymakers who are thinking of crafting a federal GHG reduction program, by providing insights into implementation complexities, the mechanics of various design elements, and lessons of potential design pitfalls. If Congress were to consider establishing a program to reduce GHG emissions, several of RGGI's design elements may be of interest.7
The first section of this report provides an overview of the RGGI cap-and-trade program and the participating RGGI states. The second section discusses estimated impacts of the RGGI program. The third section addresses selected issues raised by RGGI that may be of interest to Congress. The last section provides some final observations.
|
RGGI Developments in New Jersey and Virginia
New Jersey
New Jersey was one of seven states to sign the original RGGI agreement in 2005. New Jersey participated in the cap-and-trade program when it first went into effect in 2009. In 2011, New Jersey Governor Chris Christie announced the state would depart the program at the end of 2011.8
In 2018, the recently elected New Jersey Governor Philip Murphy began a process to rejoin RGGI.9 In December 2018, the Department of Environmental Protection and the Board of Public Utilities proposed regulations that would establish mechanisms to implement RGGI and direct the spending of auction proceeds, respectively.10 In June 2019, the department adopted the rules. New Jersey is to rejoin RGGI in 2020.
Virginia
In 2017, Virginia Governor Terry McAuliffe directed the state's Department of Environmental Quality to develop regulations that would limit emissions from power plants and allow for multi-state emissions trading.11 The Virginia Department of Environmental Quality published proposed GHG emission regulations that would establish a framework for Virginia to join RGGI. On April 19, 2019, the State Air Pollution Control Board approved the regulations.12 However, many Virginia policymakers oppose RGGI participation. On April 3, 2019, lawmakers in the Virginia Senate and House of Delegates passed budget provisions that prohibit the state from spending money to participate in RGGI.13 On May 2, 2019, Governor Ralph Northam approved these budget provisions.14 In a press release, the governor stated he was "extremely disappointed that the General Assembly included [the RGGI funding prohibition] in the budget" and he stated he would be "directing the Department of Environmental Quality to identify ways to implement the regulation and achieve our pollution reduction goals."15
|
Background
RGGI is a sector-specific cap-and-trade system that applies to carbon dioxide (CO2) emissions from electric power plants16 with capacities to generate 25 megawatts or more17—165 facilities in the nine RGGI states.18 RGGI's history began with discussions and meetings that date back to at least 2003. These activities eventually led to a 2005 Memorandum of Understanding (MOU)19 that outlined the basic framework of the program.20 In 2008, the RGGI states issued a model rule of cap-and-trade regulations that participating states could use to establish and implement their programs.21
RGGI designers expected the initial program to be a foundation for emissions trading and possibly expanded in future years by covering other emission sources/sectors, GHGs, or states. The CO2 emissions from covered entities in the RGGI states account for approximately 19% of all GHG emissions in the RGGI states.22 The remaining GHG emissions come from fossil fuel combustion in the transportation, industrial, commercial, and residential sectors.
Pursuant to RGGI's 2005 MOU, the RGGI states agreed to examine the program's effectiveness in 2012. This design review resulted in significant changes to the emissions cap and other cap-related design elements.23 These changes took effect in 2014 and are discussed below.
The RGGI states initiated a second design review in 2015, which was completed in 2017. The second design review resulted in further changes to the RGGI program. In particular, the RGGI states agreed to extend the emissions cap through 2030.
|
What Is a GHG Cap-and-Trade System?
A cap-and-trade program is one policy tool for reducing GHG emissions. It is often described as a market-based mechanism because, like an emissions fee or carbon tax, it allows the marketplace to determine the economically efficient solution for GHG emission reduction. Compared to other approaches—for example, requiring specific performance standards or technologies at particular facilities—market-based mechanisms are generally considered more cost effective. Perhaps the most successful U.S. market-based program in the environmental policy arena is the sulfur dioxide emissions trading system (known as the Acid Rain Program) established by the 1990 amendments to the Clean Air Act.24
A GHG cap-and-trade system creates an overall limit (i.e., a cap) on GHG emissions from the emission sources covered by the program. Cap-and-trade programs can vary by the emissions and sources covered. The covered sources, also referred to as regulated entities, often include major emitting sectors (e.g., power plants and carbon-intensive industries), fuel producers/processors (e.g., coal mines or petroleum refineries), or some combination of both.
The emissions cap is partitioned into emission allowances (or permits). Typically, in a GHG cap-and-trade system, one emission allowance represents the authority to emit one (metric) ton of carbon dioxide-equivalent (tCO2-e).25 This term of measure is used because GHGs vary by global warming potential (GWP).26
Under an emissions cap, covered entities with relatively low emission-reduction costs have a financial incentive to make reductions beyond what is required, because these further reductions could be sold (i.e., traded) as emission credits to entities that face higher costs to reduce their facility emissions. At the end of each established compliance period (e.g., a calendar year or multiple years), covered sources surrender emission allowances to an implementing agency to cover the number of tons emitted. If a source does not provide enough allowances to cover its emissions, the source would be subject to penalties. Other mechanisms, such as banking or offsets, may be included to increase the flexibility of the program.
The emissions cap creates a new currency—the emission allowance. Policymakers may decide to distribute the emission allowances to covered entities at no cost (based on, for example, previous years' emissions), sell the allowances (e.g., through an auction), or use some combination of these strategies. The distribution of emission allowance value, which includes both auction revenues and distribution of no-cost allowances, is typically a source of significant debate during a cap-and-trade program's development.
|
RGGI's cap-and-trade program includes many of the design elements that have been proposed and debated in federal legislative proposals.27 Highlights include the following:
- Three-year compliance periods. At the end of a compliance period, covered entities submit one emission allowance for each ton of CO2 emissions generated. A three-year compliance period should mitigate potential emission allowance price swings brought on by short-term market volatility.
- Emission allowance banking. RGGI allows covered entities to bank an unlimited number of emission allowances for future use. The opportunity to bank emission allowances instills a substantial amount of flexibility into a trading program, and can help mitigate potential allowance price volatility.
- Emission allowance auctions. With some variance among the states, particularly in the early years, RGGI states have distributed approximately 80% of their allowances through quarterly auctions. The auctions include a reserve price, which sets a price floor for emission allowances.
- Cost containment. In 2014, RGGI states established a "cost containment reserve" (CCR),28 which provides additional allowances to be sold at auction if certain price thresholds are met.
- Consumer benefit allocation. RGGI states agreed that at least 25% of the emission allowance value would be distributed "for a consumer benefit or strategic energy purpose."29 Allowance value distributions from RGGI states have exceeded this minimum requirement.
- Emissions containment: In 2017, seven of the RGGI states30 agreed to add an "emissions containment reserve" (ECR) mechanism to their model rules. The ECR starts in 2021 and sets an allowance price trigger at which states would permanently withhold emission allowances from sale, effectively lowering the cap.
- Offsets use. An offset is a measurable reduction, avoidance, or sequestration of GHG emissions from a source not covered by an emission reduction program. To a limited degree, RGGI's covered entities may submit offsets from specific project types in lieu of the emission allowances needed to satisfy compliance obligations.
RGGI Emissions Caps
The RGGI emission cap has evolved over time, because (1) the participating states have changed (New Jersey left in 2011) and (2) program reviews have resulted in emission cap adjustments. This section includes a discussion of both the initial emissions cap and emissions cap adjustments.
First Emissions Cap: 2009-2013
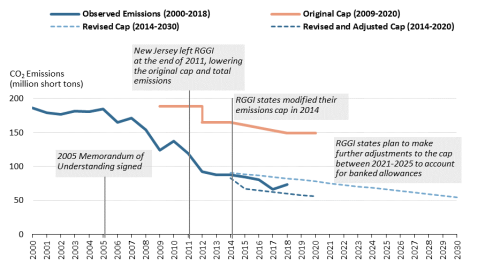
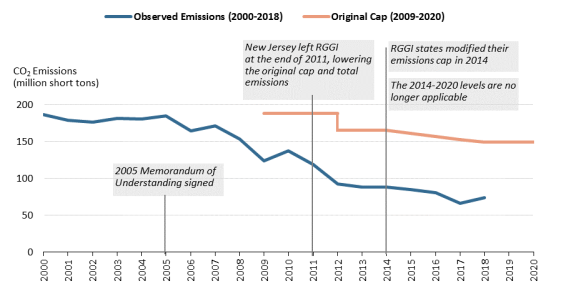
The initial objective of the first emissions cap was to stabilize CO2 emissions for several years (2009-2014) at the expected 2009 levels (based on assumptions made in 2005) and then require gradual reductions through 2018, achieving a 10% decrease from the 2009 emission cap level by 2019. During the emissions cap construction in 2005,31 RGGI designers set the 2009 emissions cap about 4% above the average emission levels observed between 2000 and 2002. RGGI designers anticipated that power plant CO2 emissions would gradually increase so that actual levels would approximately match the cap set for 2009—188 million short tons of CO2 (mtCO2). As illustrated in Figure 1, actual emissions did not meet these projections but decreased substantially.
|
Figure 1. Observed Emissions Compared to the Original Emissions Cap
|
 |
|
Source: Prepared by CRS; observed state emission data (2000-2018) provided by RGGI at http://www.rggi.org.
|
Revised Emissions Cap (2014-2030)
Following a 2012 design review of the RGGI program,32 the RGGI states agreed to reduce the emissions cap from 165 mtCO2 to 91 mtCO2. RGGI designers based the new cap level on their projection of 2012 emissions. The emission projection turned out to be fairly accurate, as actual 2012 emissions were 92 mtCO2. The revised cap took effect in January 2014. The emissions cap began decreasing by 2.5% each year after that and is to continue to decrease at that rate unto 2020.
As discussed above, between 2009 and 2013, the emissions cap exceeded actual emissions, providing an opportunity for entities to obtain more allowances than they needed to meet their compliance obligations. These allowances could held (i.e., banked) for future use without limitations. To address this development, RGGI states decided to adjust the new cap further to account for the substantial amount of banked emission allowances held by RGGI entities. In 2014, RGGI designers determined that these banked emissions accounted for 140 mtCO2, a considerable amount when compared to the 91 mtCO2 emission cap of 2014. Thus, the cap adjustments, which are applied each year between 2014 and 2020, are considerable. In some years, the adjustments lower the cap more than 20 mtCO2, equating to 28% decrease.
After a second design review, RGGI states agreed in 2017 to extend the emissions cap from 2021 through 2030.33 The states established a cap that would decrease annually by 2.25 million tons. In addition, RGGI states agreed to determine the amount of banked allowances at the end of 2020. Based on this determination, RGGI states are to make further adjustments to the cap between 2021 and 2025 to account for these allowances.
Figure 2 illustrates (1) the observed emissions between 2000 and 2018; (2) the original emissions cap (2009-2020); and (3) the revised emissions cap (2014-2030), which includes the 2014-2020 adjustments. As mentioned above, RGGI entities banked a considerable number of emission allowances during the original emissions cap. This allows for the 2015 emissions to be higher than the revised emissions cap, as illustrated in the figure.
|
Figure 2. Observed Emissions Compared to the Original and Revised Emission Cap
|
 |
|
Source: Prepared by CRS; observed state emission data (2000-2018) provided by RGGI at http://www.rggi.org and revised emission cap data from RGGI at http://www.rggi.org/design/overview/cap.
Notes: RGGI entities banked a considerable number of emission allowances during the original emissions cap (2009-2013). This allows for the actual emissions to be higher than the revised and adjusted emissions cap.
|
The distribution of emission allowances is typically a source of significant debate during a cap-and-trade program's development, because the allowances have monetary value. Policymakers may decide to (1) sell the emission allowances through periodic auctions, which would generate a new revenue stream; (2) distribute allowances to covered sources at no cost (based on, for example, previous years' emissions); or (3) use some combination of these strategies.
Emission allowances have value regardless of how they are distributed. For instance, if a RGGI state provided allowances to covered entities at no cost, a covered entity recipient could use the allowances for compliance purposes, sell the allowances in the marketplace (e.g., to other covered entities), or bank the allowances for future use. If a RGGI state provided no-cost allowances to a non-covered entity, it could sell the allowances in the marketplace, either through a broker or directly to a covered entity.
RGGI states use quarterly auctions to distribute the vast majority of the program's allowances.34 Thus, in the case of RGGI, allowance value is predominately expressed in terms of auction revenues. An important decision for RGGI states is how and for what purposes they will apply the emission allowance auction revenues. These issues are discussed below.
Allowance Auctions
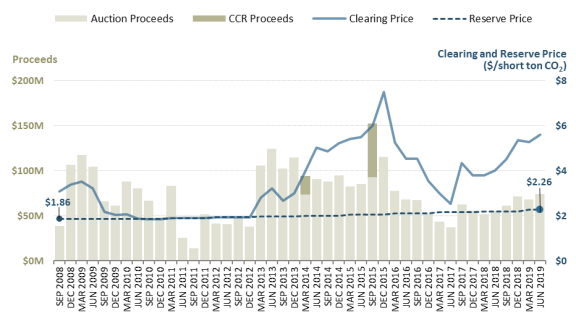
As a group, the RGGI states sold approximately 80% of their budgeted emission allowances at auction between 2008 and 2018. Other allowances were sold at fixed prices or distributed to various entities to support a variety of objectives.35 In addition, many allowances were offered at auction but not sold. RGGI states decided that these unsold allowances would not be offered for sale at future auctions but instead would be retired, effectively reducing the emissions cap.36
RGGI's auctions may be of particular interest to Congress, because this approach was part of several proposed cap-and-trade systems from former Congresses.37 Each RGGI auction is conducted in one round with a sealed-bid, uniform-price format.38 Participants may submit multiple, confidential bids for a certain number of allowances at a specific price. The price paid by all bidders is determined by the highest rejected bid (i.e., the second-highest bid). For example, consider a hypothetical auction in which the supply of allowances is 20 units. The highest bidder offers $10 per allowance for 15 allowances. The second-highest bidder offered $9 per allowance for 10 allowances. Under RGGI's auction structure, the highest bidder would receive 15 allowances at $9 per allowance, and the second-highest bidder would receive 5 allowances at $9 per allowance. The price paid by all successful bidders is known as the clearing price—$9 per allowance in this example.
In addition, RGGI auctions include a reserve price, below which the seller refuses to part with the item for sale (i.e., emission allowance). The reserve price started at $1.86 in 2008, increasing to $2.26 in 2019.39 In a large-volume, multi-unit auction that is expected to have substantial participation (i.e., high demand for emission allowances), a reserve price would all but guarantee a revenue stream. A reserve price may address certain logistical concerns, such as bidder collusion, that may be associated with auctions. In addition, a reserve price may provide assurance to parties making emission reductions that the reductions will have a minimal value in the allowance market.
The RGGI program has held 44 quarterly auctions as of the date of this report. In general, many have viewed the auctions as successful in terms of price discovery,40 transparency, transaction costs, and other logistical issues.41
Another typical measure of auction success is revenue generation. After 43 auctions, the cumulative proceeds total over $3.2 billion, including proceeds from New Jersey's allowances and proceeds from the cost containment reserve.
Figure 3 illustrates the auctions' results. As the figure indicates, the clearing price equaled the reserve price in auctions conducted between June 2010 and December 2012, reflecting the abundance of emission allowances in the market. During this time period, approximately 40% of the allowances offered for sale were not purchased. During this period, the reserve price ($1.86-$1.93 per ton) acted effectively like an emissions fee or carbon tax.
|
Figure 3. RGGI Auctions Proceeds and Clearing Prices
2008-2019
|
 |
|
Source: Auction Revenue Distribution Prepared by CRS; data from RGGI at http://rggi.org/market/co2_auctions/results.
Notes: CCR = cost containment reserve.
|
Following the February 2013 proposal to substantially reduce the emissions cap in 2014, the clearing prices began to increase, exceeding the reserve prices. The clearing price in the December 2015 auction reached $7.50, an almost four-fold increase compared to 2012 prices. The auction clearing prices decreased over the next 18 months reaching $2.53 in June 2017. Developments relating to the Clean Power Plan (discussed below) likely played a role in this decline. Since that time, clearing prices have increased (with some fluctuations), reaching $5.27 in March 2019.
Figure 3 also indicates the proceeds generated from the cost containment reserve (CCR) allowances. The CCR was added to RGGI in 2014 and is discussed below (see "Cost Containment" section). To date, the CCR has been triggered twice: in the March 2014 and September 2015 auctions.
Auction Revenue Distribution
Each state determines how it distributes the revenues generated from auctioning its budgeted allowances. However, in both RGGI's 2005 MOU and subsequent model rule,42 states agreed that at least 25% of emission allowances would be allocated for a "consumer benefit or strategic energy purpose."43 The RGGI states (as a group) have more than doubled this commitment.
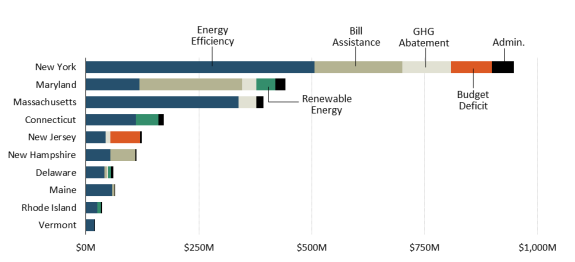
Figure 4 provides estimates of auction revenue distribution by state for several categories from 2008 to 2016. As mentioned above, RGGI states have distributed the vast majority (approximately 80%) of their emissions via quarterly auctions. As the figure illustrates, RGGI states have allocated auction revenues for the following objectives, with the aggregate percentages for each objective are listed below.
- energy efficiency (50%);
- bill assistance (19%);
- GHG abatement (7%);
- renewable energy (4%);
- state budget reduction (6%); and
- administration (4%).44
|
Figure 4. Allocation of Auction Revenue by RGGI State
2008-2016
|
 |
|
Source: Prepared by CRS; data from RGGI, Investment of RGGI Proceeds in 2016, 2018; New Jersey data from Environment Northeast, RGGI Auction Tracker: State Allocations and Spending Plans, June 2013. New Jersey left RGGI at the end of 2011.
Notes: The category names come from the RGGI document. The above estimates are based on percentages in the RGGI document multiplied by the total proceeds for each state (and rounded to the nearest million). Due to rounding, the combined estimated totals for each category may not match the total amount provided in the RGGI document. Through 2016, states have provided $16 million to RGGI Inc., a non-profit corporation created to implement the program.
|
At the time these estimates were collected (2016), an additional $250 million of auction revenue remained to be invested. This revenue will likely be used to support similar objectives.
Allowance value distribution decisions are subject to change and these decisions may generate debate and scrutiny. For example, after initially allotting auction proceeds to energy efficiency efforts, two states—New Jersey and New York—transferred auction proceeds to address state budget deficits. Environmental groups criticized the actions of these states,45 but the state policymakers argued that the transfers were necessary.
These developments highlight a cap-and-trade design issue for federal policymakers: How much flexibility (if any) should be built into a strategy to distribute emission allowance value, such as auction revenue. For example, should auction revenue be subject to the annual appropriations process or should an implementing statute direct revenues for specific purposes without going through the appropriations process? Alternatively, crafters could include provisions that authorize modifying an enacted distribution approach, perhaps based on specific criteria or circumstances.
Estimated Impacts of the RGGI Program
Assessing the impacts of the RGGI program presents challenges. Multiple factors play a role in the region's CO2 emission levels, including economic developments and state-specific energy and environmental policies that may directly or indirectly complement or counter the objectives of RGGI. This section highlights the results of several studies that have examined particular aspects of the RGGI program.
As discussed above, the stringency of the RGGI program has evolved over time. Thus, the potential impacts of the program may have changed as the emissions cap has become more binding. Although RGGI's original emission cap (2009-2013) was well above actual emissions (due to unexpected emission level decreases), the cap, and the overall RGGI program, still had impacts. First, the cap's existence attached a price to the regulated entities' CO2 emissions. A price on CO2 emissions impacts the relative price difference between energy sources by making fuels with a higher CO2 emissions intensity (i.e., emissions per unit of energy), such as coal, more expensive than less intensive fuels, such as natural gas.46 In RGGI's first compliance period, the allowance price was relatively low, because of the abundance of emission allowances. A 2010 analysis of the RGGI program found that the emission allowance price accounted for approximately 3% of the change in the price difference between natural gas and coal in the RGGI region between 2005 and 2009.47
Second, the program's cap effectively created a new form of currency—the emission allowance. The emission allowance value can be used to support various policy objectives, including (as is the case with RGGI) energy efficiency and renewable energy investments. Some would argue that RGGI's greatest impact has been to provide a relatively reliable funding source for such efforts. Several RGGI studies indicate that supporting energy efficiency provides multiple benefits: emission reduction, consumer savings via lower electricity bills, and regional job creation.48 One of these studies argues this allowance value distribution strategy (e.g., use of RGGI auction revenue) "creates wider benefit than any other use of allowance value."49 A 2015 study found that the RGGI program as a whole (i.e., the allowance price, distribution of allowance value, and related complementary effects) was the dominant factor in the emissions decrease.50
Relatively few authoritative studies have examined the overall economic effects in the region resulting from the RGGI program. The Analysis Group51 has produced several studies assessing the economic impacts after each of the first three compliance periods (2009-2011, 2012-2014, and 2015-2017). In a 2018 peer-reviewed journal article, the Analysis Group authors summarized the results of the previous three studies.52 The researchers estimated that during the first three compliance periods (2009-2017) the RGGI program yielded a net benefit of $4.7 billion to the RGGI states and more than 40,000 job-years.53 The researchers derived these estimates by comparing actual results against a "counterfactual" scenario in which RGGI was never established.
CRS is aware of one study that has assessed health effects resulting from the RGGI program. A 2017 study used modeling data from the Analysis Group to examine the public health impacts of the first six years of the RGGI program (2009-2014).54 The study concluded that the RGGI program's air quality improvements led to public health benefits, including the avoidance of premature deaths and illness.55 The study estimated the cumulative economic value of the health benefits at $5.7 billion.56
Several studies indicated that the RGGI CO2 emissions decreases were due (to some degree) to long-term structural changes. These include changes in RGGI's electricity generation portfolio, particularly natural gas replacing coal, and energy efficiency improvements.57
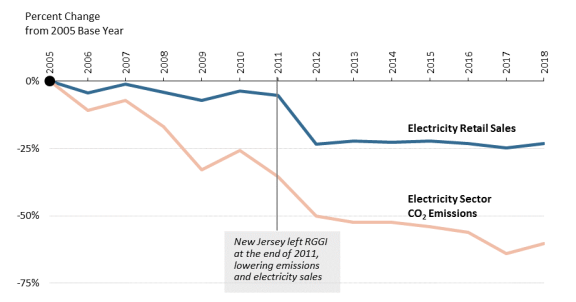
A comparison between the emission decline and electricity retail sales (a proxy for electricity use) in the RGGI states supports this notion. As Figure 5 indicates, RGGI electricity retail sales, which are a proxy measure for electricity use, decreased by 5% between 2005 and 2011 (a period that included a substantial economic decline), while CO2 emissions from in-state electricity generation decreased by 36% during the same period. This disparity suggests that factors other than temporal economic conditions were the primary influence for the CO2 emissions decrease.
A comparison of more recent years indicates that, between 2012 and 2018, CO2 emissions from in-state electricity generation decreased by 20%, while electricity retail sales remained flat, decreasing by less than 1%.58
|
Figure 5. RGGI CO2 Emissions in Electricity Sector Compared with Electricity Sales
Percent Change from 2005 Levels
|
 |
|
Source: Prepared by CRS; observed state emission data (2000-2017) provided by RGGI at http://www.rggi.org; electricity sales from Energy Information Administration, Electricity Data Browser, https://www.eia.gov/electricity/data/browser/.
|
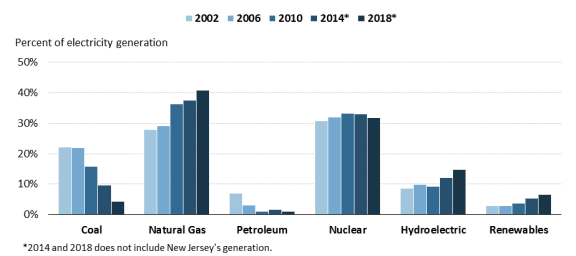
Figure 6 compares RGGI's electricity generation portfolio between 2002 and 2018. Electricity is generated from a variety of energy sources, which vary significantly by their ratio of CO2 emissions per unit of energy. For example, a coal-fired power plant emits almost twice as much CO2 (per unit of energy) as a natural-gas-fired facility.59 Some energy sources (e.g., hydropower, nuclear, wind, or solar) are generally considered to be zero-emission sources. In 2002, RGGI states generated 29% of their electricity from coal and petroleum, sources of energy with relatively high carbon intensity. In 2018, these sources generated 5% of RGGI's electricity. During that time, sources with relatively lower (or zero) carbon intensities—natural gas, nuclear, and renewables—increased their contributions to RGGI's electricity portfolio. In particular, electricity generation from natural gas increased from 28% to 41% and renewable sources increased from 3% to 7% over that time frame.
|
Figure 6. RGGI States Electricity Generation by Energy Source
|
 |
|
Source: Prepared by CRS; data from Energy Information Administration, "Net Generation for Electric Power."
Notes: Renewables include wind, solar, geothermal, and biomass sources. Some sources, including other gases and waste heat, are not included in the above figure, but these account for less than 1% of electricity generation.
|
Selected Issues
Emissions Leakage
During RGGI's development, the program designers recognized that "emissions leakage" could potentially undermine the effectiveness of the RGGI program. Leakage can occur when an emissions reduction program does not include all sources contributing to the environmental problem. Increases in emissions from uncovered sources, in RGGI states or neighboring states, may offset the emission reductions achieved from covered sources. This is a concern with the RGGI program, because the RGGI regime does not regulate emissions from electricity generated outside the region (e.g., in Pennsylvania) and then used within the region (i.e., "imported electricity").
Emissions leakage could occur if imported electricity replaces RGGI in-state electricity generation, because emissions from in-state electricity are covered under the cap; emissions from imported electricity are not. In such a scenario, the quantity of leakage would depend on the sources of electricity generation involved in the tradeoff. For example, maximum leakage would occur if imported electricity from a coal-fired power plant replaced in-state electricity generated from a zero-emission source.
RGGI states have been monitoring electricity generation and CO2 emission levels from both RGGI and non-RGGI sources60 since the emissions cap took effect in 2009. In RGGI's most recent monitoring report (December 2018),61 the authors compared activity between 2014 and 2016 to a pre-RGGI baseline period (2006 through 2008). The report found that electricity generation from all non-RGGI sources increased by about 8%, due largely to a 35% increase in imported electricity. However, the report also found that the CO2 emission levels from non-RGGI sources decreased by 2%. This is likely related to (1) RGGI state increases in electricity generation from hydropower and renewable sources (Figure 6) and (2) increases of imported hydroelectricity to some RGGI states, primarily from Quebec.62
After its second program review, RGGI participants stated:
The Participating States commit to engage in a collaborative effort supported by RGGI state staff and informed by discussions with their respective ISOs, to monitor and track relevant data to evaluate potential emissions leakage, and to work to address any emissions leakage that may be identified through this tracking.63
Emissions leakage will likely remain a topic of discussion going forward, particularly with the onset of the revised emissions cap in 2014 and the extension of the cap through 2030.
Offsets
Federal policymakers may be interested in RGGI's treatment of offsets. An offset is a measurable reduction, avoidance, or sequestration of GHG emissions from a source not covered by an emission reduction program.64 RGGI limits offsets to 3.3% of a source's allowance submission, a relatively low percentage compared to California's cap-and-trade system65 and some federal proposals.66 Under RGGI's original model rule (2009-2013), the offset ceiling percentage could increase to 5% or 10% if the market price of an allowance exceeds $7 or $10 (in 2005 dollars, adjusted annually), respectively. However, as part of the first design review, RGGI states replaced the offset ceiling provision with the new Cost Containment Reserve, discussed below.
RGGI uses a standards approach—as opposed to performance-based system—for developing offsets: A project must satisfy a set of detailed requirements (specific to a project type) and be certified by a third party. RGGI offsets must be located in RGGI states. RGGI originally limited offset projects to five types. After the 2016 design review, the states eliminated two project categories.67
The remaining eligible project types include:
- 1. Landfill methane reduction;
- 2. Forest sequestration projects,68 including afforestation,69 reforestation,70 improved forest management, and avoided forest conversion; and
- 3. Avoided methane from manure management practices.
Some offset projects raise concerns, because they may not represent real or long-term emission reductions. For offsets to be credible, a ton of CO2-equivalent emissions from an offset project should equate to a ton reduced from a RGGI power plant. If illegitimate offset credits flow into an emissions trading program, the program would fail to achieve its primary goal—emission reduction.
According to the RGGI offsets tracking database, one offset project has been developed and approved under the RGGI program: a landfill methane reduction project in Maryland.71 This project created approximately 16,000 tons of allowances in 2017 and 2018 for the project developers.
Cost Containment Reserve
As part of the 2012 design review, RGGI states decided to alter the cost containment provisions in the RGGI program. Under the original model rule (2009-2013), potential cost concerns were addressed by allowing for the use of additional offsets if emission allowance prices reached specific levels. The revised model rule, which took effect in 2014, eliminated this approach and added a cost containment reserve (CCR) to the cap-and-trade system. The CCR provides additional allowances—5 million in 2014 and 10 million each year thereafter—if certain price thresholds are met during one of the quarterly allowance auctions:
- $4 per ton in 2014;
- $6 per ton in 2015;
- $8 per ton in 2016; and
- $10 per ton in 2017, increasing 2.5% each year thereafter.
The CCR was triggered in 2014 and 2015 (Figure 3), allowing for the sale of 5 million and 10 million additional allowances, respectively. In each instance, all of the additional allowances were purchased. Unlike some allowance reserve systems in other programs and proposals,72 allowances from CCR are not borrowed from future years, thus effectively increasing the cap if triggered.
After the second design review, RGGI states modified the CCR by increasing the annual threshold prices and reducing the number of allowances that would be sold if the price thresholds were triggered. Starting in 2021, the CCR price threshold is to equal $13/ton and increase by 7% each year. If the CCR price is triggered, the additional allowance offered for sale is to equal to 10% of the RGGI cap (i.e., 7.5 million in 2021).
Interaction with Federal GHG Emission Regulations
An issue for both federal and state policymakers is how RGGI's emission program would interact with federal regulations that apply to electric power plants.
The Environmental Protection Agency (EPA) finalized CO2 emission standards under Clean Air Act Section 111 for existing, fossil-fueled power plants in 2015,73 known as the Clean Power Plan (CPP).74 When the CPP was finalized in 2015, it was uncertain whether the scope and stringency of the RGGI program was sufficient to meet the CPP targets. In particular, at that time, the RGGI cap did not extend beyond 2020. During RGGI's second design review, RGGI participants considered CPP compliance issues in their deliberations.75 In 2017, RGGI states agreed to extend their emissions cap through 2030.
The CPP never went into effect. A number of states and other entities have challenged the rule, while other states and entities have intervened in support of the rule. On February 9, 2016, the Supreme Court stayed the CPP for the duration of its litigation. The rule therefore currently lacks enforceability or legal effect. The D.C. Circuit heard oral argument in the case in September 2016; as of this writing, the court has not issued a decision.76
Under the Trump Administration, EPA reviewed the CPP and its related rulemakings.77 This review concluded, among other things, that the CPP exceeded EPA's statutory authority by using measures that applied to the power sector as a whole rather than measures carried out within an individual facility. The agency therefore proposed repeal of the CPP on October 16, 2017, 78 and a rule to replace it (the Affordable Clean Energy (ACE) rule) on August 21, 2018.79 On June 19, 2019, EPA finalized repeal of the CPP and promulgated the ACE final rule.80
The ACE rule applies a narrower interpretation of the best system of emission reduction (BSER), a key phrase in the Clean Air Act. In the ACE rule, EPA bases the BSER for existing coal-fired electric generating units (EGUs) on heat rate improvement (HRI) measures.81 EPA did establish a BSER for other types of EGUs, such as natural gas combined cycle units. In addition, EPA did not establish a numeric performance standard as the agency did in the CPP. 82 Many of the legal issues raised in the CPP litigation, including the scope and interpretation of EPA's Clean Air Act authority, likely will be central to any future legal challenges to the repeal of the CPP or the ACE final rule.83
It is uncertain how the RGGI program will interact with the 2019 ACE rule. In the rule, EPA does not explicitly address whether compliance with existing state programs would satisfy ACE requirements. The ACE rule authorizes states to determine performance standards at individual electric generating units based on the technology options identified in EPA's rule and other considerations, such as the remaining useful life of the unit. Under ACE, states "will be expected to conduct unit-specific evaluations of HRI potential, technical feasibility, and applicability for each of the BSER technologies."84 EPA notes the "considerable uncertainty with regards to the precise measures that states will adopt to meet the final requirements because there are considerable flexibilities afforded to the states in developing their state plans."85 This uncertainty in the ACE rule makes comparisons with RGGI requirements challenging.
Final Observations
As a group, the nine RGGI states account for approximately 7% of U.S. CO2 emissions from energy consumption and 16% of the U.S. gross domestic product (GDP).86 Table 1 indicates that RGGI's aggregate CO2 emissions from energy consumption rank in the top 20 among nations.87
From a practical standpoint, the RGGI program's contribution to directly reducing the global accumulation of GHG emissions in the atmosphere is arguably negligible. However, RGGI's activities may stimulate action in other states or at the federal level. When business and industry have confronted a growing patchwork of state requirements, these sectors have historically preferred a national policy. RGGI and other state programs, particularly developments in California, may have some influence on federal policymakers. Note that the combination of the nine RGGI states and California CO2 emissions (740 million metric tons) would rank above eighth, behind South Korea (Table 1).88
In addition, RGGI's activities may create examples and/or models that could prove instructive for federal policymakers crafting more widespread applications. The program has provided a training ground for personnel from multiple states and various professions to develop a specific expertise in emissions trading issues. This knowledge base could be useful if a federal system were developed.
Table 1. CO2 Emissions from Energy Consumption
Top 20 Ranked Nations and U.S. States (2016 Data)
|
Country or State
|
CO2 Emissions
(million metric tons)
|
Country or State
|
CO2 Emissions
(million metric tons)
|
|
China
|
10,593
|
|
Canada
|
633
|
|
|
United States
|
5,172
|
|
Indonesia
|
513
|
|
|
India
|
2,155
|
|
Brazil
|
493
|
|
|
Russia
|
1,767
|
|
United Kingdom
|
481
|
|
|
Japan
|
1,203
|
|
South Africa
|
472
|
|
|
Germany
|
826
|
|
Mexico
|
453
|
|
|
South Korea
|
771
|
|
Australia
|
412
|
|
|
Saudi Arabia
|
657
|
|
9 RGGI States
|
379
|
|
|
Texas
|
654
|
|
California
|
361
|
|
|
Iran
|
639
|
|
Italy
|
356
|
|
Source: Prepared by CRS with data from EIA, "International Energy Statistics," "Total CO2 Emissions from the Consumption of Energy," and "State CO2 Emissions," at http://www.eia.gov.