The National Park Service (NPS) administers the National Park System, which covers 85 million acres of land and consists of 419 diverse units included for their natural, cultural, and recreational importance. NPS generally receives appropriations in the annual Interior, Environment, and Related Agencies appropriations bill. This report examines trends in the agency's discretionary appropriations over the past decade (FY2010-FY2019) and related issues and congressional actions. It also discusses changes in the size of the National Park System, numbers of recreational visits to the parks, and NPS staffing levels during that period.
NPS Discretionary Appropriations Totals
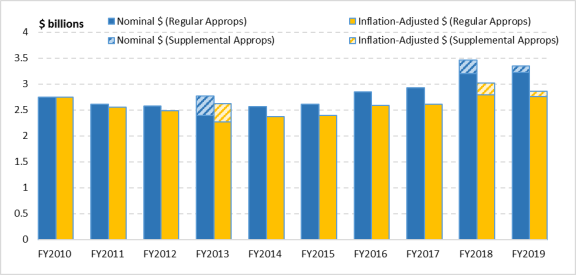
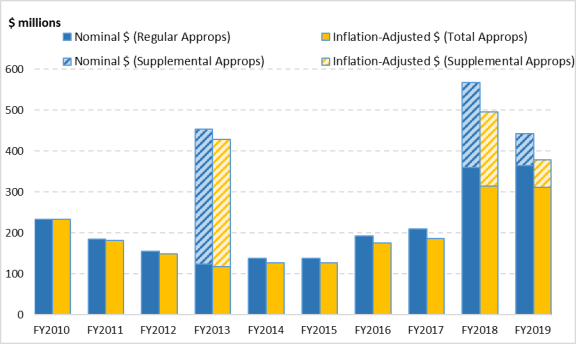
NPS's discretionary appropriations fluctuated during the past decade (FY2010-FY2019). Regular discretionary appropriations totaled $2.744 billion in FY2010 and $3.223 billion in FY2019. The FY2019 figure was 17% higher than FY2010 in nominal dollars but less than 1% higher when adjusted for inflation. In both nominal and inflation-adjusted dollars, the general trend was an annual decline between FY2010 and FY2013 and increases thereafter. NPS also received supplemental appropriations for response to natural disasters in FY2013 (P.L. 113-2), FY2018 (P.L. 115-123), and FY2019 (P.L. 116-20). These funds were provided outside of regular appropriations laws and were not subject to discretionary spending caps. With supplementals included, NPS's FY2019 discretionary appropriations totaled $3.351 billion, 22% higher than FY2010 in nominal dollars and 4% higher when adjusted for inflation (Figure 1 and Table 1).1
|
Figure 1. NPS Discretionary Appropriations, FY2010-FY2019 ($ billions, in nominal and inflation-adjusted 2010 dollars) |
 |
|
Sources: Data for FY2010-FY2014 and FY2019 are from annual House Appropriations Committee detailed tables for NPS. Data for FY2015-FY2018 are from NPS budget justifications for FY2017-FY2020. Notes: See footnote 1 for additional information on this figure. |
Table 1. NPS Discretionary Appropriations, FY2010-FY2019
($ billions, in nominal and inflation-adjusted 2010 dollars)
|
Appropriation in Nominal $ |
Appropriation in Inflation-Adjusted 2010 $ |
% Change Since Previous Year |
||
|
Nominal |
Inflation-Adjusted |
|||
|
FY2010 |
2.744 |
2.744 |
— |
— |
|
FY2011 |
2.611 |
2.560 |
-4.8% |
-6.7% |
|
FY2012 |
2.580 |
2.482 |
-1.2% |
-3.0% |
|
FY2013 |
2.775a |
2.622 |
+7.6%a |
+5.6% |
|
FY2014 |
2.562 |
2.374 |
-7.7% |
-9.4% |
|
FY2015 |
2.616 |
2.396 |
+2.1% |
+0.9% |
|
FY2016 |
2.852 |
2.588 |
+9.0% |
+8.0% |
|
FY2017 |
2.932 |
2.613 |
+2.8% |
+1.0% |
|
FY2018 |
3.460b |
3.018 |
+18.0%b |
+15.5% |
|
FY2019 |
3.351c |
2.865 |
-3.2%c |
-5.1% |
|
Change Over Decade |
+0.479 |
+0.012 |
+22.1% |
+4.4% |
Sources: Data for FY2010-FY2014 are from annual House Appropriations Committee detailed tables for NPS. Data for FY2015-FY2018 are from NPS budget justifications for FY2017-FY2020. Data for FY2019 are from annual House Appropriations Committee detailed tables for NPS, and P.L. 116-20.
Notes: Figures include supplemental appropriations. See footnote 1 for additional information on this table.
a. The FY2013 total of $2.775 billion includes regular appropriations of $2.398 billion and supplemental appropriations of $0.377 billion.
b. The FY2018 total of $3.460 billion includes regular appropriations of $3.202 billion and supplemental appropriations of $0.258 billion.
c. The FY2019 total of $3.351 billion includes regular appropriations of $3.222 billion and supplemental appropriations of $0.128 billion.
Individual NPS Accounts
During the decade, NPS's appropriations were primarily organized in six accounts that cover basic park operations (Operation of the National Park System, or ONPS, account); construction and repair of infrastructure (Construction account); assistance to state, local, tribal, and private land managers (National Recreation and Preservation account); grants to states and localities for historic preservation (Historic Preservation Fund); land acquisition by both NPS and the states (Land Acquisition and State Assistance account);2 and matching grants primarily to address the high backlog of deferred maintenance on NPS infrastructure (Centennial Challenge account).3 By far the largest share of NPS's discretionary appropriations—75% in FY2019—went to the ONPS account, which covers basic park operations (Figure 2 and Table 2).
|
Figure 2. NPS's FY2019 Discretionary Appropriations by Account |
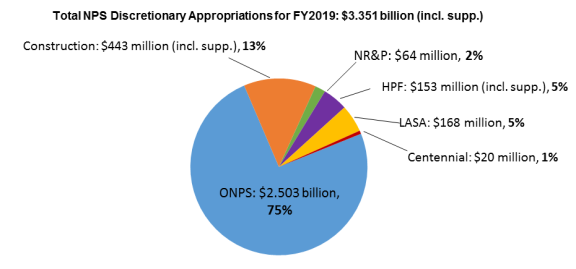 |
Source: H.Rept. 116-9 and P.L. 116-20.
|
Mandatory Appropriations in the National Park Service's Budget Most of NPS's funding comes from discretionary appropriations, which are controlled by annual appropriations laws. However, NPS also receives mandatory appropriations under various laws, which allow the agency to spend money without further action by Congress. NPS's mandatory appropriations include recreation fees, concession franchise fees, receipts from leasing, and direct cash donations, among others. Altogether, for FY2019, NPS estimated mandatory funding of $0.768 billion, whereas the agency's discretionary appropriations for FY2019 were $3.351 billion (including supplemental appropriations). Based on the NPS estimates, mandatory appropriations would constitute approximately 19% of NPS's total FY2019 budget. In its FY2020 budget request, the Trump Administration included a legislative proposal to increase NPS's mandatory appropriations through the establishment of a Public Lands Infrastructure Fund, to be used for repairs and improvements in national parks, national forests, national wildlife refuges, lands managed by the Bureau of Land Management, and schools administered by the Bureau of Indian Education. One primary goal of the fund would be to address NPS's backlog of deferred maintenance, estimated at $11.92 billion for FY2018. The Administration's proposal has been introduced in modified form in the 116th Congress as H.R. 1225, the Restore Our Parks and Public Lands Act, and S. 500, the Restore Our Parks Act. Under H.R. 1225, mandatory funding would go to multiple agencies; under S. 500, the funding would go entirely to NPS for "priority deferred maintenance needs." Amounts for the fund would be drawn from federal energy development revenues onshore and offshore, under specified terms. Because future energy revenues are unknown, it is uncertain how much money would be generated for NPS. In both bills, funding would be provided for five years and capped at $1.3 billion annually, with NPS receiving all the funding in S. 500 and 80% of the total in H.R. 1225. New mandatory spending would be subject to certain budget enforcement requirements, including the potential need to offset such spending. These requirements represent a hurdle for the above-described mandatory proposals. In the 115th Congress, multiple bills would have established similar special funds to address NPS deferred maintenance, but none was enacted. The 114th Congress enacted P.L. 114-289, which established the NPS Centennial Challenge Fund and an NPS Endowment. The law provided for a price increase for senior passes to the parks, with portions of the additional revenues directed to the Centennial Challenge Fund and the Endowment. P.L. 114-289 specified that this funding is provided as offsetting collections to annual appropriations. Deferred maintenance projects are a prioritized use of the funds. |
Table 2. NPS Appropriations by Account, FY2010-FY2019
($ millions, in nominal dollars and inflation-adjusted 2010 dollars)
|
ONPS |
Construction |
NR&P |
HPF |
LASA |
CC |
Totala |
|
|
FY2010 |
2,261.559 |
232.969 |
68.436 |
79.500 |
126.266 |
5.000b |
2,743.730 |
|
FY2011 |
2,250.050 |
184.646 |
57.245 |
54.391 |
94.810 |
— |
2,611.142 |
|
FY2012 |
2,236.568 |
155.366 |
59.879 |
55.910 |
101.897 |
— |
2,579.620 |
|
FY2013 |
2,097.261 |
453.885c |
56.747 |
100.486c |
96.567 |
— |
2,774.946c |
|
FY2014 |
2,236.753 |
137.461 |
60.795 |
56.410 |
98.100 |
— |
2,561.519 |
|
FY2015 |
2,277.485 |
138.339 |
63.117 |
56.410 |
98.960 |
10.000 |
2,616.501 |
|
FY2016 |
2,370.724 |
192.937 |
62.632 |
65.410 |
173.670 |
15.000 |
2,852.413 |
|
FY2017 |
2,425.126 |
209.353 |
62.638 |
80.910 |
162.029 |
20.000 |
2,932.120 |
|
FY2018 |
2,477.969 |
567.304d |
63.638 |
146.910d |
180.941 |
23.000 |
3,459.762d |
|
FY2019 |
2,502.711 |
442.704e |
64.138 |
152.660e |
168.444 |
20.000 |
3,350.657e |
Sources: FY2010-FY2014 data are from annual House Appropriations Committee detailed tables for NPS. FY2015-FY2018 data are from NPS budget justifications for FY2017-FY2020. FY2019 data are from annual House Appropriations Committee detailed tables for NPS.
Notes: ONPS = Operation of the National Park System account; NR&P = National Recreation and Preservation account; HPF = Historic Preservation Fund account; LASA = Land Acquisition and State Assistance account; CC = Centennial Challenge account. Data include supplemental appropriations. See footnote 1 for additional information on this table.
a. Totals reflect annual rescissions of LWCF contract authority of $30.0 million for FY2005-FY2013 and $28.0 million for FY2014-FY2017. Because these rescissions are not included in the amounts for individual accounts, the figures for the individual accounts do not add up to the totals shown. Congress did not enact the rescissions in FY2018 or FY2019 appropriations.
b. For FY2010, the Centennial Challenge account was titled Park Partnership Project Grants.
c. The FY2013 total of $2.775 billion includes regular appropriations of $2.398 billion and supplemental appropriations of $377.3 million (after sequestration). Supplemental FY2013 appropriations for specific accounts (after sequestration) were $329.8 million for Construction and $47.5 million for HPF. See NPS budget justification for FY2015, with FY2013 final appropriations totals, at https://www.nps.gov/aboutus/upload/FY-2015-Greenbook-Linked.pdf.
d. The FY2018 total of $3.460 billion includes regular appropriations of $3.202 billion and supplemental appropriations of $257.6 million. Supplemental FY2018 appropriations for specific accounts were $207.6 million for Construction and $50.0 million for HPF.
e. The FY2019 total of $3.351 billion includes regular appropriations of $3.223 billion and supplemental appropriations of $128.0 million. Supplemental FY2019 appropriations for specific accounts were $78.0 million for Construction and $50.0 million for HPF.
Operation of the National Park System Account
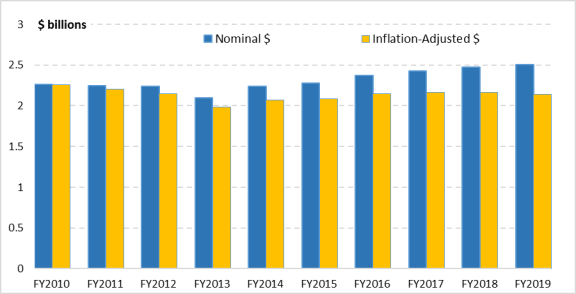
Appropriations for the largest NPS account, entitled Operation of the National Park System (ONPS), support the activities, programs, and services that form the day-to-day operations of the National Park System. ONPS funding was $2.262 billion in FY2010 and increased in nominal dollars to $2.503 billion in FY2019 (see Table 2 and Figure 3). When adjusted for inflation, however, this represents a decrease of 5%. As a percentage of total NPS appropriations, the ONPS share decreased over the decade from 82% of total funding in FY2010 to 75% in FY2019. The ONPS account was not affected by supplemental appropriations during the decade.4
The majority of ONPS funds are provided directly to individual park units. Activities covered under the account include visitor services, resource stewardship, park protection (including the U.S. Park Police), facility operations and maintenance, and park support, as well as "external administrative costs" for services provided by outside entities.5 Among these activities, funding for three activities (visitor services, resource stewardship, and park protection) decreased over the decade in inflation-adjusted dollars, whereas funding for two activities (park support and external administrative costs) grew in inflation-adjusted dollars. Funding for the remaining activity—facility operations and maintenance—was nearly even in FY2019 as compared with FY2010, when adjusted for inflation.6
|
Figure 3. Appropriations for NPS's Operation of the National Park System (ONPS) Account, FY2010-FY2019 ($ millions, in nominal and inflation-adjusted 2010 dollars) |
 |
|
Sources: FY2010-FY2014 data are from annual House Appropriations Committee detailed tables for NPS. FY2015-FY2018 data are from NPS budget justifications for FY2017-FY2020. FY2019 data are from annual House Appropriations Committee detailed tables for NPS. Notes: See footnote 1 for additional information on this figure. |
|
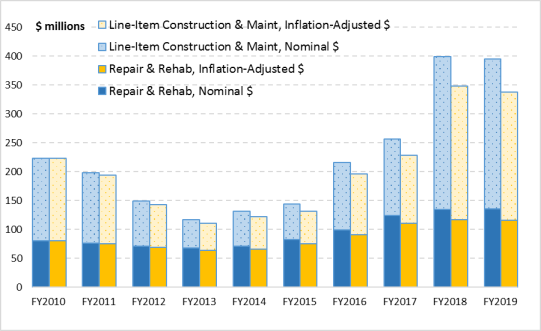
NPS Infrastructure: Funding for Deferred Maintenance NPS's substantial backlog of deferred maintenance (DM)—infrastructure maintenance and repairs that were not performed as scheduled or as needed—has been an ongoing concern for Congress. The 116th Congress is considering NPS's infrastructure needs both within and outside the annual appropriations process. Despite the agency's efforts to reduce DM through improved inventory and asset management, the NPS maintenance backlog has grown in nominal dollars, as agency assets—many constructed in the early to mid-20th century—age and deteriorate, and needed maintenance and repairs are not performed. The backlog grew over the past decade from an estimated mid-range figure of $10.83 billion in FY2010 to an estimated $11.92 billion (nominal dollars) in FY2018, the most recent year for which NPS estimates are available. This is a growth of 10%, although, in inflation-adjusted terms, the estimated backlog shrank by 12%.7 The bulk of the DM needs (52% in FY2018) are in transportation assets such as paved roads, bridges, and tunnels. Discretionary appropriations provide a significant portion of the agency's funding to address DM, and funding also comes from other sources. For example, road and bridge improvements are partly funded by allocations from the Department of Transportation. Funding to address DM also may come through mandatory appropriations such as fee collections. Within NPS's discretionary appropriations, two budget activities provide the primary support to address DM: the line-item construction and maintenance activity within the Construction account and the repair and rehabilitation subactivity within the Operation of the National Park System account. Funding for these two budget activities combined (Figure 4) rose by 52% in inflation-adjusted dollars over the decade. Although these two activities provide the bulk of NPS discretionary funding for DM, they also cover other maintenance activities outside of DM. Further, certain other budget accounts contribute some funding to projects on the DM backlog.
For more information on NPS deferred maintenance, see CRS Report R44924, The National Park Service's Maintenance Backlog: Frequently Asked Questions; CRS In Focus IF10987, Legislative Proposals for a National Park Service Deferred Maintenance Fund; and CRS Report R43997, Deferred Maintenance of Federal Land Management Agencies: FY2009-FY2018 Estimates and Issues. |
Construction Account
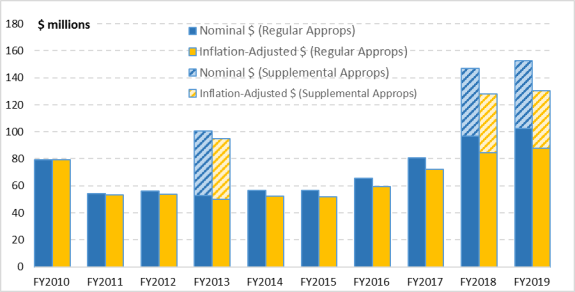
The second-largest NPS account, titled Construction, funds repairs and improvements to existing facilities as well as new construction projects, among other activities. In recent years, NPS has planned no new facility construction, in order to prioritize deferred maintenance. Appropriations for the Construction account dipped and then rose during the decade, increasing overall by 34% in inflation-adjusted dollars, not including supplemental appropriations. Supplemental appropriations for hurricane recovery in FY2013, FY2018, and FY2019 considerably increased the account totals for those years. With supplementals included, the FY2019 appropriation was 62% higher than the FY2010 appropriation in inflation-adjusted dollars (Table 2 and Figure 5). The Construction account represented 8% of the total discretionary appropriation for FY2010 and 13% in FY2019 (including supplemental appropriations).
|
Figure 5. Appropriations for NPS's Construction Account, FY2010-FY2019 ($ millions, in nominal and inflation-adjusted 2010 dollars) |
 |
|
Sources: FY2010-FY2014 data are from annual House Appropriations Committee detailed tables for NPS. FY2015-FY2018 data are from NPS budget justifications for FY2017-FY2020. FY2019 data are from annual House Appropriations Committee detailed tables for NPS and P.L. 116-20. Notes: See footnote 1 for additional information on this figure. |
Among the specific activities funded in the Construction account, the largest is line-item construction and maintenance (see box above), which covers construction of new facilities and rehabilitation and replacement of existing facilities. Appropriations for this budget activity rose by 55% in inflation-adjusted dollars between FY2010 and FY2019.8 As mentioned above, in recent years NPS has not used the funding for any new facility construction. According to NPS, the activity "focuses on projects that repair or replace high priority mission critical and mission dependent assets, and ensures that investments are reasonable, cost effective, and fiscally sustainable over the life-time of the investment."9 Other activities funded in the Construction account include emergency and unscheduled construction, repair and replacement of employee housing, dam safety, equipment replacement, construction planning and program management, development of general management plans for park units, and preparation of special studies of areas (for instance, to assess their potential for inclusion in the National Park System).
Historic Preservation Fund
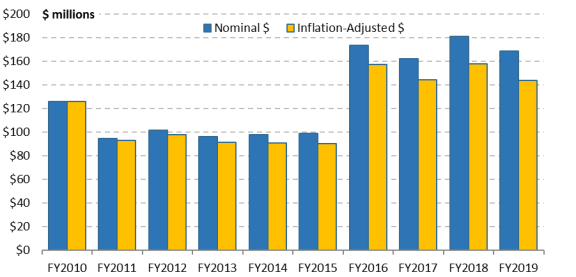
The Historic Preservation Fund (HPF), established in 1976, is administered by NPS through appropriations to the agency's HPF account. In accordance with the purposes of the National Historic Preservation Act (NHPA),10 the fund primarily provides grants-in-aid to state and tribal historic preservation offices for conservation of cultural and historical assets and sites. These grants are awarded by formula and require a 60% federal–40% state matching share. The HPF is funded by revenues from oil and gas activities on the U.S. outer continental shelf. Funding was reauthorized through FY2023 in P.L. 114-289.
The HPF receives $150 million annually in deposits from offshore oil and gas revenues, but the funding is available only to the extent appropriated by Congress. Annual appropriations from the account were less than the deposited amount throughout the decade, except in FY2019 (counting supplementals). Regular appropriations for the account declined after FY2010 but then grew in the latter part of the decade (Figure 6 and Table 2). The FY2019 appropriation was 10% higher in inflation-adjusted dollars than the FY2010 appropriation, not including supplemental appropriations. With the supplemental included, the FY2019 appropriation was 64% higher than FY2010. The HPF account represented approximately 3% of the total NPS appropriation in FY2010 and 5% in FY2019 (including supplementals).
The largest activity in the HPF account is grant funding for state historic preservation offices, which declined by 9% in inflation-adjusted terms over the decade. Grants for tribal historic preservation offices, on the other hand, rose by 25% after adjusting for inflation. The account also funded various competitive grant programs in particular years. For FY2019, these included grants for historically black colleges and universities (HBCUs), historic designation of properties associated with underrepresented communities, preservation of sites and stories associated with the civil rights movement, and the Save America's Treasures program to restore nationally significant historic structures and artifacts.
Supplemental appropriations augmented regular appropriations for the HPF account in three years—FY2013, FY2018, and FY2019—and were targeted primarily to hurricane recovery.11 The funding was mainly to assist recovering states and territories with compliance activities related to Section 106 of the NHPA.12 Under Section 106, undertakings that receive federal funds or permits—including some hurricane recovery activities—must be evaluated for their potential effects on historic properties.
|
Figure 6. Appropriations for NPS's Historic Preservation Fund (HPF) Account, FY2010-FY2019 ($ millions, in nominal and inflation-adjusted 2010 dollars) |
 |
|
Sources: FY2010-FY2014 data are from annual House Appropriations Committee detailed tables for NPS. FY2015-FY2018 data are from NPS budget justifications for FY2017-FY2020. FY2019 data are from annual House Appropriations Committee detailed tables for NPS and P.L. 116-20. Notes: See footnote 1 for additional information on this figure. |
Land Acquisition and State Assistance
The Land Acquisition and State Assistance (LASA) account represents NPS's share of appropriations from the Land and Water Conservation Fund (LWCF; 54 U.S.C. §§200301 et seq.). The LWCF, funded mainly from offshore oil and gas revenues, is the primary source for land acquisition funding for the four major federal land management agencies—NPS, the Bureau of Land Management, the Fish and Wildlife Service, and the Forest Service. In addition, the LWCF supports grants to states (and, through states, to localities) for assistance with recreation planning, acquiring recreational lands and waters, and developing outdoor recreational facilities.13 These 50/50 matching grants, administered by NPS, generally are allocated to states by formula. In recent years, a portion of the funding ($20.0 million for FY2019, out of a total of $124.0 million for state assistance) also has been appropriated for a nationally competitive grant program. The LWCF receives deposits of $900 million annually, primarily from offshore oil and gas revenues, but this funding is only available to the extent appropriated (at no point in the past decade was the "full funding" appropriated).
|
Figure 7. Appropriations for NPS's Land Acquisition and State Assistance (LASA) Account, FY2010-FY2019 ($ millions, in nominal and inflation-adjusted 2010 dollars) |
 |
|
Sources: FY2010-FY2014 data are from annual House Appropriations Committee detailed tables for NPS. FY2015-FY2018 data are from NPS budget justifications for FY2017-FY2020. FY2019 data are from annual House Appropriations Committee detailed tables for NPS. Notes: See footnote 1 for additional information on this figure. |
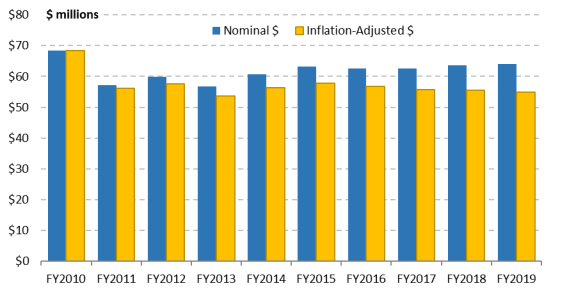
Appropriations for the LASA account—including both NPS federal land acquisition and assistance to states—varied during the decade and rose overall, with the highest amounts appropriated in the past four years (see Figure 7 and Table 2). The appropriation grew from $126.3 million in FY2010 to $168.4 million in FY2019.14 Adjusted for inflation, this is a growth of 14%. The LASA account represented approximately 5% of the total NPS appropriation in both FY2010 and FY2019.
The increase in funding for the account is largely attributable to higher appropriations for the state assistance program in recent years. The FY2019 appropriation for NPS federal land acquisition was 56% lower than FY2010 when adjusted for inflation. By contrast, the appropriation for NPS assistance to states grew over the decade by 165% in inflation-adjusted dollars. State assistance was roughly $40 million-$50 million annually for FY2010-FY2015, and more than doubled in nominal dollars, reaching $110 million-$125 million, for FY2016-FY2019. For land acquisition by NPS, the funding was $86 million in FY2010 and ranged between $44 million and $65 million thereafter.15
National Recreation and Preservation Account
The National Recreation and Preservation (NR&P) account funds NPS programs that primarily assist state, local, tribal, and private land managers with outdoor recreation planning, natural and cultural resource preservation, and other activities outside the National Park System. Appropriations for the account fluctuated during the decade and declined overall, by 20% in inflation-adjusted dollars (Figure 8 and Table 2). The portion of total NPS funding used for the NR&P account was roughly the same (2%) at the beginning and end of the decade. The NR&P account was not a recipient of supplemental funding during the decade.
|
Figure 8. Appropriations for NPS's National Recreation and Preservation (NR&P) Account, FY2010-FY2019 ($ millions, in nominal and inflation-adjusted 2010 dollars) |
 |
|
Sources: FY2010-FY2014 data are from annual House Appropriations Committee detailed tables for NPS. FY2015-FY2018 data are from NPS budget justifications for FY2017-FY2020. FY2019 data are from annual House Appropriations Committee detailed tables for NPS. Notes: See footnote 1 for additional information on this figure. |
A variety of natural, cultural, and recreational assistance programs are funded in the NR&P account. The Heritage Partnership Program, which provides NPS assistance to national heritage areas, is the largest single program in the account.16 Its appropriations stayed relatively steady over the decade in inflation-adjusted dollars,17 despite budget requests from the Obama and Trump Administrations to significantly reduce it. There were 49 heritage areas for almost all of the decade, until Congress established 6 new heritage areas in March 2019 in P.L. 116-9. The NR&P account also has included other programs that assist nonfederal entities, such as the American Battlefield Protection Program;18 Rivers, Trails, and Conservation Assistance Program; National Natural Landmarks and National Historic Landmarks Programs; National Register of Historic Places; and Preserve America Program. The account further covers international park affairs, environmental and compliance review, and grants administration.
Centennial Challenge
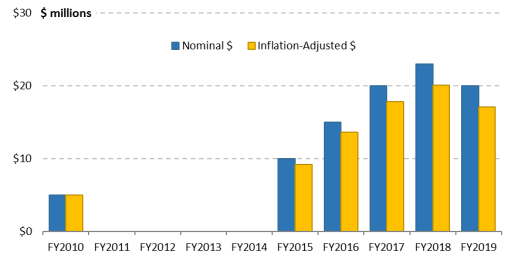
The Centennial Challenge account was funded during certain years of the decade (FY2010 and FY2015-FY2019). The account consists of a matching-grant program to spur partner donations for park improvements, primarily aimed at addressing deferred maintenance.19 The name "Centennial Challenge" indicates the fund's origin as a program to improve the parks in anticipation of NPS's 2016 centennial anniversary and its second century of park management.20 Both the Bush and Obama Administrations had proposed discretionary and mandatory funding for the fund prior to its legislative establishment in December 2016 (P.L. 114-289), and Congress had provided discretionary appropriations in some years, starting in FY2008. P.L. 114-289 codified the Centennial Challenge Fund and authorized it to receive federal revenues from certain sales of National Parks and Federal Recreational Lands Passes to seniors, in addition to discretionary appropriations. The senior pass revenues are provided as offsetting collections.21 Revenues are to be matched on at least a one-to-one basis by nonfederal donations.
|
Figure 9. Appropriations for NPS's Centennial Challenge Account, FY2010-FY2019 ($ millions, in nominal and inflation-adjusted 2010 dollars) |
 |
|
Sources: FY2010-FY2014 data are from annual House Appropriations Committee detailed tables for NPS. FY2015-FY2018 data are from NPS budget justifications for FY2017-FY2020. FY2019 data are from annual House Appropriations Committee detailed tables for NPS. Notes: See footnote 1 for additional information on this figure. |
During the past decade, Congress appropriated $5.0 million for the fund in 2010 and then did not make further appropriations until FY2015 (Table 2 and Figure 9). Starting in that year, Congress appropriated mainly increasing amounts, and the FY2019 appropriation represented an increase of 242% over FY2010 in inflation-adjusted dollars.22 The account represented less than 1% of total NPS appropriations in both FY2010 and FY2019.
NPS Appropriations in Context
Changes in NPS appropriations can be considered in the context of the National Park System's size, the number of visits to the parks, and NPS staffing levels, among other factors. Over the past decade, the acreage of the National Park System remained relatively stable, growing by 1%, while 28 new units were added.23 Visitation peaked in 2016 and was generally higher in the second part of the decade than the first. Staffing levels fluctuated around 20,000 full-time equivalent (FTE) employees during the past 10 years and were lower at the end of the decade than at the beginning.
Size of the National Park System
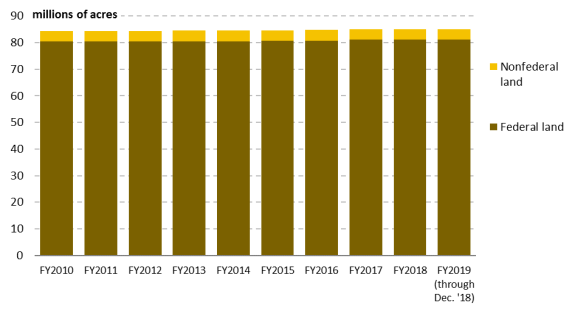
National Park System acreage grew slightly over the decade, from 84.4 million acres to 85.1 million acres, a growth of 1%. (See Figure 10 and Table 3.) The percentage of National Park System lands owned by the federal government remained steady, at 95% of total system lands.24 The remainder—the nonfederal land in the system—includes lands within park boundaries that are owned by state or local governments and by private landowners.
A total of 28 units were added to the system in the FY2010-FY2019 period. Many were relatively small in acreage, such as Stonewall National Monument in New York (0.12 acres) and Belmont-Paul Women's Equality National Monument in Washington, DC (0.34 acres), which each consist of a single building. The largest units added to the system during the decade were Valles Caldera National Preserve in New Mexico (89,000 acres) and Katahdin Woods and Waters National Monument in Maine (87,563 acres). Other acreage changes resulted from boundary adjustments in existing parks.25
|
Figure 10. Size of the National Park System, FY2010-FY2019 (in millions of acres) |
 |
|
Sources: NPS Land Resources Division, annual summaries of acreage, available at https://www.nps.gov/subjects/lwcf/acreagereports.htm. FY2019 figures are as of December 31, 2018, the most recent data available. Notes: "Federal land" category includes NPS Fee Acres, Less Than Fee Acres, and Other Federal Fee Acres. "Nonfederal land" category includes Other Public Acres and Private Acres. |
|
Federal Land |
Nonfederal Land |
Total Acreage |
|
|
FY2010 |
80.518 |
3.863 |
84.381 |
|
FY2011 |
80.485 |
3.900 |
84.385 |
|
FY2012 |
80.384 |
4.039 |
84.423 |
|
FY2013 |
80.473 |
4.007 |
84.479 |
|
FY2014 |
80.466 |
4.012 |
84.478 |
|
FY2015 |
80.598 |
4.021 |
84.616 |
|
FY2016 |
80.629 |
4.019 |
84.736 |
|
FY2017 |
81.008 |
4.031 |
85.039 |
|
FY2018 |
81.011 |
4.034 |
85.040 |
|
FY2019 (through Dec. 2018) |
81.041 |
4.010 |
85.051 |
Sources: NPS Land Resources Division, annual summaries of acreage, available at https://www.nps.gov/subjects/lwcf/acreagereports.htm. FY2019 figures are as of December 31, 2018, the most recent data available.
Notes: Federal Land category includes NPS Fee Acres, Less Than Fee Acres, and Other Federal Fee Acres. Nonfederal Land category includes Other Public Acres and Private Acres.
Visits to the National Parks
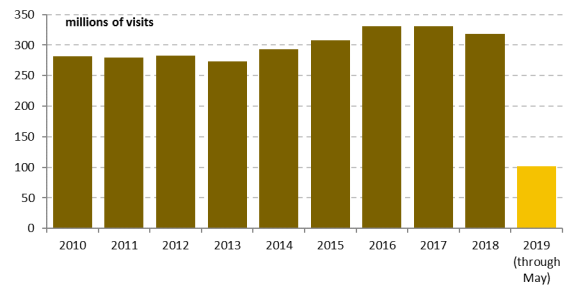
Numbers of recreational visits to the National Park System varied over the past 10 years but were generally higher toward the end of the decade. The highest numbers of visits were in 2016 (331.0 million visits) and 2017 (330.9 million visits; see Figure 11 and Table 4). Visits at the end of the decade were 13% higher than at the beginning.26 Many factors may affect the number of visitors to the parks in a given year, including national economic conditions, weather, changes in population demographics, park promotional campaigns, competing recreational choices, park closures due to natural disasters or lapses in appropriations, and other factors.
|
Figure 11. Annual Recreational Visits to the National Park System, 2010-2019 (total visits in millions, by calendar year) |
 |
|
Source: National Park Service, NPS Stats, at https://irma.nps.gov/Stats/Reports/National. Notes: The figure for 2019 shows visits through May 2019 (101.9 million visits). For comparison with the previous year, visits through May 2018 totaled 105.6 million. |
Table 4. Annual Recreational Visits to the National Park System, 2010-2019
(total visits in millions, by calendar year)
|
Year |
Number of Visits |
Year |
Number of Visits |
|
2010 |
281.3 |
2015 |
307.2 |
|
2011 |
278.9 |
2016 |
331.0 |
|
2012 |
282.8 |
2017 |
330.9 |
|
2013 |
273.6 |
2018 |
318.2 |
|
2014 |
292.8 |
2019 (thr. May) |
101.9 |
Source: NPS, NPS Stats, at https://irma.nps.gov/Stats/Reports/National.
Notes: The figure for 2019 shows visits through May 2019. For comparison with the previous year, visits through May 2018 were 105.6 million.
NPS visitation for 2019 is available through the end of May 2019. The year-to-date total of 101.9 million visitors is lower than the total for the same five-month span in 2018 (105.6 million visitors). Visitation was lower in most months of 2019 than in the comparable months of 2018, with the greatest difference (-21%) during January, when NPS experienced a government shutdown due to a lapse in FY2019 appropriations.27
National Park Service Staffing
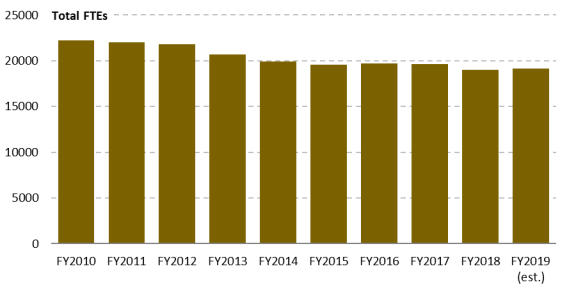
NPS full-time equivalent (FTE) staffing levels were highest in the earlier part of the decade. FTE staffing ranged from a high of 22,211 in FY2010 to a low of 19,032 in FY2018 (Figure 12 and Table 5). Estimated staffing for FY2019 (19,114 FTE employees) is 14% lower than at the beginning of the decade.28
|
Figure 12. NPS Full-Time Equivalent (FTE) Staff, FY2010-FY2019 |
 |
|
Sources: FY2010-FY2015 numbers from U.S. Department of the Interior, "Department of the Interior FTE History: Full-Time Equivalent Staff Year (FTE) Actual of Bureaus and Offices," at https://www.doi.gov/sites/doi.gov/files/uploads/fte-_history_table-20161108.pdf. FY2016-FY2019 numbers from NPS budget justifications. Note: NPS's FTE estimate for FY2019 was based on an appropriations baseline of $3.202 billion derived from a continuing resolution, whereas the final appropriation for FY2019 was $3.222 billion (excluding supplementals). |
|
Year |
Number of FTEs |
Year |
Number of FTEs |
|
FY2010 |
22,211 |
FY2015 |
19,539 |
|
FY2011 |
22,051 |
FY2016 |
19,722 |
|
FY2012 |
21,830 |
FY2017 |
19,668 |
|
FY2013 |
20,720 |
FY2018 |
19,032 |
|
FY2014 |
19,894 |
FY2019 (est.) |
19,114 |
Sources: FY2010-FY2015 numbers from U.S. Department of the Interior, "Department of the Interior FTE History: Full-Time Equivalent Staff Year (FTE) Actual of Bureaus and Offices," at https://www.doi.gov/sites/doi.gov/files/uploads/fte-_history_table-20161108.pdf. FY2016-FY2019 numbers from NPS budget justifications.
Note: NPS's FTE estimate for FY2019 was based on an appropriations baseline of $3.202 billion derived from a continuing resolution, whereas the final appropriation for FY2019 was $3.222 billion (excluding supplementals).
Summary
NPS's discretionary appropriations fluctuated over the past decade, with an overall trend of decline in the first part of the decade and growth in the second part. Supplemental appropriations for disaster relief increased the totals in FY2013, FY2018, and FY2019. Counting the supplementals, the total NPS discretionary appropriation for FY2019 was 22% higher than FY2010 in nominal dollars and 4% higher in inflation-adjusted dollars. Excluding supplementals, the FY2019 appropriation was 17% higher than FY2010 in nominal dollars and less than 1% higher in inflation-adjusted dollars. The share of total appropriations represented by each individual account in the NPS portfolio also fluctuated, although the account covering park operations represented the highest share by far throughout the decade.
The funding changes took place in the context of a park system of relatively stable size and a staffing level that declined by approximately 14% during the decade. Although park acreage grew only slightly, 28 units were added to the system over the ten-year period. Visits to the parks generally were higher in the second half of the decade than the first and peaked in 2016 at approximately 331 million visits.
A major funding issue for NPS is infrastructure reinvestment. The agency's backlog of deferred maintenance and repairs was estimated at $11.92 billion for FY2018. The identified backlog amount declined in inflation-adjusted dollars but grew in nominal dollars over the decade. Combined funding for two discretionary subaccounts that mainly address deferred maintenance (within the ONPS and Construction accounts) increased by about 50% in inflation-adjusted dollars over this period. NPS's infrastructure needs continue to receive attention in the 116th Congress, both within and outside the annual appropriations process.