China's rise from a poor developing country to a major economic power in about four decades has been spectacular. From 1979 (when economic reforms began) to 2017, China's real gross domestic product (GDP) grew at an average annual rate of nearly 10%.1 According to the World Bank, China has "experienced the fastest sustained expansion by a major economy in history—and has lifted more than 800 million people out of poverty."2 China has emerged as a major global economic power. For example, it ranks first in terms of economic size on a purchasing power parity (PPP) basis, value-added manufacturing, merchandise trade, and holder of foreign exchange reserves.
China's rapid economic growth has led to a substantial increase in bilateral commercial ties with the United States. According to U.S. trade data, total trade between the two countries grew from $5 billion in 1980 to $660 billion in 2018. China is currently the United States' largest merchandise trading partner, its third-largest export market, and its largest source of imports. Many U.S. companies have extensive operations in China in order to sell their products in the booming Chinese market and to take advantage of lower-cost labor for export-oriented manufacturing.3 These operations have helped some U.S. firms to remain internationally competitive and have supplied U.S. consumers with a variety of low-cost goods. China's large-scale purchases of U.S. Treasury securities (which totaled $1.1 trillion as of April 2019 have enabled the federal government to fund its budget deficits, which help keep U.S. interest rates relatively low.4
However, the emergence of China as a major economic power has raised concern among many U.S. policymakers. Some claim that China uses unfair trade practices (such as an undervalued currency and subsidies given to domestic producers) to flood U.S. markets with low-cost goods, and that such practices threaten American jobs, wages, and living standards. Others contend that China's growing use of industrial policies to promote and protect certain domestic Chinese industries or firms favored by the government, and its failure to take effective action against widespread infringement and theft of U.S. intellectual property rights (IPR) in China, threaten to undermine the competitiveness of U.S. IP-intensive industries. In addition, while China has become a large and growing market for U.S. exports, critics contend that numerous trade and investment barriers limit opportunities for U.S. firms to sell in China, or force them to set up production facilities in China as the price of doing business there.
The Chinese government views a growing economy as vital to maintaining social stability. However, China faces a number of major economic challenges that could dampen future growth, including distortive economic policies that have resulted in overreliance on fixed investment and exports for economic growth (rather than on consumer demand), government support for state-owned firms, a weak banking system, widening income gaps, growing pollution, and the relative lack of the rule of law in China. The Chinese government has acknowledged these problems and has pledged to address them by implementing policies to increase the role of the market in the economy, boost innovation, make consumer spending the driving force of the economy, expand social safety net coverage, encourage the development of less-polluting industries (such as services), and crack down on official government corruption. The ability of the Chinese government to implement such reforms will likely determine whether China can continue to maintain relatively rapid economic growth rates, or will instead begin to experience significantly lower growth rates.
China's growing economic power has led it to become increasingly involved in global economic policies and projects, especially infrastructure development. China's Belt and Road initiative (BRI) represents a grand strategy by China to finance infrastructure throughout Asia, Europe, Africa, and beyond. If successful, China's economic initiatives could significantly expand export and investment markets for China and increase its "soft power" globally.
This report provides background on China's economic rise; describes its current economic structure; identifies the challenges China faces to maintain economic growth; and discusses the challenges, opportunities, and implications of China's economic rise for the United States.
The History of China's Economic Development
China's Economy Prior to Reforms
Prior to 1979, China, under the leadership of Chairman Mao Zedong, maintained a centrally planned, or command, economy. A large share of the country's economic output was directed and controlled by the state, which set production goals, controlled prices, and allocated resources throughout most of the economy. During the 1950s, all of China's individual household farms were collectivized into large communes. To support rapid industrialization, the central government undertook large-scale investments in physical and human capital during the 1960s and 1970s. As a result, by 1978 nearly three-fourths of industrial production was produced by centrally controlled, state-owned enterprises (SOEs), according to centrally planned output targets. Private enterprises and foreign-invested firms were generally barred. A central goal of the Chinese government was to make China's economy relatively self-sufficient. Foreign trade was generally limited to obtaining those goods that could not be made or obtained in China. Such policies created distortions in the economy. Since most aspects of the economy were managed and run by the central government, there were no market mechanisms to efficiently allocate resources, and thus there were few incentives for firms, workers, and farmers to become more productive or be concerned with the quality of what they produced (since they were mainly focused on production goals set by the government).
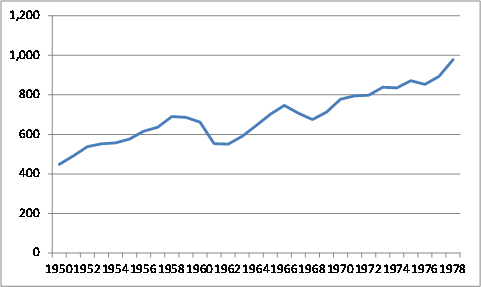
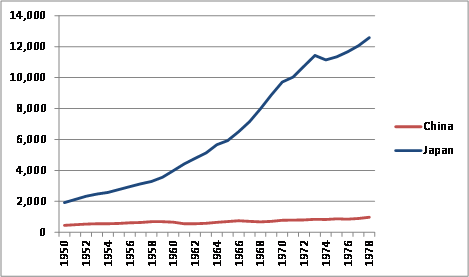
According to Chinese government statistics, China's real GDP grew at an average annual rate of 6.7% from 1953 to 1978, although the accuracy of these data has been questioned by many analysts, some of whom contend that during this period, Chinese government officials (especially at the subnational levels) often exaggerated production levels for a variety of political reasons. Economist Angus Maddison puts China's actual average annual real GDP growth during this period at about 4.4%.5 In addition, China's economy suffered significant economic downturns during the leadership of Chairman Mao Zedong, including during the Great Leap Forward from 1958 to 1962 (which led to a massive famine and reportedly the deaths of up to 45 million people)6 and the Cultural Revolution from 1966 to 1976 (which caused widespread political chaos and greatly disrupted the economy). From 1950 to 1978, China's per capita GDP on a purchasing power parity (PPP) basis,7 a common measurement of a country's living standards, doubled. However, from 1958 to 1962, Chinese living standards fell by 20.3%, and from 1966 to 1968, they dropped by 9.6% (see Figure 1). In addition, the growth in Chinese living standards paled in comparison to those in the West, such as Japan, as indicated in Figure 2.
|
Figure 1. Chinese Per Capita GDP: 1950-1978 ($ billions, PPP basis) |
 |
|
Source: Angus Maddison, Historical, Statistics of the World Economy: 1-2008 AD. |
|
Figure 2. Comparison of Chinese and Japanese Per Capita GDP: 1950-1978 ($ billions, PPP basis) |
 |
|
Source: Angus Maddison, Historical, Statistics of the World Economy: 1-2008 AD. |
In 1978, (shortly after the death of Chairman Mao in 1976), the Chinese government decided to break with its Soviet-style economic policies by gradually reforming the economy according to free market principles and opening up trade and investment with the West, in the hope that this would significantly increase economic growth and raise living standards. As Chinese leader Deng Xiaoping, the architect of China's economic reforms, put it: "Black cat, white cat, what does it matter what color the cat is as long as it catches mice?"8
The Introduction of Economic Reforms
Beginning in 1979, China launched several economic reforms. The central government initiated price and ownership incentives for farmers, which enabled them to sell a portion of their crops on the free market. In addition, the government established four special economic zones along the coast for the purpose of attracting foreign investment, boosting exports, and importing high technology products into China. Additional reforms, which followed in stages, sought to decentralize economic policymaking in several sectors, especially trade. Economic control of various enterprises was given to provincial and local governments, which were generally allowed to operate and compete on free market principles, rather than under the direction and guidance of state planning. In addition, citizens were encouraged to start their own businesses. Additional coastal regions and cities were designated as open cities and development zones, which allowed them to experiment with free-market reforms and to offer tax and trade incentives to attract foreign investment. In addition, state price controls on a wide range of products were gradually eliminated. Trade liberalization was also a major key to China's economic success. Removing trade barriers encouraged greater competition and attracted FDI inflows. China's gradual implementation of economic reforms sought to identify which policies produced favorable economic outcomes (and which did not) so that they could be implemented in other parts of the country, a process Deng Xiaoping reportedly referred to as "crossing the river by touching the stones."9
China's Economic Growth and Reforms: 1979-the Present
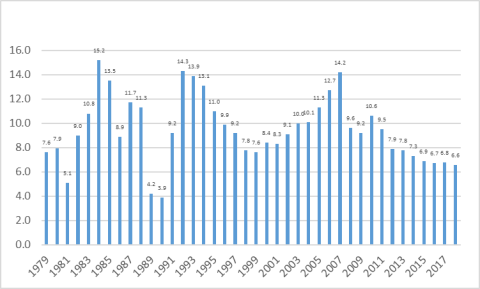
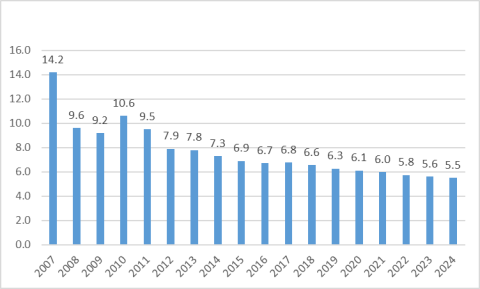
Since the introduction of economic reforms, China's economy has grown substantially faster than during the pre-reform period, and, for the most part, has avoided major economic disruptions.10 From 1979 to 2018, China's annual real GDP averaged 9.5% (see Figure 3). This has meant that on average China has been able to double the size of its economy in real terms every eight years. The global economic slowdown, which began in 2008, had a significant impact on the Chinese economy. China's media reported in early 2009 that 20 million migrant workers had returned home after losing their jobs because of the financial crisis and that real GDP growth in the fourth quarter of 2008 had fallen to 6.8% year-on-year. The Chinese government responded by implementing a $586 billion economic stimulus package, aimed largely at funding infrastructure and loosening monetary policies to increase bank lending.11 Such policies enabled China to counter the effects of the sharp global fall in demand for Chinese products. From 2008 to 2010, China's real GDP growth averaged 9.7%. However, the rate of GDP growth declined slowed for the next six consecutive years, falling from 10.6% in 2010 to 6.7% in 2016. Real GDP ticked up to 6.8% in 2017, but slowed to 6.6% in 2018, (although it rose to 6.8% in 2017). The IMF's April 2019 World Economic Outlook projects that China's real GDP growth will slow each year over the next six years, falling to 5.5% in 2024 (Figure 4).12 Many economists warn that China's economic growth could slow further if the United States and China continue to impose punitive economic measures against each other, such the tariff hikes that have resulted from U.S. action under Section 301 and Chinese retaliation. The Organization for Economic and Cooperation and Development (OECD) projects that increased tariffs on all trade between the United States and China could reduce China's real GDP in 2021-2022 by 1.1% relative to the OECD's baseline economic projections.13
|
Figure 3. Chinese Annual Real GDP Growth: 1979-2018 (percentage change) |
 |
|
Figure 4. China's Real Annual GDP Growth: 2007-2018 and Projections through 2024 (percentage) |
 |
|
Source: IMF, World Economic Outlook Database, April 2019, |
Causes of China's Economic Growth
Economists generally attribute much of China's rapid economic growth to two main factors: large-scale capital investment (financed by large domestic savings and foreign investment) and rapid productivity growth. These two factors appear to have gone together hand in hand. Economic reforms led to higher efficiency in the economy, which boosted output and increased resources for additional investment in the economy.
China has historically maintained a high rate of savings. When reforms were initiated in 1979, domestic savings as a percentage of GDP stood at 32%. However, most Chinese savings during this period were generated by the profits of SOEs, which were used by the central government for domestic investment. Economic reforms, which included the decentralization of economic production, led to substantial growth in Chinese household savings as well as corporate savings. As a result, China's gross savings as a percentage of GDP is the highest among major economies. The large level of domestic savings has enabled China to support a high level of investment. In fact, China's gross domestic savings levels far exceed its domestic investment levels, which have made China a large net global lender.
Several economists have concluded that productivity gains (i.e., increases in efficiency) have been another major factor in China's rapid economic growth. The improvements to productivity were caused largely by a reallocation of resources to more productive uses, especially in sectors that were formerly heavily controlled by the central government, such as agriculture, trade, and services. For example, agricultural reforms boosted production, freeing workers to pursue employment in the more productive manufacturing sector. China's decentralization of the economy led to the rise of non-state enterprises (such as private firms), which tended to pursue more productive activities than the centrally controlled SOEs and were more market-oriented and more efficient. Additionally, a greater share of the economy (mainly the export sector) was exposed to competitive forces. Local and provincial governments were allowed to establish and operate various enterprises without interference from the government. In addition, FDI in China brought with it new technology and processes that boosted efficiency.
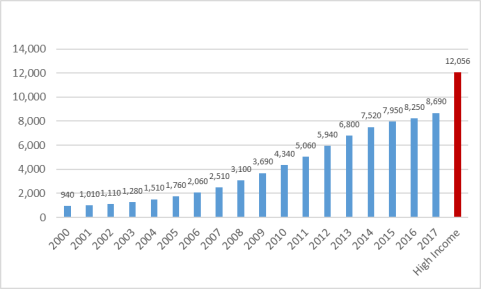
However, as China's technological development begins to converge with major developed countries (i.e., through its adoption of foreign technology), its level of productivity gains, and thus, real GDP growth, could slow significantly from its historic levels unless China becomes a major center for new technology and innovation and/or implements new comprehensive economic reforms. Several developing economies (notably several in Asia and Latin America) experienced rapid economic development and growth during the 1960s and 1970s by implementing some of the same policies that China has utilized to date to develop its economy, such as measures to boost exports and to promote and protect certain industries. However, at some point in their development, some of these countries began to experience economic stagnation (or much slower growth compared to previous levels) over a sustained time, a phenomenon described by economists as the "middle-income trap."14 This means that several developing (low-income) economies were able to transition to a middle-income economy, but because they were unable to sustain high levels of productivity gains (in part, because they could not address structural inefficiencies in the economy), they were unable to transition to a high-income economy.15 China may be at a similar crossroads now. The World Bank classifies development levels of economies using a per capita gross national income (GNI) methodology.16 According to the World Bank, China went from a low-income economy to a low-middle-income economy in 1997, and in 2010, it became an upper-middle-income country. China's 2017 per capita GNI (at $8,690) was 38.7% below the level China would need to obtain to become a high-income economy. The Chinese government projects that China can cross the high-income threshold by 2025. It hopes to achieve this largely by making innovation a major source of future economic growth. Skeptics contend that innovation growth in China will be hard to achieve, especially if it is mainly state-driven and imposes new restrictions on foreign firms,
|
Figure 5. World Bank Measurements of China's Per Capita GNI: 2000-2017 ($ U.S.) |
 |
|
Source: World Bank Notes: Bar in red indicates the level China would need to reach to become a high-income economy. |
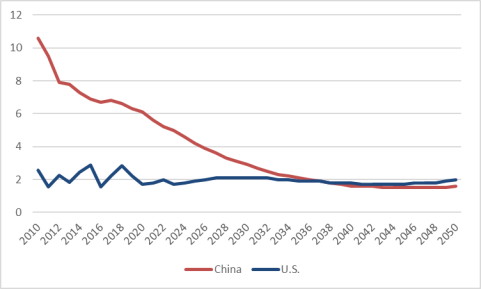
The Economist Intelligence Unit (EIU) projects that China's real GDP growth will slow considerably over the next several decades, eventually converging on U.S. growth rates by the year 2037 (U.S. and Chinese real GDP growth rates are both projected at 1.9%). For some years thereafter, EIU projects U.S. GDP growth to be greater than China's (Figure 6).17
|
Figure 6. U.S. and Chinese Annual Real GDP Growth Rates in 2010-2018 and Projections through 2050 (percentage) |
 |
|
Source: EIU Database (accessed on June 24, 2019). |
The Chinese government has indicated its desire to move away from its current economic model of fast growth at any cost to more "smart" economic growth, which seeks to reduce reliance on energy-intensive and high-polluting industries and rely more on high technology, green energy, and services. China also has indicated it wants to obtain more balanced economic growth. (These issues are discussed in more detail later in the report.)
Measuring the Size of China's Economy
The rapid growth of the Chinese economy has led many analysts to speculate if and when China will overtake the United States as the "world's largest economic power." The "actual" size of China's economy has been a subject of extensive debate among economists. Measured in U.S. dollars using nominal exchange rates, China's GDP in 2018 in nominal U.S. dollars was $13.4 trillion, which was 65.3% of the size of the U.S. economy, according to estimates made by the IMF. China's 2018 per capita GDP in nominal dollars was $9,608, which was 15.3% of the U.S. per capita level.
Many economists contend that using nominal exchange rates to convert Chinese data (or those of other countries) into U.S. dollars fails to reflect the true size of China's economy and living standards relative to the United States. Nominal exchange rates simply reflect the prices of foreign currencies vis-à-vis the U.S. dollar, and such measurements exclude differences in the prices for goods and services across countries. To illustrate, one U.S. dollar exchanged for local currency in China would buy more goods and services there than it would in the United States. This is because prices for goods and services in China are generally lower than they are in the United States. Conversely, prices for goods and services in Japan are generally higher than they are in the United States (and China). Thus, one dollar exchanged for local Japanese currency would buy fewer goods and services there than it would in the United States. Economists attempt to develop estimates of exchange rates based on their actual purchasing power relative to the dollar in order to make more accurate comparisons of economic data across countries, usually referred to as purchasing power parity (PPP).
The PPP exchange rate increases the (estimated) measurement of China's economy and its per capita GDP. According to the IMF (which uses price surveys conducted by the World Bank), prices for goods and services in China are about half the level they are in the United States. Adjusting for this price differential raises the value of China's 2018 GDP from $13.4 trillion (nominal dollars) to $25.3 trillion (on a PPP basis) (see Table 1).18 IMF data indicate that China overtook the United States as the world's largest economy in 2014 on a PPP basis.19
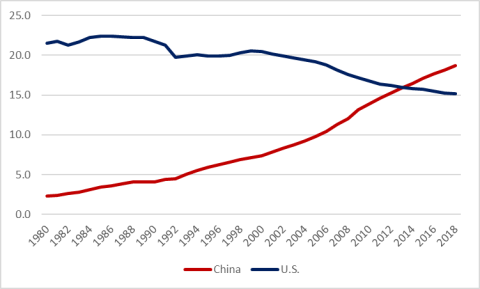
China's share of global GDP on a PPP basis rose from 2.3% in 1980 to an estimated 18.3% in 2017, while the U.S. share of global GDP on a PPP basis fell from 24.3% to an estimated 15.3%.20 This would not be the first time in history that China was the world's largest economy (see text box). China's economic ascendency as the world largest economy has been impressive, especially considering that in 1980, China's GDP on a PPP basis was only one-tenth that of the United States (see
Figure 7). The IMF predicts that by 2024, China's economy will be 56% larger than the U.S. economy on a PPP basis.
Table 1. Comparisons of Chinese, Japanese, and U.S. GDP and Per Capita GDP in Nominal U.S. Dollars and a Purchasing Power Parity Basis: 2018
|
China |
United States |
|||
|
Nominal GDP ($ billions) |
|
|
||
|
GDP in PPP ($ billions) |
|
|
||
|
Nominal Per Capita GDP ($) |
|
|
||
|
Per Capita GDP in PPP ($) |
|
|
Source: IMF, World Economic Forum.
|
The Decline and Rise of China's Economy According to a study by economist Angus Maddison, China was the world's largest economy in 1820, accounting for an estimated 32.9% of global GDP. However, foreign and civil wars, internal strife, weak and ineffective governments, natural disasters (some of which were man-made), and distortive economic policies caused China's share of global GDP on a PPP basis to shrink significantly. By 1952, China's share of global GDP had fallen to 5.2%, and by 1978, it slid to 4.9%. The adoption of economic reforms by China in the late 1970s led to a surge in China's economic growth and helped restore China as a major global economic power. Source: The Organization for Economic Cooperation and Development, Chinese Economic Performance in the Long Run, 960-2030, by Angus Maddison, 2007. |
|
Figure 7. U.S. and Chinese GDP (PPP Basis) as a Share of Global Total: 1980-2018 (%) |
 |
|
Source: IMF, World Economic Outlook, April 2019. |
The PPP measurement also raises China's 2018 nominal per capita GDP (from $9,608) to $18,110, which was 28.9% of the U.S. level. Even with continued rapid economic growth, it would likely take many years for Chinese living standards to approach U.S. levels.
China as the World's Largest Manufacturer
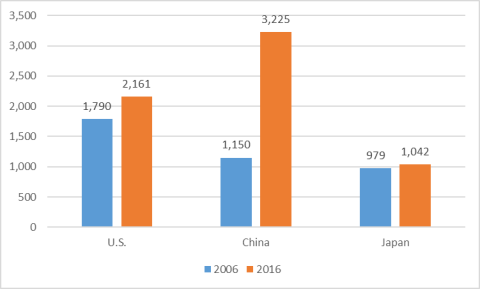
China has emerged as the world's largest manufacturer according to the World Bank. Figure 8 lists estimates of the gross value added of manufacturing in China, the United States, and Japan expressed in U.S. dollars in 2006 and 2016. Gross value added data reflect the actual value of manufacturing that occurred in the country (i.e., they subtract the value of intermediate inputs and raw materials used in production). In 2016, the value of China's manufacturing on a gross value added basis was 49.2% higher than the U.S. level. Manufacturing plays a considerably more important role in the Chinese economy than it does for the United States. In 2016, China's gross valued added manufacturing was equal to 28.7% of its GDP, compared to 11.6% for the United States.21
|
Figure 8. Gross Value Added Manufacturing in China, the United States, and Japan: 2006 and 2016 ($ billions) |
 |
|
Source: The World Bank. |
In its 2016 Global Manufacturing Competitiveness Index, Deloitte (an international consulting firm) ranked China as the world's most competitive manufacturer (out of 40 countries), based on a survey of global manufacturing executives, while the United States ranked second (it ranked fourth in 2010). The index found that global executives predicted that the United States would overtake China by 2020 to become the world's most competitive economy, largely because of its heavy investment in talent and technology (e.g., high levels of R&D spending and activities, the presence of top-notch universities, and large amounts of venture capital being invested in advanced technologies). On the other hand, while China was expected to remain a major manufacturing power because of its large R&D spending levels, movement toward higher-valued, advanced manufacturing, government policies to promote innovation, and a large pool of graduates in science, technology, engineering and mathematics, it was viewed as facing several challenges, including a slowing economy, a decline in value-added manufacturing and overcapacity in several industries, rising labor costs, and a rapidly aging population. As a result, China was projected to fall to the second-most competitive manufacturer by 2020.22
More broadly, the World Economic Forum (WEF) produces an annual report that assesses and ranks (based on an index) the global competitiveness of a country's entire economy, based on factors that determine the level of productivity of an economy, which in turn sets the level of prosperity that the country can achieve. The WEF's 2018 Global Competitive Index ranked China as the world's 28th-most competitive economy (out of 140 economies), while the United States ranked first.23
Changes in China's Wage and Labor Cost Advantages
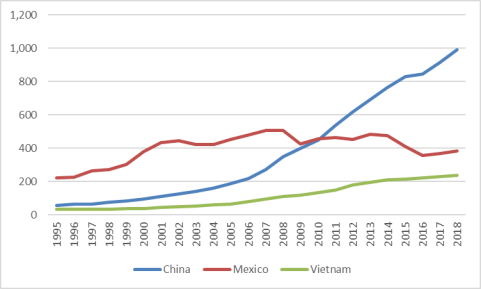
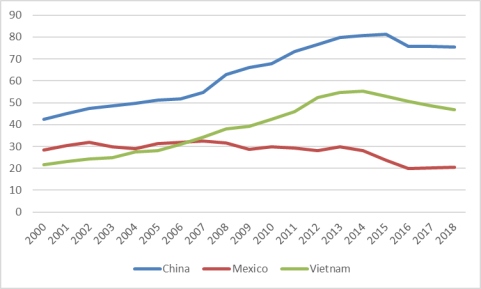
The decline in China's working age population may have contributed rising wages in China. As indicated in Figure 9, China's average monthly wages (converted into U.S. dollars) in 1990 were $55, compared with $32 for Vietnam and $221 for Mexico.24 However, in 2018, China's average monthly wages (at $990) were 316% higher than Vietnam's wages ($238) and 158.5% higher than Mexico's ($383). From 2007 to 2018, China's average monthly wages rose by 263%. The American Chamber of Commerce in China (AmCham China) 2019 Business Climate survey listed rising labor costs as the second-biggest challenge facing U.S. firms in China (56% of recipients cited them as their largest concern).25 Figure 10 shows a comparison of labor costs per unit of production for the countries listed in the previous figure, indexed relative to U.S levels. In 2000, China's unit labor production costs were 42.3 of U.S. levels and by 2018 they rose to 75.5% of U.S. levels.26
Foreign Direct Investment (FDI) in China
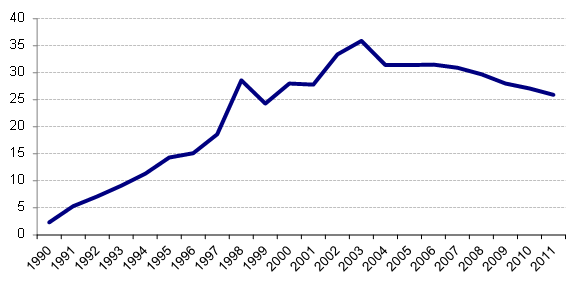
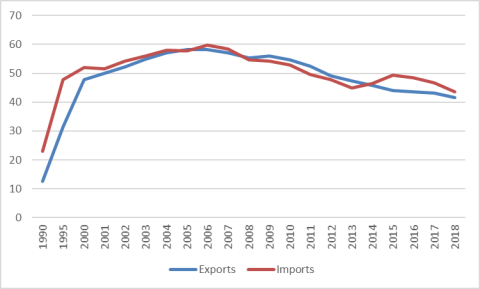
China's trade and investment reforms and incentives led to a surge in FDI beginning in the early 1990s. Such flows have been a major source of China's productivity gains and rapid economic and trade growth. There were reportedly 445,244 foreign-invested enterprises (FIEs) registered in China in 2010, employing 55.2 million workers or 15.9% of the urban workforce.27 As indicated in Figure 11, FIEs account for a significant share of China's industrial output. That level rose from 2.3% in 1990 to a high of 35.9% in 2003, but fell to 25.9% in 2011.28 In addition, FIEs are responsible for a significant level of China's foreign trade. At their peak, FIEs accounted for 58.3% of Chinese exports in 2005 and 59.7% of imports, but these levels have subsequently fallen, reaching 41.7% and 43.7%, respectively, in 2018 (see Figure 12).
|
Figure 11. Industrial Output by Foreign-Invested Firms in China as a Share of National Output Total: 1990-2011 (percentage) |
 |
|
Source: Invest in China (http://www.fdi.gov.cn) and China's 2012 Statistical Yearbook. |
|
Figure 12. Share of Chinese Merchandise Exports and Imports by Foreign-Invested Enterprises in China: 1990-2018 (percentage) |
 |
|
Source: Invest in China (http://www.fdi.gov.cn). |
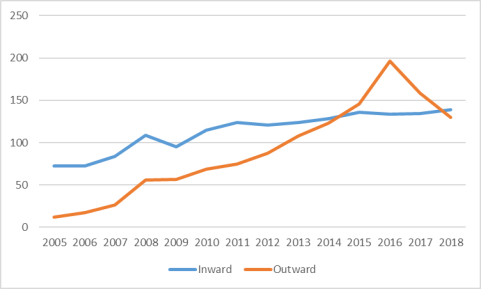
The United Nations Conference on Trade and Development (UNCTAD) reports that China has become a both a major recipient of global FDI as well as a major provider of FDI outflows (see Figure 13).29 China's FDI inflows in 2018 were $139 billion, making it the world's second-largest recipient of FDI after the United States.30 China's FDI outflows have grew rapidly after 2005 and exceeded FDI inflows for the first time in 2015. China's FDI outflows reached a historic peak of $196.1 billion in 2016, but declined in 2017 and 2018, reflecting a crackdown by the Chinese government on investment deemed wasteful and well as greater scrutiny by foreign governments of China's efforts to obtain advanced technology firms and other strategic assets. Still, China was the world's second-largest source of FDI outflows (after Japan).
|
Figure 13. Estimates of China's Annual FDI Inflows and Outflows: 2005-2018 ($ billions) |
 |
|
Source: UNCTAD Notes: UNCTAD FDI data differ from that reported by China. |
The sharp increase in China's global FDI outflows in recent years appears to be largely driven by a number of factors, including Chinese government policies and initiatives to encourage firms to "go global." The government wants to use FDI to gain access to IPR, technology, know-how, famous brands, etc., in order to move Chinese firms up the value-added chain in manufacturing and services, boost domestic innovation and development of Chinese brands, and help Chinese firms (especially SOEs) to become major global competitors.31 China's slowing economy and rising labor costs have also encouraged greater Chinese overseas FDI in order to help firms diversify risk and expand business opportunities beyond the China market, and, in some cases, to relocate less competitive firms from China to low-cost countries. China's Ministry of Foreign Trade (MOFCOM) reports that in 2018, Chinese nonfinancial FDI in BRI countries totaled $15.6 billion, up 8.9% over the previous year.32 Additionally, increased FDI outflows may be the result of the Chinese government attempting to diversify its foreign exchange reserve holdings (which totaled $3.1 trillion as of April 2019—by far the world's largest holder). The largest foreign investors in China (based on FDI stock through 2017) were Hong Kong (52.6% of total),33 the British Virgin Islands (10.6%), Japan (6.1%), Singapore (4.0%), and Germany (3.2%) (see Table 2).
Table 2. Chinese Data on Top Ten Sources of China's FDI Inflows to China: 1979-2017
($ billions and percentage of total)
|
Country |
Estimated Cumulative Utilized |
|
|
Amount |
% of Total |
|
|
Total |
2,688 |
100 |
|
Hong Kong |
1,241 |
46.2 |
|
British Virgin Islands |
286 |
10.6 |
|
Japan |
165 |
6.1 |
|
Singapore |
108 |
4.0 |
|
Germany |
87 |
3.2 |
|
S. Korea |
73 |
2.7 |
|
U.S. |
72 |
2.7 |
|
Cayman Islands |
49 |
1.8 |
|
The Netherlands |
37 |
1.4 |
|
Taiwan |
33 |
1.2 |
Source: IMF Coordinated Direct Investment Survey.
Factors Driving China's FDI Outflow Strategy
A key aspect of China's economic modernization and growth strategy during the 1980s and 1990s was to attract FDI into China to help boost the development of domestic firms. Investment by Chinese firms abroad was sharply restricted. However, in 2000, China's leaders initiated a new "go global" strategy, which sought to encourage Chinese firms (primarily SOEs) to invest overseas. One key factor driving this investment is China's massive accumulation of foreign exchange reserves. Traditionally, a significant level of those reserves has been invested in relatively safe but low-yielding assets, such as U.S. Treasury securities. On September 29, 2007, the Chinese government officially launched the China Investment Corporation (CIC) in an effort to seek more profitable returns on its foreign exchange reserves and diversify away from its U.S. dollar holdings.34 The CIC was originally funded at $200 billion, making it one of the world's largest sovereign wealth funds.35 Another factor behind the government's drive to encourage more outward FDI flows has been to obtain natural resources, such as oil and minerals, deemed by the government as necessary to sustain China's rapid economic growth.36 Finally, the Chinese government has indicated its goal of developing globally competitive Chinese firms with their own brands. Investing in foreign firms, or acquiring them, is viewed as a method for Chinese firms to obtain technology, management skills, and often, internationally recognized brands, needed to help Chinese firms become more globally competitive. For example, in April 2005, Lenovo Group Limited, a Chinese computer company, purchased IBM Corporation's personal computer division for $1.75 billion.37 The largest destinations of cumulative Chinese FDI outflows through 2017 were Hong Kong (54.2% of total), the Cayman Islands (13.9%), the British Virgin Islands (6.7%), and the United States (3.7%) (see Table 3).
Table 3. Major Destinations of Chinese Nonfinancial FDI Outflows by Stock through 2017
($ billions and percent of total)
|
Destination |
Stock of FDI through 2017 |
Share of FDI Stock through 2017 (%) |
|||
|
Total |
|
|
|||
|
Hong Kong |
|
|
|||
|
Cayman Islands |
|
|
|||
|
British Virgin Islands |
|
|
|||
|
United States |
|
|
|||
|
Singapore |
|
|
|||
|
Australia |
|
|
|||
|
United Kingdom |
|
|
Source: China Natural Bureau of Statistics.
Note: Ranked according to the top seven destinations of the stock of Chinese FDI outflows through 2017.
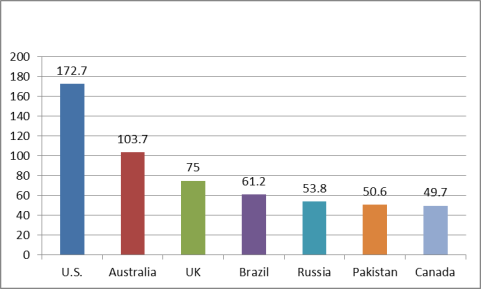
A significant level of Chinese FDI that goes to Hong Kong, the British Virgin Islands, and the Cayman Islands likely is redirected elsewhere. The American Enterprise Institute (AEI) maintain the China Global Investment Tracker (CGIT), a database that has been developed to track the actual flows (from the parent company to the final destination) of Chinese investment globally. The CGIT database tracks FDI valued at $100 million or more (which it refers to as "China's outward non-bond investment").38 These data differ significantly from official Chinese FDI outflow data. The CGIT data on the top destinations of total Chinese outward non-bond outward investment from 2005 to 2017 included the United States ($172.7 billion), Australia ($103.7 billion), the United Kingdom ($75 billion), Brazil ($61.2 billion), and Russia ($53.8) (see Figure 14).39
China's Merchandise Trade Patterns
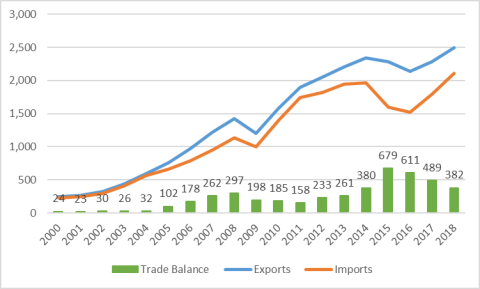
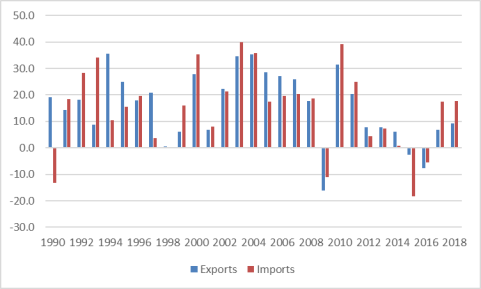
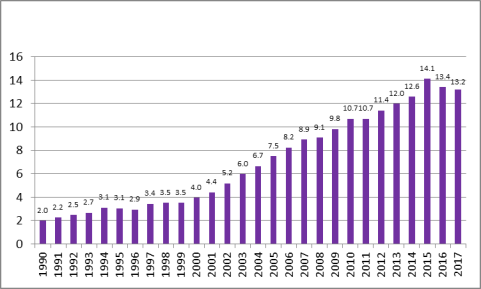
Economic reforms and trade and investment liberalization have helped transform China into a major trading power. Chinese merchandise exports rose from $14 billion in 1979 to $2.5 trillion in 2018, while merchandise imports grew from $18 billion to $2.1 trillion (see Table 4 and Figure 15). China's rapidly growing trade flows have made it an increasingly important (and often the largest) trading partner for many countries. According to China, it was the largest trading partner for 130 countries in 2013.40 From 2000 to 2008, the annual growth of China's merchandise exports and imports averaged 25.1% and 24.2%, respectively. However, China's exports and imports fell by 15.9% and 11.2%, respectively, due to the impact of the global financial crisis. China's trade recovered in 2010 and 2011, with export growth averaging 25.8% and import growth averaging 31.9%. However, since that time, China's trade growth slowed sharply. From 2012 to 2014, China's exports and imports grew at an average annual rate of 7.2% and 4.1%, respectively. From 2015 to 2016 exports and imports fell by an average rate of 4.7% and 11.6%, respectively (see Figure 16), reflecting a sluggish global economy and a decline in commodity prices (such as oil and ores). However, in 2017, China's exports and imports rose by 6.7% and 17.4%, respectively. Exports and imports in 2018 rose by 9.3 and 17.8%, respectively. However, during the first three months of 2001, China's exports grew by 1.0%, while imports fell 1.1% year-over-year. China's merchandise trade surplus grew sharply from 2004 to 2008, rising from $32 billion to $297 billion. That surplus fell each year over the next three years, dropping to $158 billion in 2011. However, it rose in each of the next four years, reaching a record $679 billion in 2015 before falling to $611 billion in 2016, $489 billion in 2017, and $382 billion in 2018. In 2009, China overtook Germany to become both the world's largest merchandise exporter and the second-largest merchandise importer (after the United States). In 2012, China overtook the United States as the world's largest merchandise trading economy (exports plus imports). As indicated in Figure 17, China's share of global merchandise exports grew from 2.0% in 1990 to 14.1% in 2015, but fell to 13.4% in 2016 and to 13.2% in 2017.
|
Year |
Exports |
Imports |
Trade Balance |
|
1979 |
13.7 |
15.7 |
-2.0 |
|
1980 |
18.1 |
19.5 |
-1.4 |
|
1985 |
27.3 |
42.5 |
-15.3 |
|
1990 |
62.9 |
53.9 |
9.0 |
|
1995 |
148.8 |
132.1 |
16.7 |
|
2000 |
249.2 |
225.1 |
24.1 |
|
2001 |
266.2 |
243.6 |
22.6 |
|
2002 |
325.6 |
295.2 |
30.4 |
|
2003 |
438.4 |
412.8 |
25.6 |
|
2004 |
593.4 |
561.4 |
32.0 |
|
2005 |
762.0 |
660.1 |
101.9 |
|
2006 |
969.1 |
791.5 |
177.6 |
|
2007 |
1,218.0 |
955.8 |
262.2 |
|
2008 |
1,428.9 |
1,131.5 |
297.4 |
|
2009 |
1,202.0 |
1,003.9 |
198.2 |
|
2010 |
1,578.4 |
1,393.9 |
184.5 |
|
2011 |
1,899.3 |
1,741.4 |
157.9 |
|
2012 |
2,050.1 |
1,817.3 |
232.8 |
|
2013 |
2,210.7 |
1,949.3 |
261.4 |
|
2014 |
2,343.2 |
1,963.1 |
380.1 |
|
2015 |
2,280.5 |
1,601.8 |
678.8 |
|
2016 |
2,135.3 |
1,524.7 |
610.6 |
|
2017 |
2,279.2 |
1,790.0 |
489.2 |
|
2018 |
2,491.4 |
2,109.0 |
382.4 |
Source: Global Trade Atlas and China's Customs Administration.
|
Figure 17. China's Share of Global Merchandise Exports: 1990-2017 (percentage) |
 |
|
Source: Economist Intelligence Unit. Note: Data for 2017 are estimated. |
China's Major Trading Partners
Table 5 lists official Chinese trade data on its seven largest trading partners in 2018 (based on total trade). These include the 28 countries that make up the European Union (EU28), the United States, the 10 nations that constitute the Association of Southeast Asian Nations (ASEAN), Japan, South Korea, Hong Kong, and Taiwan.41 China's top three export markets were the United States, the EU28, ASEAN,42 while its top sources for imports were the EU28, ASEAN, and South Korea. According to Chinese data, it maintained large trade surpluses with the United States ($282 billion), Hong Kong ($274 billion) and the EU28 ($129 billion), and reported large trade imbalances with Taiwan ($112 billion) and South Korea ($74 billion). China's trade data differ significantly from those of many of its trading partners. These differences appear to be largely caused by how China's trade via Hong Kong is counted in official Chinese trade data. China treats a large share of its exports through Hong Kong as Chinese exports to Hong Kong for statistical purposes, while many countries that import Chinese products through Hong Kong generally attribute their origin to China for statistical purposes, including the United States.43
|
Country |
Total Trade |
Chinese Exports |
Chinese Imports |
China's Trade Balance |
||||
|
European Union |
|
|
|
|
||||
|
United States |
|
|
|
|
||||
|
ASEAN |
|
|
|
|
||||
|
Japan |
|
|
|
|
||||
|
South Korea |
|
|
|
|
||||
|
Hong Kong |
|
|
|
|
||||
|
Taiwan |
|
|
|
|
Source: China's Customs Administration.
Notes: Rankings according to China's total trade in 2018. China's bilateral trade data often differ from that of its trading partners.
Major Chinese Trade Commodities
China's abundance of low-cost labor has made it internationally competitive in many low-cost, labor-intensive manufactures. As a result, manufactured products constitute a significant share of China's trade. A substantial amount of China's imports is comprised of parts and components that are assembled into finished products, such as consumer electronic products and computers, and then exported. Often, the value-added to such products in China by Chinese workers is relatively small compared to the total value of the product when it is shipped abroad.
China's top 10 imports and exports in 2018 are listed in Table 6 and Table 7, respectively, using the harmonized tariff system (HTS) on a two-digit level. Major imports included electrical machinery and equipment;44 mineral fuels; nuclear reactors, boilers, and machinery (such as automatic data process machines and machines to make semiconductors); ores; and optical, photographic, medical, or surgical instruments. China's biggest exports were electrical machinery and equipment; nuclear reactors, boilers, and machinery; furniture; plastics; and vehicles.
|
HS Code |
Description |
$ Billions |
Percentage of |
2018/2017 |
|
|
|
Total Commodities |
2,117 |
100 |
18.3 |
|
|
|
Electrical machinery and equipment |
522 |
24.6 |
14.2 |
|
|
|
Mineral fuel, oil etc. |
348 |
16.4 |
41.5 |
|
|
|
Nuclear reactors, boilers, and machinery |
202 |
9.6 |
18.8 |
|
|
|
Ores, slag, and ash |
135 |
6.4 |
8.3 |
|
|
|
Optical, photographic, cinematographic, measuring |
103 |
4.8 |
5.2 |
|
|
|
Vehicles, except railway, and parts |
81 |
3.9 |
2.9 |
|
|
|
Precious stones and metals |
61 |
2.9 |
328.6 |
|
|
|
Copper and articles thereof |
48 |
2.3 |
15.5 |
|
|
|
Oil seeds, misc. grain, plants, and fruit |
43 |
2.1 |
-2.7 |
|
|
|
Pharmaceutical products |
28 |
1.3 |
10.8 |
Source: World Trade Atlas, using official Chinese statistics.
Note: Top 10 imports in 2018, two-digit level, harmonized tariff system.
|
HS Code |
Description |
$ Billions |
Percentage of |
2017/2016 |
|||
|
|
Total Commodities |
2,489 |
100 |
|
|||
|
|
Electrical machinery |
664 |
26.7 |
|
|||
|
|
Nuclear reactors, boilers, and machinery |
429 |
17.3 |
|
|||
|
|
Furniture and bedding |
96 |
3.9 |
|
|||
|
|
Plastics and articles thereof |
80 |
3.2 |
|
|||
|
|
Vehicles, except railway, and parts |
75 |
3.0 |
|
|||
|
|
Apparel articles and accessories, knit or crochet |
74 |
3.0 |
|
|||
|
|
Apparel articles and accessories, woven |
71 |
2.9 |
|
|||
|
|
Optical, photographic, cinematographic, measuring checking, precision, medical or surgical instruments and apparatus; parts and accessories thereof |
71 |
2.9 |
|
|||
|
|
Articles of iron or steel |
65 |
2.6 |
|
|||
|
|
Organic chemicals |
60 |
2.4 |
|
Source: World Trade Atlas, using official Chinese statistics.
Note: Top 10 exports in 2018, two-digit level, harmonized tariff system.
Major Long-Term Challenges Facing the Chinese Economy
China is currently undergoing a major restructuring of its economic model. Policies that were employed in the past to essentially produce rapid economic growth at any cost were very successful. However, such policies have entailed a number of costs (such as heavy pollution, widening income inequality, overcapacity in many industries, an inefficient financial system, rising corporate debt, and numerous imbalances in the economy) and therefore the old growth model is viewed by many economists as no longer sustainable. China has sought to develop a new growth model ("the new normal") that promotes more sustainable (and less costly) economic growth that puts greater emphasis on private consumption and innovation as the new drivers of the Chinese economy. Implementing a new growth model that sustains healthy economic growth could prove challenging unless China is able to effectively implement new economic reforms. Many analysts warn that without such reforms, China could face a period of stagnant economic growth and living standards, a condition referred to by economists as the "middle-income trap" (Several of these challenges are discussed below.
China's Incomplete Transition to a Market Economy
Despite China's three-decade history of widespread economic reforms, Chinese officials contend that China is a "socialist-market economy." This appears to indicate that the government accepts and allows the use of free market forces in a number of areas to help grow the economy, but the government still plays a major role in the country's economic development.
Industrial Policies and SOEs
According to the World Bank, "China has become one of the world's most active users of industrial policies and administrations."45 China's State Council has said that there are currently 150,000 SOEs at the central and local government level.46 China's SOEs may account for up of 50% of non-agriculture GDP.47 In addition, although the number of SOEs has declined sharply, they continue to dominate a number of sectors (such as petroleum and mining, telecommunications, utilities, transportation, and various industrial sectors); are shielded from competition; are the main sectors encouraged to invest overseas; and dominate the listings on China's stock indexes.48 One study found that SOEs constituted 50% of the 500 largest manufacturing companies in China and 61% of the top 500 service sector enterprises.49 Not only are SOEs dominant players in China's economy, many are quite large by global standards. Fortune's 2016 list of the world's 500 largest companies includes 103 Chinese firms (compared to 29 listed firms in 2007).50 Of the 103 Chinese firms listed, Fortune identified 75 companies (73% of total) where the government owned 50% or more of the company. Together, these 75 firms in 2016 generated $7.2 trillion in revenues, had assets valued at $20.7 trillion, and employed 16.2 million workers. Of the 28 other Chinese firms on the Fortune 500 list, several appear to have financial links to the Chinese government.
|
China and Global Steel Overcapacity China has become a major global producer of steel. From 2001 to 2016, China's production of raw steel rose from 152 million metric tons to 805 million metric tons, an increase of 459.9%. During this period, China's share of global production rose from 17.9% to 50.3% and China accounted for 87.1% of the increase in global steel production.51 While much of China's increased steel capacity has been in response to domestic demand (resulting from China's large-scale fixed investment), it is also a major exporter. In 2015, China was the second-largest exporter of semifinished and steel products (after the EU) at 111.6 million metric tons, or 24.1% of global total. Concerns have been raised over the past few years over the effects of increased global steel production despite falling global steel demand. Following an EU Symposium on Excess Capacity and Structural Adjustment in the Steel Sector in April 2016, then-U.S. Secretary of Commerce Penny Pritzker and then-USTR Michael Froman issued a joint statement that said that the "U.S. steel industry is in a crisis driven in large part by global excess capacity.... led by unsustainable expansion in steelmaking capacity by China," and noted that global steel overcapacity had impacted the U.S. industry through price declines, decreased profitability, and over 13,000 jobs lost.52 Many analysts contend that China's steel industry is heavily supported by government entities at the central and local government level through low-cost credit and subsidies. These enable many Chinese steel firms to operate, even when they are unprofitable and heavily in debt—these are termed by some as "zombies." The government is reluctant to allow such firms to go bankrupt due to concerns over effects layoffs could have on social stability. One study by Renmin University estimated that half of Chinese steel firms were "zombie enterprises."53 In April 2016, the USTR released a list of 86 government subsidies from 2011 to 2014 given to Hebei Iron & Steel Company, one of the largest steel companies in China, which was obtained from the company's annual reports.54 In February 2016, the Chinese government announced plans to shut 100 million to 150 million metric tons of crude steel capacity over the next five years and cut 500,000 jobs.55 The USTR's 2016 report on China's WTO compliance stated that China had committed to "ensure that no central government plans, policies, directives, guidelines, lending or subsidization targets the net expansion of steel capacity," and to take steps to reduce existing capacity, including "actively and appropriately dispose of 'zombie enterprises' through bankruptcies and other means."56 |
A State-Dominated Banking Sector, Excess Credit, and Growing Debt
China's banking system is largely dominated by state-owned or state-controlled banks. According to one analyst, the mangers of China's state banks are drawn from the ranks of the Chinese Communist Party cadre system, which "enables the party and government leaderships to exert influence over bank lending."57 In 2015, the top five largest banks in China in terms of assets were state-owned entities.58 The percentage share of assets held by state-owned commercial banks (including the five large state-owned banks), the three government policy banks,59 and joint-stock commercial banks (where government entities are a major stock holder), together accounted for 68.5% of total bank assets in China.60 Foreign participation in China's banking system is relatively small, accounting for 1.6% of total bank assets.61 SOEs are believed to receive preferential credit treatment by government banks, while private firms must often pay higher interest rates or obtain credit elsewhere. According to one estimate, SOEs accounted for 85% ($1.4 trillion) of all bank loans in 2009.62 It is believed that oftentimes SOEs do not repay their loans, which may have saddled the banks with an ever-increasing amount of nonperforming loans.63 Many analysts contend that one of the biggest weaknesses of the banking system is that it lacks the ability to ration and allocate credit according to market principles, such as risk assessment.
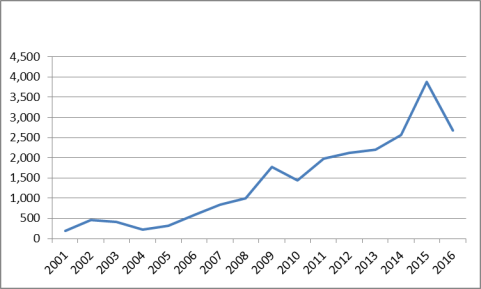
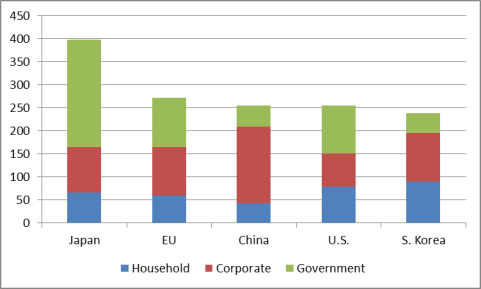
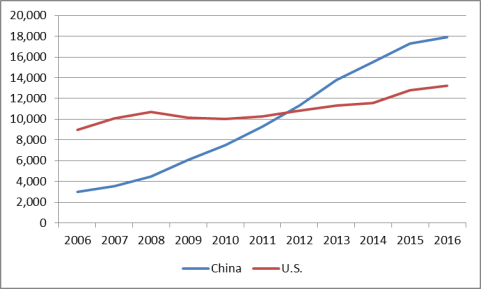
The Chinese central government uses the banking system to boost credit in order to help meet its GDP growth objectives and to, when needed, offset the impact of global economic downturns, such as after the 9/11 terrorist attacks and the global financial crisis. From 2007 to 2016, China's domestic credit increased in dollar terms by 218% (see Figure 18), and as a share of GDP, the level rose from 125% to 212%. As indicated in Figure 19, China's combined household, corporate, and government debt levels as a percentage of GDP as of mid-2016 are comparable to those of the United States and South Korea and lower than those of Japan and the European Union. However, China's debt levels (in both dollars and as a percentage of GDP) have risen sharply within a relatively short time, which, some have speculated, could spark an economic crisis in China in the future. From 2006 year-end to mid-2016, China's total nonfinancial sector debt as a percentage of GDP increased from 143% to 254% (up 111 percentage points). Much of the rise in that debt came from the corporate sector, which, as a percentage of GDP, rose from 107% in 2006 to 171% in mid-2016 (up 64 percentage points). In dollar terms, China's corporate debt rose from $3 trillion to $17.8 trillion (up $14.8 trillion) and currently greatly exceeds U.S. corporate debt levels (see Figure 20). Several observers have warned that China's credit growth may be too extensive and could undermine future growth by sharply boosting debt levels, causing overcapacity in many industrials (especially extending credit to firms that are unprofitable to keep them operating), contributing to bubbles (such as in real estate), and reducing productivity by proving preferential treatment to SOEs and other government-supported entities.
|
Figure 18. Annual Change in the Stock of China's Domestic Credit 2001-2016 ($ billions) |
 |
|
Source: Economist Intelligence Unit. |
|
Figure 19. Core Debt of Nonfinancial Sectors in 2016* as a Percentage of GDP (percentage) |
 |
|
Source: Bank for International Settlements. Note: * As of second quarter 2016. |
|
Figure 20. U.S. and Chinese Corporate Debt: 2006-2016* ($ billions) |
 |
|
Source: Bank for International Settlements. Note: *As of second quarter 2016. |
Local government debt is viewed as a big problem in China, largely because of the potential impact it could have on the Chinese banking system. During the beginning of the global financial slowdown, many Chinese subnational government entities borrowed extensively to help stimulate local economies, especially by supporting infrastructure projects. In December 2013, the Chinese National Audit Office reported that from the end of 2010 to mid-year 2013, local government debt had increased by 67% to nearly $3 trillion.64 The Chinese government reported that local government debt rose to $4.3 trillion as of 2015. Efforts have been made over the past few years by the central government to restructure local government debt and restrict local government borrowing, with mixed success, according to some press reports, because of pressures on local governments to maintain rapid economic growth.65
Many economists blame China's closed capital account for much of China's debt problems. The Chinese government has maintained restrictions on capital inflows and outflows for many years, in part to control the exchange of its currency, the renminbi (RMB), against the dollar and other currencies in order to boost exports. Many argue the Chinese government's restrictions on capital flows have greatly distorted financial markets in China, preventing the most efficient use of capital, such as overinvestment in some sectors (such as real estate) and underinvestment in others (such as services).
Environmental Challenges
China's economic growth model has emphasized the growth of heavy industry in China, much of which is energy-intensive and high polluting. The level of pollution in China continues to worsen, posing serious health risks to the population. The Chinese government often disregards its own environmental laws in order to promote rapid economic growth. China's environmental challenges are illustrated by the following incidents and reports.
- A 2018 report by ExxonMobil estimated that China contributed about 60% of the growth in global CO2 emissions from 2000 to 2016, and that its emissions would surpass the combined CO2 levels of the United States and EU by 2025.66
- A 2017 OECD report estimated the health costs of China's air pollution in 2015 at $1.4 trillion, equivalent to 7.8% of its GDP.67
- A 2015 study by the Rand Corporation estimated that the costs (in terms of health impact and lost productivity) from China's air pollution were equal to 6.5% of GDP each year from 2000 to 2010. It further estimated the costs as a percentage of GDP of water pollution and soil degradation at an additional 2.1% and 1.1%, respectively.68
- On August 12, 2015, a series of large explosions in several warehouses containing chemicals occurred in the Chinese port city of Tianjin, claiming the lives of at least 163 people. Some press reports have blamed poor government enforcement of environmental regulations for the disaster. For example, some in China have questioned why dangerous chemicals were warehoused so close to residential areas and have raised concerns over the extent of chemical contamination in the area that may have resulted from the explosions.
- The U.S. Embassy in Beijing, which monitors and reports air quality in China based on an air quality index of particulate matter (developed by the U.S. Environmental Protection Agency) considered to pose a health concern, reported that the air quality in Beijing for a majority of the days in January 2013 ranged from "unhealthy" to "hazardous" (based on 24-hour exposure) and, on a few days, it recorded high readings that were "beyond index."69 The level of poor air quality in Beijing was termed by some in China as "Airpocalypse," and reportedly forced the government to shut down some factories and reduce the level of official cars on the road.70 On December 9, 2013, China's media reported that half of China was blanketed by smog.71 The U.S. Consulate General in Shanghai reported that were a number of days in December 2013 where its measurement of the air quality in Shanghai was hazardous or very unhealthy, and during some time periods on December 5, 2013, its readings were "beyond index." According to the U.S. Embassy in Beijing, from 2008 to 2015, nearly two-thirds of the days in Beijing had air pollution considered to be unhealthy.72
- In February 2013, China's Geological Survey reportedly estimated that 90% of all Chinese cities had polluted groundwater, with two-thirds having "severely polluted" water.73
- According to a 2012 report by the Asian Development Bank, less than 1% of the 500 largest cities in China meet the air quality standards recommended by the World Health Organization, and 7 of these are ranked among the 10 most polluted cities in the world.74
The Chinese government has indicated that it is taking steps to reduce energy consumption, boost enforcement of environmental laws and regulations, reduce coal usage by expanding the use of cleaner fuels (such as natural gas) to general power, and relocate high-polluting factories away from large urban areas, although such efforts have had mixed results on the overall level of pollution in China.75 In addition, China has become a major global producer and user of clean and renewable energy technology. In January 2017, the Chinese government said it would spend $361 billion on renewable energy power generation by 2020.76
Corruption and the Relative Lack of the Rule of Law
The relative lack of the rule of law in China has led to widespread government corruption, financial speculation, and misallocation of investment funds. In many cases, government "connections," not market forces, are the main determinant of successful firms in China. Many U.S. firms find it difficult to do business in China because rules and regulations are generally not consistent or transparent, contracts are not easily enforced, and intellectual property rights are not protected (due to the lack of an independent judicial system). The relative lack of the rule of law and widespread government corruption in China limit competition and undermine the efficient allocation of goods and services in the economy. A New York Times article reported that (former) Chinese Premier Wen Jiabao's family controlled assets worth at least $2.7 billion.77 One study estimates that between 2001 and 2010, China was the world's largest source of illicit capital outflows at $3.8 trillion.78 A 2012 survey by the Pew Research Center's Global Attitudes Project reported that 50% of respondents said that corrupt officials are a very big problem (up from 39% in 2008).79 Chinese officials often identify government corruption as the greatest threat to the Chinese Communist Party and the state. The Chinese government's anticorruption watchdog reported that 106,000 officials were found guilty of corruption in 2009.80 Since assuming power in 2012, Chinese Xi Jinping has carried out an extensive anticorruption drive. China has reportedly sought cooperation with the United States to obtain extradition of 150 alleged corrupt officials who have fled to the United States.81 However, many analysts contend that government anticorruption campaigns are mainly used to settle political scores with out-of-favor officials. Some analysts contend that President's Xi anticorruption drive is more about consolidating his own political than instituting reforms.82 In addition, there are some indicators that the current anticorruption campaign may be having a negative impact on the Chinese economy, due to hesitancy by some local officials to pursue projects they feel will lead to scrutiny from the central government.83 Many observers argue that meaningful progress against government corruption cannot occur without greater government transparency, a system of checks and balances, a free press, Internet freedom, and an independent judiciary.84 In October 2014, China held its fourth Plenum of the 18th Party Conference. The meeting focused on the need to enhance the rule of law in China, but emphasized the leading role of the Communist Party in the legal system.85
China maintains a weak and relatively decentralized government structure to regulate economic activity in China. Laws and regulations often go unenforced or are ignored by local government officials. As a result, many firms cut corners in order to maximize profits. This has led to a proliferation of unsafe food and consumer products being sold in China or exported abroad. Lack of government enforcement of food safety laws led to a massive recall of melamine-tainted infant milk formula that reportedly killed at least four children and sickened 53,000 others in 2008. Transparency International's Corruption Perception Index for 2016 ranked China 79th out of 176 countries and territories, up from 72nd in 2007.86
Demographic Challenges
Many economists contend that China's demographic policies, particularly its one-child policy (first implemented in 1979), are beginning to have a significant impact on the Chinese economy. For example, according to a McKinsey Global Institute study, China's fertility rate fell from about 5.8 births per woman in 1964 to 1.6 in 2012.87 This is now affecting the size of the Chinese workforce.
The existence of a large and underemployed labor force was a significant factor in China's rapid economic growth when economic reforms were first introduced. Such a large labor force meant that firms in China had access to a nearly endless supply of low-cost labor, which helped enable many firms to become more profitable, which in turn led them to boost investment and production. Some economists contend that China is beginning to lose this labor advantage. According to the Chinese government, the size of its working age population (ages 16 to 59) peaked at 925 million in 2011, but then fell for seven consecutive years to 897 million in 2018. The Chinese government projects that its working age population will drop to 830 million by 2030 and to 700 million by 2050. If these projections prove accurate, the Chines working age population could drop by 225 million individuals (2011-2050).88
The one-child policy has also resulted in a rapidly aging society in China.89 According to the Brookings Institute, China already has 180 million people aged over 60, and this could reach 240 million by 2020 and 360 million by 2030. The population share of people aged over 60 could reach 20% by 2020, and 27% by 2030.90 With a declining working population and a rising elderly population, the Chinese government will face challenges trying to boost worker productivity (such as enhancing innovation and high-end technology development) and expanding spending on health care and elderly services. China's Hukou (household registration) system also poses challenges to the government.
|
China's Hukou System91 First introduced in 1951, the Chinese Hukou (household registration) system is a categorization of its citizens based on both their place of residence and eligibility for certain socioeconomic benefits. Hukou is issued through a registration process administered by local authorities and solidified into inheritable social identities.92 The classification of the system is composed by two related parts: socioeconomic eligibility (agriculture/nonagriculture); and residential location (living in urban/rural areas). The Chinese government imposed the system with the purpose of regulating population distribution, especially in regard to cities. Since economic reforms were begun in 1979, hundreds of millions of people have been allowed to leave their home towns to work in urban areas, such as Shanghai. The number of rural laborers working in China's cities was 274 million in 2014, over one-third (36%) of the total workforce.93 Although such workers are allowed to reside in the cities where they work, they are generally denied access to social entitlements, such as pensions, medical insurance, and basic education for children. This forces such workers to save a very high level of their income to pay for these services. Due to China's desire to increase the urbanization of its population, combat demographic disparities, and boost domestic consumption, the Chinese government is currently considering implementing new reforms to the Hukou system. |
Economic Goals of the 19th Party Congress of the Communist Party
President Xi's report to the 19th Party Congress in November 2017 stated that socialism with Chinese characteristics had entered a new era. He stated that China would work to become a "moderately prosperous society in all respects" by 2050. Major goals include boosting living standards for poor and rural people, addressing income disparities (e.g., rich-poor and urban-rural), making private consumption the driver of the economy, boosting services, reducing pollution, promoting innovation and economic modernization, and improving overall living standards.94 For example, the report states the following:
We will work faster to build China into a manufacturer of quality and develop advanced manufacturing, promote further integration of the internet, big data, and artificial intelligence with the real economy, and foster new growth areas and drivers of growth in medium-high end consumption, innovation-driven development, the green and low-carbon economy, the sharing economy, modern supply chains, and human capital services. We will support traditional industries in upgrading themselves and accelerate development of modern service industries to elevate them to international standards. We will move Chinese industries up to the medium-high end of the global value chain, and foster a number of world-class advanced manufacturing clusters.
The report indicated that China would continue to pursue trade and investment reforms, noting the following:
We will adopt policies to promote high-standard liberalization and facilitation of trade and investment; we will implement the system of pre-establishment national treatment plus a negative list across the board, significantly ease market access, further open the service sector, and protect the legitimate rights and interests of foreign investors. All businesses registered in China will be treated equally.
However, the report emphasized the continued importance of the state sector and the government's continued role in various economic sectors:
We will improve the systems for managing different types of state assets, and reform the system of authorized operation of state capital. In the state-owned sector, we will step up improved distribution, structural adjustment, and strategic reorganization. We will work to see that state assets maintain and increase their value; we will support state capital in becoming stronger, doing better, and growing bigger, and take effective measures to prevent the loss of state assets. We will further reform of state-owned enterprises, develop mixed-ownership economic entities, and turn Chinese enterprises into world-class, globally competitive firms.95
China's Belt and Road Initiative
China's Belt and Road initiative (BRI), also called "One Belt, One Road" (OBOR), was launched in 2013 to boost economic integration and connectivity (such as infrastructure, trade, and investment) with its neighbors and various trading partners in Asia, Africa, Europe, and beyond.96 At the APEC summit in November 2017, President Xi said the following:
The Belt and Road Initiative calls for joint contribution and it has a clear focus, which is to promote infrastructure construction and connectivity, strengthen coordination on economic policies, enhance complementarity of development strategies and boost interconnected development to achieve common prosperity. This initiative is from China, but it belongs to the world. It is rooted in history, but it is oriented toward the future. It focuses on the Asian, European and African continents, but it is open to all partners. I am confident that the launch of the Belt and Road Initiative will create a broader and more dynamic platform for Asia-Pacific cooperation.97
Many U.S. analysts view the BRI differently than how Chinese leaders describe it. For example, Nadège Rolland, senior fellow with the National Bureau of Asian Research states the following:
The Belt and Road Initiative (BRI) is generally understood as China's plan to finance and build infrastructure projects across Eurasia. Infrastructure development is in fact only one of BRI's five components which include strengthened regional political cooperation, unimpeded trade, financial integration and people-to-people exchanges. Taken together, BRI's different components serve Beijing's vision for regional integration under its helm. It is a top-level design for which the central government has mobilized the country's political, diplomatic, intellectual, economic and financial resources. It is mainly conceived as a response to the most pressing internal and external economic and strategic challenges faced by China, and as an instrument at the service of the PRC's vision for itself as the uncontested leading power in the region in the coming decades. As such, it is a grand strategy.98
Many aspects of the BRI initiative remain unclear, including which (and how many) countries will participate, how much China will spend to finance the initiative, and what projects will fall under the BRI. For example, the government's China Belt and Road Portal currently lists profiles of 70 countries on its website.99 However, China's official media in December 2017 stated that 86 countries and international organizations had signed 100 cooperation agreements with China under the BRI.100 Nadège Rolland said that China pledged it would spend $1 trillion to $1.3 trillion, The Economist reports that China put the figure at $4 trillion,101 and the World Economic Forum estimates that China could ultimately spend $8 trillion on BRI.102
The initiative could provide a big boost to China's economy and soft power image. China hopes to gain a better return on its foreign exchange reserves, create new overseas business opportunities for Chinese firms, create new markets for industries currently experiencing overcapacity, and stimulate economic development in poorer regions of China.103 However, the initiative could pose financial risks if borrowers do not repay loans or if recipient countries do not view Belt and Road as benefiting them. U.S. Secretary of State Rex Tillerson criticized certain aspects of Belt and Road initiative in remarks made in October 2017:
We have watched the activities and actions of others in the region, in particular China, and the financing mechanisms it brings to many of these countries which result in saddling them with enormous levels of debt. They don't often create the jobs, which infrastructure projects should be tremendous job creators in these economies, but too often, foreign workers are brought in to execute these infrastructure projects. Financing is structured in a way that makes it very difficult for them to obtain future financing, and oftentimes has very subtle triggers in the financing that results in financing default and the conversion of debt to equity.104
China has undertaken other major financial initiatives as well. In July 2014, China, along with Brazil, Russia, India, and South Africa, announced the creation of a $100 billion "New Development Bank," which is headquartered in Shanghai, China. The new bank aims to fund infrastructure projects in developing countries. In October 2014, China launched the creation of a new $100 billion Asian Infrastructure Development Bank (AIIB), aimed at funding infrastructure projects in Asia.105 Fifty-seven nations joined as founding members. The AIIB, headquartered in Beijing, announced it was open for business in January 2016. To date, the United States has chosen not to join the AIIB.
Made in China 2025
The "Made in China 2025" initiative, announced in 2015, is one of several recently announced ambitious projects aimed at increasing the competitiveness of Chinese industries, fostering Chinese brands, boosting innovation, and reducing China's reliance on foreign technology by making China a major or dominant global manufacturer of various technologies.106 According to Chinese media, the initiative intends to "transform China from a manufacturing giant into a world manufacturing power" by 2049.107 For example, the plan states a goal of achieving 40% of domestically manufactured basic components and basic materials by 2020 and 70% by 2025. An updated version of the plan released in January 2018 said China aimed to become the world's leading manufacturer of telecommunication, railway, and electrical power equipment by 2025, and that China's robotics, high-end automation, and new energy vehicles industries would globally rank second or third by 2025.108 The methods the Chinese government plans to use to achieve its goals have raised concerns among U.S. firms and policymakers because they appear to involve large subsidies, protection of domestic industries, directed policies to purchase technology and IPR from abroad, increased pressure on foreign firms to transfer technology in order to do business in China, and what appears to be a goal of deliberately reducing foreign participation in China's markets.
In an interview on November 3, 2017, U.S. Trade Representative Robert Lighthizer stated that China's Made in China 2025 initiative was "a very, very serious challenge, not just to us, but to Europe, Japan and the global trading system."109 The USTR's 2017 annual report on China's WTO compliance focused heavily on the initiative, stating that Made in China 2025 differed from industry support by other WTO members in the level of ambition and scale of resources dedicated to obtaining its goals, and the USTR report warned that "even if the Chinese government fails to achieve the industrial policy goals set forth in Made in China 2025, it is still likely to create or exacerbate market distortions and create severe excess capacity in many of the targeted industries."110
Challenges to U.S. Policy of China's Economic Rise
China's rapid economic growth and emergence as a major economic power have given China's leadership increased confidence in its economic model. Many believe the key challenges for the United States are to convince China that (1) it has a stake in maintaining the international trading system, which is largely responsible for its economic rise, and should take a more active leadership role in maintaining that system; and (2) further economic and trade reforms are the surest way for China to grow and modernize its economy. Lowering trade and investment barriers would boost competition in China, lower costs for consumers, increase economic efficiency, and spur innovation. However, many U.S. stakeholders are concerned that China's efforts to boost the development of indigenous innovation and technology could result in greater intervention by the state (such as subsidies, trade and investment barriers, and discriminatory policies), which could negatively affect U.S. IP-intensive firms.
Opinions differ as to the most effective way to deal with China on major economic issues. Some support a policy of engagement with China using various forums. Others support a somewhat mixed policy of using engagement when possible, coupled with a more aggressive use of the WTO dispute settlement procedures to address China's unfair trade policies.111 Others, who see China as a growing threat to the U.S. economy and the global trading system, advocate a policy of trying to contain China's economic power and using punitive measures, such as increased tariffs under Section 301, to either counter the negative impact of China's industrial policies on U.S. firms or push China to modify distortive and discriminatory policies (such as the Made in China 2025 initiative). Responding to China's BRI is viewed by some as a major challenge to U.S. global economic interests. While China's financial support of infrastructure projects in numerous countries could produce positive economic results, U.S. policymakers have expressed concerns that China will use BRI to mainly benefit its own firms, that the process of implementation of projects will not be transparent, that BRI participation could saddle countries with large debts, and that China will use the BRI to spread its economic system to other countries.