Introduction
Enacted in 1937, the Federal Aid in Wildlife Restoration Act, now known as the Pittman-Robertson Wildlife Restoration Act (hereinafter referred to as Pittman-Robertson),1 provides funding for states and territories to support projects that promote the conservation and restoration of wild birds and mammals and their habitats and programs that provide hunter education and safety training and opportunities.2
The U.S. Fish and Wildlife Service (FWS), an agency within the Department of the Interior, administers Pittman-Robertson as part of its Wildlife and Sport Fish Restoration program. Revenues generated through excise taxes on pistols and revolvers, other firearms, ammunition, bows, and other archery equipment provide the funding for Pittman-Robertson.3 After collection, receipts from these excise taxes are deposited into the Federal Aid to Wildlife Restoration Fund in the Treasury, and monies from the fund are made available for FWS for Pittman-Robertson activities in the fiscal year following their collection without any further action by Congress.4 For three programs within Pittman-Robertson, FWS apportions the funds directly among the states and territories.5 All 50 states as well as Puerto Rico, Guam, American Samoa, the Commonwealth of the Northern Mariana Islands, and the U.S. Virgin Islands (collectively referred to as territories in this report) are eligible to receive funding through Pittman-Robertson.6 Since its creation, Pittman-Robertson has provided over $18.8 billion (in 2018 dollars; $12.2 billion in nominal dollars) to states and territories.
This report provides an overview of the Pittman-Robertson state and territory programs that support wildlife restoration and hunter education and safety activities, including a breakdown of the various apportionment formulas and an analysis of related issues that may be of interest to Congress. This report focuses on the formula-based programs within Pittman-Robertson that provide funding for states and territories.
Revenues and Apportionments7
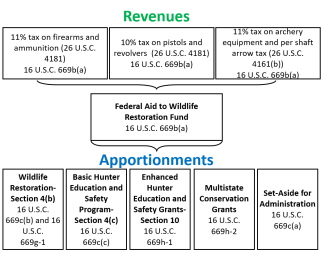
The Pittman-Robertson Wildlife Restoration Act apportions and allocates funding for five distinct purposes:8
- 1. program administration (Section 4(a));9
- 2. Wildlife Restoration (Section 4(b));
- 3. Basic Hunter Education and Safety (Section 4(c));10
- 4. Enhanced Hunter Education and Safety Grants (Section 10); and
- 5. Multistate Conservation Grants (Section 11).11
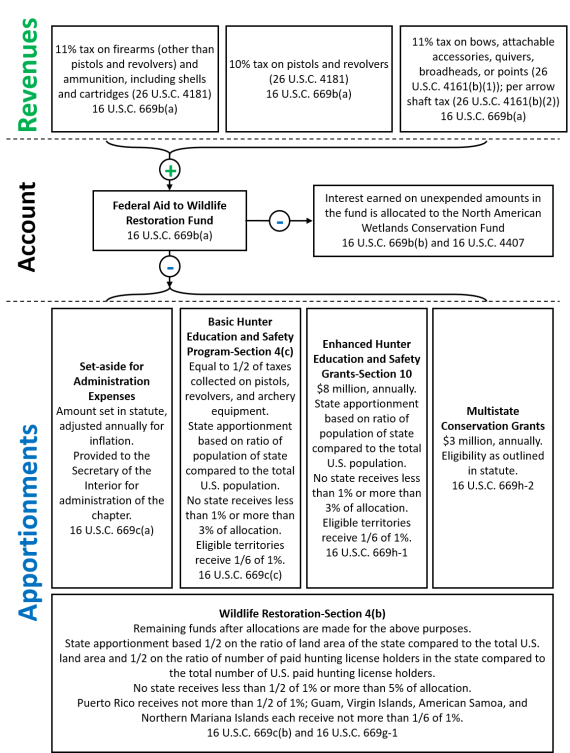
Funds for three of these programs—Wildlife Restoration, Basic Hunter Education and Safety, and Enhanced Hunter Education and Safety Grants—are disbursed directly to states based on two apportionment formulas (both hunter education and safety programs use the same formula). The formulas take into account a state's acreage, number of hunting licenses sold, and population (Figure 1 and Table A-1). Territories are apportioned a set percentage of the funds for each program. Washington, DC, does not receive funding under these programs. States and territories can use their apportionments to support the federal share of wildlife and hunter and safety projects that receive Pittman-Robertson funding.12 Additionally, Pittman-Robertson provides for FWS to allocate nonformula based funding for multistate conservation grants and program administration.13
|
Figure 1. Pittman-Robertson Wildlife Restoration Act Revenue and Apportionment Structure
|
 |
|
Source: Congressional Research Service (CRS), with information from 16 U.S.C. §§669 et seq.
|
Revenues
Funding for programs authorized in Pittman-Robertson comes from excise taxes on certain firearms, ammunition, and archery equipment.14 Taxes on these items are imposed on the manufacturer, producer, or importer of these goods. However, these taxes may result in higher prices for the purchaser if part or all of the cost is passed on in the final purchase price. The tax rates are 10% for pistols and revolvers, 11% for other firearms and ammunition, 11% for bows and archery equipment, and a per shaft tax for arrows that is adjusted annually for inflation.15 Receipts from these excise taxes are deposited into the Federal Aid to Wildlife Restoration Fund in the Treasury, and monies from the fund are made available for FWS in the fiscal year following their collection without any further action by Congress.
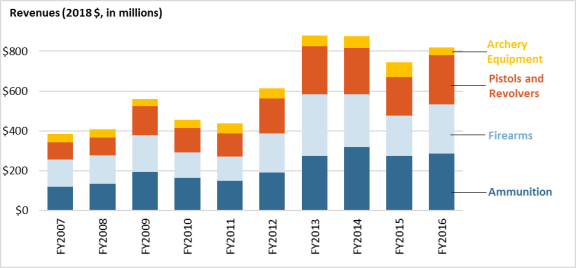
Revenues generated from these excise taxes vary year by year both in total revenue (Figure 2) and in revenue attributable to a specific item group (Table 1). From FY2007 through FY2016,16 FWS reported a total of $6.2 billion (in 2018 dollars) of revenue. Ammunition accounted for $2.1 billion (34%), firearms for $1.9 billion (32%), pistols and revolvers for $1.7 billion (27%), and archery equipment for $0.5 billion (8%) of the total (in 2018 dollars). The revenues attributable to ½ the revenues generated from excise taxes on pistols, revolvers, and archery equipment accounted for 17% of the total revenue.17 These revenues determined the amount available for apportionments through the Basic Hunter Education and Safety program for the years from FY2008 through FY2017 (the years following excise tax collection). The remaining revenues, 83% for FY2007 through FY20016, provide funds for the Wildlife Restoration and Enhanced Hunter Education and Safety programs as well as the Multistate Conservation Grant program and the set-aside for administration.
While the overall revenues generated determines the total amount available for apportionment in the year following collection, the amount available for Basic Hunter Education and Safety program (Section 4(c)) is solely based on revenues generated from pistols, revolvers, and archery equipment. As such, amounts available for apportionment and disbursement are program specific and fluctuate based on the total volume of shooting and archery equipment and the type of goods.
|
Figure 2. Pittman-Robertson Revenues from Ammunition, Firearms, Pistols and Revolvers, and Archery Equipment, FY2007-FY2016
|
 |
|
Source: CRS, data from U.S. Fish and Wildlife Service, Wildlife and Sport Fish Restoration Program, Wildlife Restoration Excise Tax Receipts, at https://wsfrprograms.fws.gov/Subpages/GrantPrograms/WR/WR_ExciseTax.html.
Note: Nominal dollars have been converted to constant 2018 dollars using the GDP (Chained) Price Index column in Table 10.1 (Gross Domestic Product and Deflators Used in the Historical Tables: 1940-2023) from the Office of Management and Budget, Historical Tables, at https://www.whitehouse.gov/omb/historical-tables/.
|
Table 1. Percentage of Revenues Attributable to Ammunition, Firearms, Pistols and Revolvers, and Archery Equipment, FY2007-FY2016
|
Year
|
Ammunition
|
Firearms
|
Pistols and Revolvers
|
Archery Equipment
|
|
FY2007
|
30.5%
|
36.1%
|
22.9%
|
10.5%
|
|
FY2008
|
32.9%
|
34.5%
|
22.0%
|
10.5%
|
|
FY2009
|
34.2%
|
33.4%
|
25.8%
|
6.6%
|
|
FY2010
|
35.7%
|
28.4%
|
26.8%
|
9.1%
|
|
FY2011
|
33.8%
|
28.5%
|
26.4%
|
11.3%
|
|
FY2012
|
31.0%
|
32.2%
|
28.8%
|
8.0%
|
|
FY2013
|
31.0%
|
35.2%
|
27.5%
|
6.3%
|
|
FY2014
|
36.3%
|
30.4%
|
26.6%
|
6.7%
|
|
FY2015
|
36.6%
|
27.4%
|
26.0%
|
9.9%
|
|
FY2016
|
34.7%
|
30.3%
|
30.1%
|
4.8%
|
State and Territory Apportionment
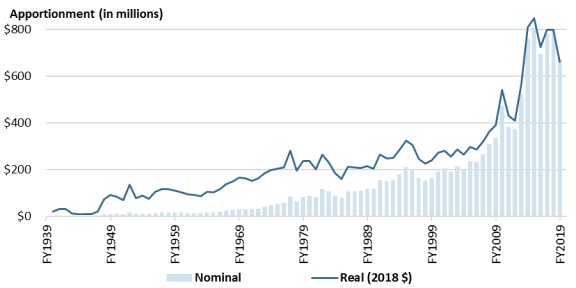
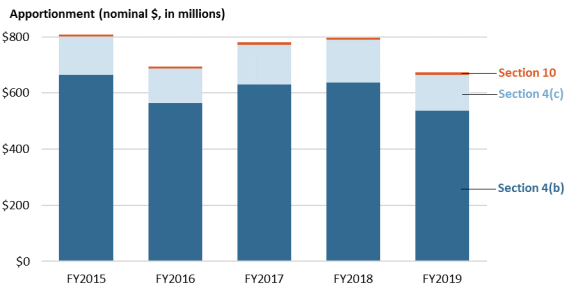
Between FY1939 and FY2019, FWS disbursed $18.8 billion (in constant 2018 dollars; $12.2 billion in nominal dollars) for wildlife restoration and hunter education and safety activities to states and territories (Figure 3).18 Annual apportionments have increased over time. However, in recent years, there have been fluctuations of over $100 million between years. FWS disbursed $3.8 billion (in nominal dollars)—an average of $751 million per year—to states and territories for the Wildlife Restoration and the two Hunter Education and safety programs for FY2015 through FY2019 (Figure 3). Each year, individual states received between $4.5 million and $34.7 million, on average, in total apportionments for FY2015 through FY2019. American Samoa, Guam, the Commonwealth of Northern Mariana Islands, and the Virgin Islands each received $1.3 million per year, on average, and Puerto Rico received $3.3 million per year, on average.19 Table B-1 provides the annual total apportionment for each state and territory for FY2015 through FY2019.
|
Figure 3. Pittman-Robertson Wildlife Restoration Act Total Apportionments, FY1939-FY2019 (top), and Apportionments by Program, FY2015-FY2019 (bottom)
|
 |
|
|
 |
|
Source: CRS, data from U.S. Fish and Wildlife Service, Wildlife and Sport Fish Restoration Program, 1939 through 2019 WR Apportionments (includes Hunter Ed), at https://wsfrprograms.fws.gov/Subpages/GrantPrograms/WR/WRApportionmentsHE-1939-2019.xlsx.
Notes: Apportionments include total funding for Wildlife Restoration and Basic and Enhanced Hunter Education and Safety programs. Totals do not include funding for program administration or multistate conservation grants. Section 4(b) is also known as Wildlife Restoration, Section 4(c) is also known as Basic Hunter Education and Safety, and Section 10 is also known as Enhanced Hunter Education and Safety Grants. In the top figure, nominal dollars have been converted to constant 2018 dollars using the GDP (Chained) Price Index column in Table 10.1 (Gross Domestic Product and Deflators Used in the Historical Tables: 1940-2023) from the Office of Management and Budget, Historical Tables, at https://www.whitehouse.gov/omb/historical-tables/.
|
Wildlife Restoration Program
The Wildlife Restoration program, also known as Section 4(b), comprises the largest funding stream within Pittman-Robertson. From FY2015 through FY2019, annual state and territory apportionments for the Wildlife Restoration Program averaged $606 million (81% of the $751 million, on average, disbursed directly to states and territories under Pittman-Robertson; see Figure 3 and Table B-2). The total amount of funding available for the Wildlife Restoration program for states is determined by deducting the amounts available for administration, the Basic and Enhanced Hunter Education and Safety programs (Sections 4(c) and 10, respectively), multistate conservation grants, and territorial allocations for wildlife restoration activities from the total amount of revenues generated from the excise taxes on pistols, revolvers, firearms, ammunition, and archery equipment in the previous year. States and territories may use this funding to pay the federal share of wildlife restoration projects.20 States and territories may use their apportionments to pay for up to 75% of the total project cost; they are responsible for the remaining cost of the project using non-Pittman-Robertson funds.21 Wildlife Restoration program funds are available for use by the states and territories for the fiscal year in which they are apportioned and the following fiscal year.22
FWS calculates the Wildlife Restoration apportionment for each state using a two-part formula, with each part determining half of the amount apportioned.23 The formula is based on
- the ratio of the area of a state compared with the total area of all 50 states and
- the number of paid hunting licenses sold in a state compared with the total number of paid hunting licenses sold in all 50 states.
The area of and number of licenses sold in the territories and Washington, DC, are not included in the totals for all 50 states.
However, the minimum and maximum amount any state may receive is 0.5% and 5%, respectively. Territorial apportionments are not formula based. Rather, the caps for territorial apportionments for wildlife restoration activities are set in statute: Puerto Rico receives not more than one-half of 1% (0.5%), and Guam, the U.S. Virgin Islands, American Samoa, and the Commonwealth of the Northern Mariana Islands each receive not more than one-sixth of 1% (0.17%) of the total funds apportioned.24 Collectively, territories can receive slightly more than 1% of the allocated funding.
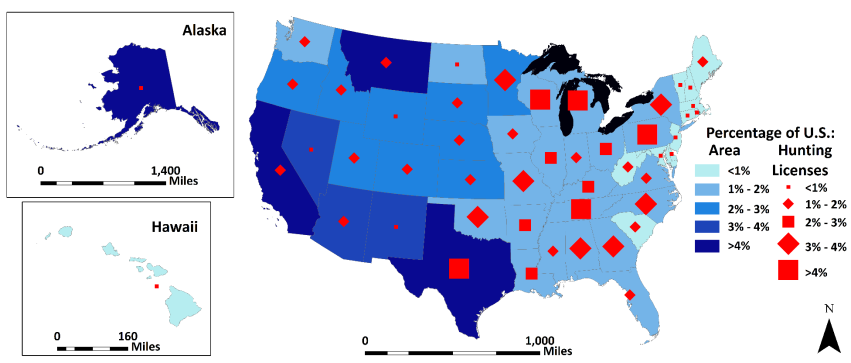
FWS calculates state area as the sum of land and inland water areas in a state.25 State area does not include coastal, Great Lakes, or territorial waters. The area within an individual state is compared to the total area in all 50 states (territorial area is not counted in the total). In total, the United States contains 3.6 million square miles of land and inland water areas. States' areas vary from 0.03% (Rhode Island) to over 16% (Alaska) of the total U.S. area (Figure 4).26 States' areas do not change on an annual basis, though they may be updated periodically.27
The number of paid hunting-license holders used for the calculation in a given apportionment year (also known as calculation year) is "the number of paid hunting-license holders in each State in the second fiscal year preceding the fiscal year for which such apportionment is made."28 The act does not distinguish between in-state and out-of-state hunters; a hunting license purchased by a nonresident would be equivalent under this formula to one purchased by a resident.29 For calculation years 2015 to 2019, states collectively sold 15.4 million licenses per year, on average, in the United States.30 During these five years, Rhode Island sold the fewest licenses per year (8,404, on average) and Texas sold the most (1.1 million per year, on average) (Figure 4). Unlike area, the number of hunting licenses sold varies from year to year (Table A-2). This annual variation influences the apportionment level and can result in states receiving more or less in a given year (subject to minimum and maximum requirements; Table 2).
Table 2. Distribution of the Number of States Receiving Wildlife Restoration Apportionment Percentages, FY2007-FY2019
|
Year
|
<1%
|
1%-2%
|
2%-3%
|
3%-4%
|
>4%
|
|
FY2007
|
9
|
21
|
11
|
7
|
2
|
|
FY2008
|
9
|
20
|
12
|
7
|
2
|
|
FY2009
|
9
|
20
|
13
|
6
|
2
|
|
FY2010
|
9
|
20
|
13
|
6
|
2
|
|
FY2011
|
9
|
20
|
13
|
6
|
2
|
|
FY2012
|
9
|
20
|
13
|
6
|
2
|
|
FY2013
|
9
|
17
|
16
|
6
|
2
|
|
FY2014
|
9
|
18
|
15
|
6
|
2
|
|
FY2015
|
9
|
20
|
13
|
6
|
2
|
|
FY2016
|
9
|
20
|
13
|
6
|
2
|
|
FY2017
|
9
|
19
|
14
|
6
|
2
|
|
FY2018
|
9
|
19
|
14
|
6
|
2
|
|
FY2019
|
9
|
19
|
16
|
4
|
2
|
From FY2015 through FY2019, 8 states each received the minimum of 0.5% of the apportionments for the Wildlife Restoration program ($3.0 million per year, on average), 40 states received between the minimum and maximum, and 2 states received the maximum of 5% ($30.3 million). All 8 states receiving the minimum allocation are comparatively small (each consists of less than 0.5% of the total U.S. area) and sold a comparatively small number of hunting licenses in recent years (on average, each sold less than 0.5% of the U.S. total).31 The 2 states—Texas and Alaska—that received the maximum apportionment of 5% are both large (7.4% and 16.3% of the total U.S. area, respectively) but differed significantly in license sales in recent years (on average 7.4% and 0.7%, respectively).32
|
Figure 4. Percentage Area and Average Annual Number of Hunting Licenses (Calculation Years 2015-2019), by State
|
 |
|
Source: CRS, with data from email from FWS Division of Congressional and Legislative Affairs to CRS, March 26, 2019, and U.S. Fish and Wildlife Service, Wildlife and Sport Fish Restoration Program, National Hunting License Data, at https://wsfrprograms.fws.gov/Subpages/LicenseInfo/Hunting.htm.
Note: The state area percentage was calculated by dividing the sum of land area and inland water area for each state by the total land and inland water area in all 50 states (total does not include territories or Washington, DC). The hunting licenses percentage was calculated by dividing the number of "Paid Hunting License Holders" for each state for calculation years 2015 through 2019 by the total number of all "Paid Hunting License Holders" for all 50 states (total does not include territories or Washington, DC). License data used to calculate apportionment for a given fiscal year ("calculation year") are the number of licenses sold in the second fiscal year preceding the apportionment year (16 U.S.C. §669c(b)). As such, license sales data used to calculate apportionments for 2015-2019 are from 2013-2017. An average is presented for context as the annual number of licenses sold can vary from year to year; apportionments are determined based on a single year's license sales. The apportionments for territories (not shown) are not determined based on the percentage of area or hunting licenses. Instead, Puerto Rico receives not more than one-half of 1% (0.5%), and Guam, the U.S. Virgin Islands, American Samoa, and the Commonwealth of the Northern Mariana Islands each receive not more than one-sixth of 1% (approximately 0.17%) of the total funds apportioned.
|
Hunter Education and Safety Programs
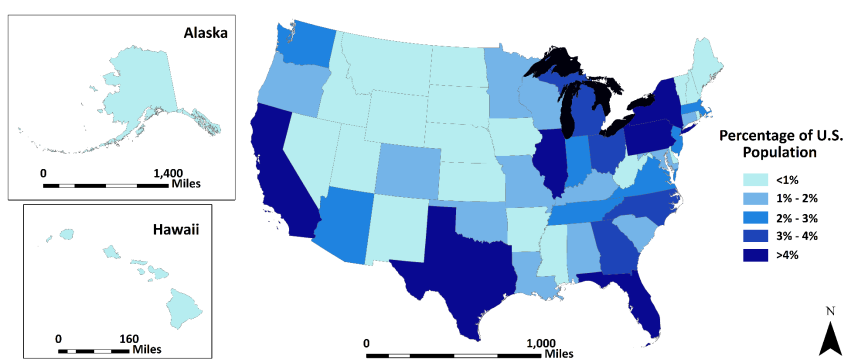
Two programs within Pittman-Robertson provide support to states and territories for hunter education and safety projects: Basic Hunter Education and Safety (Section 4(c)) and Enhanced Hunter Education and Safety Grants (Section 10). The amount of funding available for state and territorial apportionments for the Basic Hunter Education and Safety program fluctuates based on annual revenues deposited in the Federal Aid to Wildlife Restoration Fund from excise taxes on pistols, revolvers, and archery equipment (Figure 1). The Enhanced Hunter Education and Safety Grants program receives a statutorily fixed amount of $8 million per year.33 Both programs use the same apportionment structure, premised on the ratio of a state's population to the total population of the United States, as reported in the most recent decennial census. Statute dictates a minimum (1%) and maximum (3%) state apportionment cap for both programs. Each of the five eligible territories receives one-sixth of 1% (0.17%) of the total amount available for each program. States and territories may use their apportionments to pay for up to 75% of the total cost of a project.34
Based on the 2010 decennial census,35 21 states each contain less than 1% of the U.S. population. Of the 29 remaining, 12 contain between 1% and 2%, 7 between 2% and 3%, 4 between 3% and 4%, and 6 more than 4%. The most populous state, California, contains 12.1% of the total U.S. population. Figure 5 shows the percentage of the population for each state compared with the total for all 50 states calculated from the 2010 U.S. decennial census.
Because apportionments are determined based on the decennial census, which only changes when a new decennial census is conducted, the percentage of apportionment each state receives is constant in the years between decennial censuses, though the actual apportionment will fluctuate based on revenues generated by the excise tax on pistols, revolvers, and archery equipment.36 Based on the 2010 decennial census, 21 states have received the minimum 1%, 3 states have received between 1% and 2%, 9 states between 2% and 3%, and 17 states the 3% cap. The territories have received 0.17% as required in statute.
|
Figure 5. Percentage Population in United States by State Based on 2010 Decennial Census
|
 |
|
Source: CRS with data from U.S. Census Bureau, Population Division, Annual Estimates of the Residential Population: April 1, 2010 to July 1, 2018, at https://factfinder.census.gov/faces/tableservices/jsf/pages/productview.xhtml?pid=PEP_2018_PEPANNRES&src=pt.
Notes: The allocations for territories (not shown) are not based on the percentage of population within a given territory. Instead, Puerto Rico, Guam, the U.S. Virgin Islands, American Samoa, and the Commonwealth of the Northern Mariana Islands each receive one-sixth of 1% (approximately, 0.17%) of the funds apportioned for both basic (Section 4(c)) and enhanced (Section 10) hunter education programs.
|
Basic Hunter Education and Safety Program (Section 4(c))
The total amount of funding available for the Basic Hunter Education and Safety program is equal to the revenue generated by half of the excise taxes collected on pistols, revolvers, and archery equipment but not other firearms and ammunition.37 Apportionments for the Basic Hunter Education and Safety program represent the second-largest component of Pittman-Robertson in terms of funding. Between FY2015 and FY2019, the Basic Hunter Education and Safety program apportioned an average of $136 million per year in total to states and territories (18.2% of the $751 million total average annual apportionments disbursed to states and territories under Pittman-Robertson apportionment programs; see Figure 3 and Table B-3). Between FY2015 and FY2019, the majority of states received either the minimum or the maximum allocation established in statute each year; 21 states received the minimum amount required by law (1%, or $1.4 million per year, on average), and 17 states received the maximum (3%, or $4.1 million per year, on average). Each territory received 0.17% ($227,473 per year, on average), as required by statute. States may use funding under this program to pay the federal share of the "costs of a hunter safety program and the construction, operation, and maintenance of public target ranges, as part of such program."38 Basic Hunter Education and Safety program funds are available for use by states and territories for the fiscal year in which they are apportioned and the following fiscal year.39
Enhanced Hunter Education and Safety Grants Program (Section 10)
Congress passed legislation to add the Enhanced Hunter Education and Safety Grants program (also known as Section 10) to Pittman-Robertson in 2000.40 Since FY2003, $8.0 million has been set aside annually for the program for firearm and bow hunter education and safety grants. Pittman-Robertson states that the allowed uses for these grants are determined based on whether a state or territory has "used all of the funds apportioned to the State under section 669c(c) [Section 4(c)] of this title for the fiscal year."41 If a state or territory has not used all the funds apportioned to it under the Basic Hunter Education and Safety program, it may use monies apportioned under the Enhanced Hunter Education and Safety Grants program for the enhancement of
- hunter education programs, hunter and firearm safety programs, and hunter development programs;
- interstate coordination, hunter education, and shooting range programs;
- bow hunter and archery education, safety, and development; and
- construction and updating of firearm and archery shooting ranges.42
If a state or territory has used all of its Basic Hunter Education and Safety program apportionment, it may use its Enhanced Hunter Education and Safety Grants apportionment for any purpose authorized by Pittman-Robertson.43
FWS annually apportions and disburses funding to states and territories under the Enhanced Hunter Education and Safety Grants program (Figure 3 and Table B-4). For FY2015 to FY2019, each state received between 1% ($80,160 per year, on average) and 3% ($240,480 per year, on average) of the total amount apportioned for these grants. Each eligible territory received 0.17% ($13,360 per year, on average) of the total Enhanced Hunter Education and Safety Grants program apportionments. Because both hunter education programs use the same distribution formula, apportionments for the Enhanced Hunter Education and Safety Grants program follow the same pattern as apportionments for the Basic Hunter Education and Safety program. Unlike the Basic Hunter Education and Safety program, Enhanced Hunter Education and Safety Grant program funds are available for use by states and territories only for the fiscal year in which they are apportioned.44
Issues for Congress
Members of Congress have routinely introduced legislation to amend Pittman-Robertson.45 In particular, Congress has considered issues related to eligible uses of state and territorial apportionments, the funding structure and funding sources for the program, and the apportionment formulas.
Eligible Uses
In recent Congresses, some Members have introduced several bills that would amend the way states and territories are able to spend their apportionments. Some bills have proposed amending Pittman-Robertson to allow additional uses, such as hunter recruitment and retention; others have proposed modifying the federal share and eligible uses of funds for existing or related activities, such as for public target ranges. Some Members introduced multiple bills for both purposes in recent Congresses, including in the 115th and 116th Congresses.
Recruitment, Retention, and Promotion
Several bills in the 115th Congress would have allowed and in the 116th Congress would allow states to use funds provided through Pittman-Robertson to promote hunting and recreational shooting, recruitment and retention of hunters and shooters, and public relations.46 According to the 2016 National Survey of Fishing, Hunting, and Wildlife-Associated Recreation, the number of hunters in the United States declined by 16% (2.2 million individuals) compared to the similar survey in 2011 (from 13.7 million in 2011 to 11.5 million in 2016).47 These bills would allow states to use funds currently provided for the Wildlife Restoration, Basic Hunter Education and Safety, and Enhanced Hunter Education and Safety Grants programs for hunter and recreational shooter recruitment and retention.48 In addition, they would create a funding mechanism for the Secretary of the Interior to use for recruitment and retention purposes at the national level. Currently, Pittman-Robertson prohibits the use of Wildlife Restoration program apportionments for public relations related to wildlife management activities.49 These proposals would remove this prohibition.
Proponents of this type of legislation have argued that these bills would provide states with flexibility to use Pittman-Robertson apportionments to support recruitment efforts that would promote participation in hunting and shooting sports.50 They contend there is a need to attract and retain hunters and recreational shooters, which, in turn, could increase excise tax revenues that support Pittman-Robertson. Stakeholders also point out that wildlife restoration would remain the primary purpose of the act even if amended.51 Other stakeholders have raised the concern that these bills would diminish wildlife restoration activities by allowing states to use funds currently apportioned for wildlife restoration purposes for recruitment and retention.52
Shooting Ranges
Other legislation has been introduced, including in the 115th and 116th Congresses, that would change the terms under which states may use Pittman-Robertson allocations for projects related to the construction and expansion of public target ranges.53 Currently, Pittman-Robertson allows states to use funds apportioned under the Basic Hunter Education and Safety program (Section 4(c)) for the "construction, operation, and maintenance of public target ranges."54 Funds apportioned under the Enhanced Hunter Education and Safety Grants program (Section 10) may be used for "enhancement of construction or development of firearm shooting ranges and archery ranges, and the updating of safety features of firearm shooting ranges and archery ranges."55 However, both programs have a 75% cap for the federal share of projects supported by Pittman-Robertson funding. All of the proposals in the 115th and 116th Congress to amend the eligibility of activities related to shooting ranges would
- allow states and territories to use their Basic Hunter Education and Safety program apportionments for land acquisition, expansion, and construction related to a target range, rather than solely for construction, operation, and maintenance of a range;
- allow states and territories to use up to 10% of funds apportioned to them through the Wildlife Restoration program to supplement apportionments for the Enhanced Hunter Education and Safety Grants program to be used for land acquisition, expansion, and construction related to a target range;56
- allow states and territories to use their apportionments to pay for up to 90% of the total cost of a project related to a shooting range, instead of the current 75% federal cost-share cap; and
- extend the obligation and expenditure window of Enhanced Hunter Education and Safety Grants program apportionments used for shooting ranges to up to five fiscal years from the current window (the fiscal year for which they were apportioned).57
According to their authors, these bills would address a stated decline in the availability of public target ranges and would provide increased opportunity for target practice at public shooting ranges.58 Some proponents have further argued that this type of legislation would allow the use of more funds to provide the public with opportunities to "embrace hunting and shooting sports," which could lead to economic benefits.59 Some proponents also contend that this legislation would make it easier for states to use federal funding, because it would lower the state matching requirement from at least 25% to 10% for target range-related projects and extend the funding window for certain funds. Some stakeholders have raised concerns that this legislation would allow states to use funding for target range-purposes that otherwise would be available for wildlife restoration activities under Section 4(b).60
Funding Sources and Structure
Under current law, the Federal Aid to Wildlife Restoration Fund receives revenues generated through an excise tax on firearms, ammunition, and archery equipment.61 Because Pittman-Robertson funding is entirely reliant on revenues from these taxes, it is subject to spending patterns on these items and can fluctuate with the markets for these goods.62 In addition, although firearm and archery equipment owners, hunters, and recreational shooters generate the funds used by Pittman-Robertson, many stakeholders contend that the act's wildlife restoration benefits accrue to the American public at large (this is often referred to as user-pay, public-benefit). Both the potential for market-based fluctuation of the excise tax structure and the public benefit nature of Pittman-Robertson have led some stakeholders to propose amending the act to include a funding source that they argue is more stable and not solely reliant on hunters and recreational shooters.
Congress has structured revenue sources for Pittman-Robertson so that those who recreate with firearms or bows contribute to funding that is used to maintain and preserve wildlife and hunter safety programs. Upon enactment of the Federal Aid in Wildlife Restoration Act, in 1937, Congress only included revenues generated from excise taxes on firearms (not including pistols and revolvers) and shells and cartridges.63 In debating this act, some Members stated that taxes imposed on sporting arms and ammunition should be used to benefit wildlife restoration.64 In 1970, Congress enacted legislation to deposit revenues from an excise tax on pistols and revolvers into the Federal Aid to Wildlife Restoration Fund rather than into the general fund of the Treasury, into which they were being deposited.65 The purpose of this legislation was to increase revenues available to support wildlife restoration and programs for hunter safety.66 Congress further amended the revenue sources in 1972, providing that an excise tax on bows and arrows, also created in the same law, also be deposited into the Federal Aid to Wildlife Restoration Fund.67 This inclusion provided that archers also contribute to the benefits provided by the act.68
The concept of providing more stable and diversified funds for Pittman-Robertson is not new, and both stakeholders and Congress have addressed this issue on several occasions. For example, some stakeholders have suggested that given the public benefit nature of Pittman-Robertson, an excise tax should be imposed on other categories of goods and services related to outdoor recreation (e.g., backpacks, bicycles, climbing gear, and sport utility vehicles, among other items).69 This proposal—sometimes referred to as a backpack tax—has spurred an ongoing debate for several decades. Proponents have contended that it would be fairer for all users, not just hunters and shooters, to support wildlife conservation and restoration and that broadening the tax base could raise more revenue for restoration.70 Conversely, opponents have suggested that the proposal would place an untenable burden on the outdoor industry, leading to fewer sales and making items prohibitively expensive for some stakeholders, and that it could deter individuals from enjoying the outdoors.71
Congress has not enacted legislation to broaden the excise tax base supporting Pittman-Robertson beyond firearms, ammunition, and archery equipment. However, in FY2001, Congress amended Pittman-Robertson to include an additional subaccount within the Federal Aid to Wildlife Restoration Fund, the Wildlife Restoration and Conservation Account, to provide supplemental funding for wildlife restoration and conservation.72 In the same law that created the subaccount, Congress appropriated $50 million to the subaccount "for the development, revision, and implementation of wildlife conservation and restoration plans and programs."73 Congress appropriated funding to this subaccount only in FY2001.
In recent Congresses, including the 115th Congress, some Members have introduced legislation that would have amended Pittman-Robertson to repurpose the subaccount.74 These bills would have transferred up to $1.3 billion per year into the subaccount from revenues deposited into the Treasury under the Outer Continental Shelf Lands Act and the Mineral Leasing Act.75 These funds would have been available for states and territories for a variety of conservation and restoration activities.
In the 116th Congress, Congress may continue to consider alternate funding sources for Pittman-Robertson through existing or new mechanisms. Proponents have argued that additional funds from alternate sources would bolster restoration and conservation activities and provide a secure source of funding for Pittman-Robertson.76 Some stakeholders also have stated that a bill authorizing such alternate funding sources could provide additional resources for federal agencies or tribal partners to implement the conservation of threatened and endangered species, among other concerns.77 However, Congress may consider if providing funding for conservation and restoration under Pittman-Robertson could affect other potential uses of federal funds.
Apportionment Formulas
In addition to eligible uses and funding sources, Congress may consider amending Pittman-Robertson's apportionment structure. Currently, states and territories are treated differently under the program; states are apportioned funds based on area, population, and number of hunting licenses (see "State and Territory Apportionment" above), whereas territories are allocated funding based on a set percentage or percentage caps. For the Wildlife Restoration program, states receive a minimum of 0.5% of the program's total apportionment, Puerto Rico receives not more than 0.5%, and each of the remaining four eligible territories receives not more than 0.17%.78 For both the Basic and Enhanced Hunter Education and Safety programs, states receive at least 1% of the total apportionments and territories receive 0.17% of the apportionments.79 Under current law, Washington, DC, does not receive funding through any of these programs. However, in FY2001, Washington, DC, received funding through the Wildlife Conservation and Restoration Account.80
Congress may consider issues related to apportionment formulas, including topics related to parity between states, territories, and others. It also may consider amending the apportionment structures, including minimum and maximum allocations, in general. The current structure is the result of multiple congressional actions since the original enactment in 1937. Through these actions, Congress has added and modified apportionment formula and eligibility. Some stakeholders have expressed concern over the discrepancy between the minimum apportionment to states and the set percentage provided to territories; they contend there should be greater parity between states and territories.81 Other stakeholders have suggested that tribes also should be eligible to receive allocations under Pittman-Robertson programs.82
Appendix A.
State Characteristics83
Table A-1. Pittman-Robertson State Program Allocation Formula Criteria
|
|
Wildlife Restoration
|
Hunting Education and Safety
|
|
State
|
Area (sq. miles)a
|
Hunting Licensesb
|
Populationc
|
|
Alabama
|
51,704
|
541,146
|
4,779,736
|
|
Alaska
|
589,945
|
111,157
|
710,231
|
|
Arizona
|
113,990
|
271,139
|
6,392,017
|
|
Arkansas
|
53,179
|
324,664
|
2,915,918
|
|
California
|
158,613
|
282,994
|
37,253,956
|
|
Colorado
|
104,094
|
289,852
|
5,029,196
|
|
Connecticut
|
5,013
|
39,623
|
3,574,097
|
|
Delaware
|
2,040
|
17,633
|
897,934
|
|
Florida
|
58,652
|
185,237
|
18,801,310
|
|
Georgia
|
58,926
|
591,402
|
9,687,653
|
|
Hawaii
|
6,465
|
10,737
|
1,360,301
|
|
Idaho
|
83,569
|
276,134
|
1,567,582
|
|
Illinois
|
56,339
|
312,025
|
12,830,632
|
|
Indiana
|
36,187
|
271,410
|
6,483,802
|
|
Iowa
|
56,273
|
221,861
|
3,046,355
|
|
Kansas
|
82,278
|
246,606
|
2,853,118
|
|
Kentucky
|
40,408
|
349,814
|
4,339,367
|
|
Louisiana
|
47,766
|
389,440
|
4,533,372
|
|
Maine
|
33,156
|
165,196
|
1,328,361
|
|
Maryland
|
10,475
|
123,709
|
5,773,552
|
|
Massachusetts
|
8,285
|
58,066
|
6,547,629
|
|
Michigan
|
58,540
|
728,530
|
9,883,640
|
|
Minnesota
|
84,390
|
572,041
|
5,303,925
|
|
Mississippi
|
47,693
|
282,603
|
2,967,297
|
|
Missouri
|
69,707
|
498,215
|
5,988,927
|
|
Montana
|
147,040
|
238,002
|
989,415
|
|
Nebraska
|
77,348
|
178,768
|
1,826,341
|
|
Nevada
|
110,572
|
67,797
|
2,700,551
|
|
New Hampshire
|
9,280
|
59,135
|
1,316,470
|
|
New Jersey
|
7,790
|
74,425
|
8,791,894
|
|
New Mexico
|
121,590
|
102,828
|
2,059,179
|
|
New York
|
49,115
|
559,358
|
19,378,102
|
|
North Carolina
|
52,670
|
573,514
|
9,535,483
|
|
North Dakota
|
70,698
|
143,491
|
672,591
|
|
Ohio
|
41,335
|
394,076
|
11,536,504
|
|
Oklahoma
|
69,899
|
468,681
|
3,751,351
|
|
Oregon
|
97,056
|
277,230
|
3,831,074
|
|
Pennsylvania
|
45,306
|
973,339
|
12,702,379
|
|
Rhode Island
|
1,215
|
8,404
|
1,052,567
|
|
South Carolina
|
31,124
|
208,552
|
4,625,364
|
|
South Dakota
|
77,116
|
230,419
|
814,180
|
|
Tennessee
|
42,144
|
711,771
|
6,346,105
|
|
Texas
|
266,848
|
1,132,306
|
25,145,561
|
|
Utah
|
84,897
|
226,363
|
2,763,885
|
|
Vermont
|
9,616
|
71,304
|
625,741
|
|
Virginia
|
40,772
|
276,078
|
8,001,024
|
|
Washington
|
68,170
|
181,522
|
6,724,540
|
|
West Virginia
|
24,230
|
218,853
|
1,852,994
|
|
Wisconsin
|
56,154
|
707,189
|
5,686,986
|
|
Wyoming
|
97,813
|
131,057
|
563,626
|
|
Total
|
3,617,485
|
15,375,694
|
308,143,815
|
Source: CRS, with data from email from FWS Division of Congressional and Legislative Affairs to CRS, March 26, 2019, and U.S. Fish and Wildlife Service, Wildlife and Sport Fish Restoration Program, National Hunting License Data, at https://wsfrprograms.fws.gov/Subpages/LicenseInfo/Hunting.htm.
Notes: The Wildlife Restoration program apportionment is calculated using two components. One-half of the apportionment is based on the ratio that the area of each state bears to the total area of all states, and one-half is based on the ratio of the number of paid hunting license holders in each state to the total number of hunting license holders in all states in the second fiscal year preceding the year of the apportionment (16 U.S.C. §669c(b)). Both Basic and Enhanced Hunter Education and Safety programs apportionments are determined based on the ratio that the population of each state bears to the population of all states (16 U.S.C. §§669c(c) and 669h-1). For each program, there are minimum and maximum apportionment caps. Territories are not included in the table because they are allocated funding based on set percentages or caps, as laid out in statute for each program. Additionally, territorial area, population, and hunting licenses are not included in the totals used to calculate state apportionments. Washington, DC, does not receive funding under the Wildlife Restoration or Hunter Safety and Education programs.
a. Area: State area is the sum of land area and inland water area for each state included.
b. Hunting Licenses: The annual average number of "Paid Hunting License Holders" for calculation years 2015 through 2019. The average is provided for context; however, annual apportionments are based on a single year's sales (see Table A-2 for individual year data).
c. Population: State population is determined using the most recent decennial census. Current data are from the 2010 census.
Table A-2. Hunting Licenses Sold by State (Calculation Years 2015-FY2019)
|
State
|
2015
|
2016
|
2017
|
2018
|
2019
|
Total
|
|
Alabama
|
507,926
|
565,139
|
548,829
|
547,905
|
535,933
|
2,705,732
|
|
Alaska
|
107,131
|
106,916
|
108,487
|
108,921
|
124,330
|
555,785
|
|
Arizona
|
200,092
|
215,444
|
324,553
|
305,214
|
310,392
|
1,355,695
|
|
Arkansas
|
326,779
|
328,542
|
340,200
|
326,559
|
301,240
|
1,623,320
|
|
California
|
283,539
|
287,147
|
284,069
|
280,967
|
279,248
|
1,414,970
|
|
Colorado
|
281,201
|
284,773
|
290,064
|
294,319
|
298,901
|
1,449,258
|
|
Connecticut
|
42,535
|
42,924
|
39,488
|
37,489
|
35,681
|
198,117
|
|
Delaware
|
16,786
|
17,369
|
18,323
|
17,847
|
17,839
|
88,164
|
|
Florida
|
175,349
|
181,040
|
190,526
|
190,232
|
189,038
|
926,185
|
|
Georgia
|
395,219
|
604,863
|
620,740
|
651,910
|
684,277
|
2,957,009
|
|
Hawaii
|
10,537
|
11,113
|
10,831
|
10,617
|
10,585
|
53,683
|
|
Idaho
|
258,547
|
266,007
|
273,887
|
286,947
|
295,281
|
1,380,669
|
|
Illinois
|
320,765
|
319,588
|
314,135
|
306,024
|
299,614
|
1,560,126
|
|
Indiana
|
278,322
|
280,952
|
270,875
|
267,447
|
259,453
|
1,357,049
|
|
Iowa
|
219,798
|
217,282
|
221,231
|
223,232
|
227,761
|
1,109,304
|
|
Kansas
|
239,335
|
245,647
|
245,779
|
251,390
|
250,877
|
1,233,028
|
|
Kentucky
|
340,902
|
356,500
|
353,098
|
352,408
|
346,161
|
1,749,069
|
|
Louisiana
|
370,528
|
386,310
|
395,322
|
398,808
|
396,233
|
1,947,201
|
|
Maine
|
165,781
|
168,890
|
166,051
|
163,191
|
162,065
|
825,978
|
|
Maryland
|
124,187
|
129,376
|
123,833
|
120,334
|
120,814
|
618,544
|
|
Massachusetts
|
56,797
|
59,669
|
57,973
|
57,921
|
57,970
|
290,330
|
|
Michigan
|
763,618
|
767,896
|
719,850
|
706,101
|
685,185
|
3,642,650
|
|
Minnesota
|
592,125
|
572,203
|
564,694
|
568,057
|
563,127
|
2,860,206
|
|
Mississippi
|
218,161
|
307,747
|
298,637
|
300,146
|
288,325
|
1,413,016
|
|
Missouri
|
496,583
|
502,652
|
499,489
|
498,319
|
494,030
|
2,491,073
|
|
Montana
|
229,317
|
239,542
|
240,702
|
253,412
|
227,039
|
1,190,012
|
|
Nebraska
|
175,591
|
174,493
|
175,468
|
183,056
|
185,231
|
893,839
|
|
Nevada
|
65,606
|
66,950
|
67,906
|
68,744
|
69,780
|
338,986
|
|
New Hampshire
|
59,068
|
61,556
|
59,318
|
58,099
|
57,632
|
295,673
|
|
New Jersey
|
74,067
|
75,006
|
75,248
|
74,794
|
73,009
|
372,124
|
|
New Mexico
|
97,103
|
99,328
|
103,719
|
107,331
|
106,661
|
514,142
|
|
New York
|
535,915
|
544,229
|
572,992
|
579,043
|
564,612
|
2,796,791
|
|
North Carolina
|
545,032
|
570,495
|
573,712
|
585,766
|
592,564
|
2,867,569
|
|
North Dakota
|
148,793
|
145,538
|
140,243
|
141,553
|
141,328
|
717,455
|
|
Ohio
|
404,997
|
404,081
|
394,598
|
390,268
|
376,435
|
1,970,379
|
|
Oklahoma
|
419,445
|
421,681
|
431,077
|
529,651
|
541,553
|
2,343,407
|
|
Oregon
|
264,102
|
259,000
|
262,822
|
264,684
|
335,543
|
1,386,151
|
|
Pennsylvania
|
969,633
|
980,613
|
984,637
|
975,650
|
956,163
|
4,866,696
|
|
Rhode Island
|
8,624
|
8,978
|
8,797
|
8,209
|
7,414
|
42,022
|
|
South Carolina
|
206,397
|
212,461
|
212,621
|
210,369
|
200,912
|
1,042,760
|
|
South Dakota
|
244,182
|
221,979
|
223,394
|
233,215
|
229,323
|
1,152,093
|
|
Tennessee
|
727,229
|
734,733
|
717,256
|
700,600
|
679,038
|
3,558,856
|
|
Texas
|
1,060,455
|
1,132,099
|
1,148,765
|
1,157,779
|
1,162,430
|
5,661,528
|
|
Utah
|
207,331
|
217,471
|
226,225
|
236,656
|
244,131
|
1,131,814
|
|
Vermont
|
72,930
|
74,219
|
71,807
|
69,943
|
67,619
|
356,518
|
|
Virginia
|
276,660
|
282,132
|
277,281
|
276,019
|
268,300
|
1,380,392
|
|
Washington
|
180,829
|
182,251
|
182,149
|
183,063
|
179,316
|
907,608
|
|
West Virginia
|
220,811
|
222,686
|
219,990
|
217,123
|
213,656
|
1,094,266
|
|
Wisconsin
|
717,381
|
719,110
|
700,843
|
706,400
|
692,209
|
3,535,943
|
|
Wyoming
|
133,568
|
132,141
|
127,198
|
130,304
|
132,075
|
655,286
|
|
Total
|
14,837,609
|
15,408,761
|
15,479,732
|
15,614,036
|
15,538,333
|
76,878,471
|
Source: CRS, with data from email from FWS Division of Congressional and Legislative Affairs to CRS, March 26, 2019, and U.S. Fish and Wildlife Service, Wildlife and Sport Fish Restoration Program, National Hunting License Data: Calculation Years 2014-2018, at https://wsfrprograms.fws.gov/Subpages/LicenseInfo/Hunting.htm.
Appendix B.
Annual Pittman-Robertson Wildlife Restoration Act Apportionments by State and Territory, FY2015-FY2019
Table B-1. Pittman-Robertson Total Apportionment, Under Sections 4(b), 4(c), and 10, by State and Territory (FY2015-FY2019)
(in nominal dollars)
|
State
|
FY2015
|
FY2016
|
FY2017
|
FY2018
|
FY2019
|
Total
|
|
Alabama
|
19,393,471
|
17,265,640
|
19,083,685
|
19,360,421
|
16,219,453
|
91,322,670
|
|
Alaska
|
34,625,771
|
29,532,768
|
32,969,429
|
33,455,771
|
28,219,617
|
158,803,356
|
|
American Samoa
|
1,347,460
|
1,158,529
|
1,299,808
|
1,328,563
|
1,122,415
|
6,256,775
|
|
Arizona
|
20,405,240
|
17,707,564
|
21,858,466
|
22,080,003
|
18,738,872
|
100,790,145
|
|
Arkansas
|
13,962,632
|
11,711,463
|
13,272,093
|
13,221,723
|
10,826,338
|
62,994,249
|
|
California
|
26,808,714
|
22,913,160
|
25,602,136
|
26,037,993
|
21,988,681
|
123,350,684
|
|
Colorado
|
20,211,205
|
17,257,494
|
19,418,582
|
19,872,123
|
16,885,597
|
93,645,001
|
|
Connecticut
|
5,777,433
|
5,038,584
|
5,702,335
|
5,901,190
|
4,998,992
|
27,418,534
|
|
Delaware
|
4,767,143
|
4,128,477
|
4,652,531
|
4,785,824
|
4,048,853
|
22,382,828
|
|
Washington, DC
|
—
|
—
|
—
|
—
|
—
|
—
|
|
Florida
|
14,179,497
|
12,264,952
|
13,978,911
|
14,351,398
|
12,111,926
|
66,886,684
|
|
Georgia
|
18,777,937
|
19,312,410
|
22,240,949
|
23,213,465
|
20,190,369
|
103,735,130
|
|
Guam
|
1,347,460
|
1,158,529
|
1,299,808
|
1,328,563
|
1,122,415
|
6,256,775
|
|
Hawaii
|
4,767,143
|
4,128,477
|
4,652,531
|
4,785,824
|
4,083,070
|
22,417,045
|
|
Idaho
|
15,584,921
|
13,299,962
|
15,029,712
|
15,474,320
|
13,238,818
|
72,627,733
|
|
Illinois
|
16,981,518
|
14,452,361
|
16,115,520
|
16,335,080
|
13,732,772
|
77,617,251
|
|
Indiana
|
13,982,134
|
11,993,245
|
13,302,902
|
13,573,699
|
11,384,459
|
64,236,439
|
|
Iowa
|
11,945,027
|
10,069,154
|
11,333,962
|
11,515,178
|
9,811,372
|
54,674,693
|
|
Kansas
|
15,059,994
|
12,833,780
|
14,334,290
|
14,646,057
|
12,381,483
|
69,255,604
|
|
Kentucky
|
14,369,716
|
12,432,857
|
13,914,162
|
14,127,290
|
11,874,003
|
66,718,028
|
|
Louisiana
|
15,878,957
|
13,708,874
|
15,525,062
|
15,884,383
|
13,432,035
|
74,429,311
|
|
Maine
|
8,407,092
|
7,162,578
|
7,964,547
|
8,055,283
|
6,801,597
|
38,391,097
|
|
Maryland
|
7,674,842
|
6,742,718
|
7,545,171
|
7,754,551
|
6,592,492
|
36,309,774
|
|
Massachusetts
|
7,666,174
|
6,740,034
|
7,664,947
|
7,986,372
|
6,775,277
|
36,832,804
|
|
Michigan
|
26,568,621
|
22,443,457
|
24,198,482
|
24,296,525
|
20,242,515
|
117,749,600
|
|
Minnesota
|
24,907,623
|
20,719,919
|
22,971,924
|
23,400,370
|
19,741,200
|
111,741,036
|
|
Mississippi
|
11,014,940
|
10,729,644
|
11,956,397
|
12,144,757
|
10,102,194
|
55,947,932
|
|
Missouri
|
21,843,658
|
18,598,232
|
20,756,674
|
21,117,103
|
17,819,728
|
100,135,395
|
|
Montana
|
21,552,756
|
18,441,964
|
20,611,646
|
21,131,270
|
17,468,080
|
99,205,716
|
|
N. Mariana Islands
|
1,347,460
|
1,158,529
|
1,299,808
|
1,328,563
|
1,122,415
|
6,256,775
|
|
Nebraska
|
13,199,091
|
11,172,967
|
12,495,645
|
12,833,330
|
10,890,046
|
60,591,079
|
|
Nevada
|
14,315,511
|
12,234,352
|
13,697,843
|
13,948,153
|
11,795,554
|
65,991,413
|
|
New Hampshire
|
4,767,143
|
4,128,477
|
4,652,531
|
4,785,824
|
4,048,853
|
22,382,828
|
|
New Jersey
|
7,666,174
|
6,740,034
|
7,664,947
|
7,986,372
|
6,775,277
|
36,832,804
|
|
New Mexico
|
16,123,634
|
13,769,046
|
15,467,517
|
15,787,434
|
13,326,908
|
74,474,539
|
|
New York
|
20,837,603
|
17,702,363
|
20,341,226
|
20,862,345
|
17,470,049
|
97,213,586
|
|
North Carolina
|
21,315,164
|
18,446,736
|
20,734,869
|
21,338,737
|
18,198,167
|
100,033,673
|
|
North Dakota
|
11,935,140
|
10,085,485
|
11,170,517
|
11,377,784
|
9,616,313
|
54,185,239
|
|
Ohio
|
17,194,036
|
14,593,198
|
16,188,100
|
16,457,632
|
13,737,911
|
78,170,877
|
|
Oklahoma
|
18,677,008
|
15,826,672
|
17,845,424
|
19,907,732
|
17,143,599
|
89,400,435
|
|
Oregon
|
18,283,088
|
15,457,600
|
17,345,633
|
17,690,588
|
16,031,149
|
84,808,058
|
|
Pennsylvania
|
29,542,027
|
24,948,408
|
27,913,408
|
28,157,633
|
23,560,142
|
134,121,618
|
|
Puerto Rico
|
3,559,210
|
3,040,328
|
3,397,357
|
3,452,263
|
2,912,843
|
16,362,001
|
|
Rhode Island
|
4,767,143
|
4,128,477
|
4,652,531
|
4,785,824
|
4,048,853
|
22,382,828
|
|
South Carolina
|
10,776,814
|
9,311,672
|
10,497,258
|
10,678,793
|
8,941,843
|
50,206,380
|
|
South Dakota
|
14,620,621
|
12,010,444
|
13,394,017
|
13,775,104
|
11,599,587
|
65,399,773
|
|
Tennessee
|
23,852,672
|
20,400,396
|
22,484,134
|
22,544,767
|
18,764,908
|
108,046,877
|
|
Texas
|
37,524,802
|
32,144,324
|
35,981,845
|
36,656,319
|
30,946,041
|
173,253,331
|
|
Utah
|
14,645,168
|
12,569,415
|
14,206,094
|
14,616,342
|
12,480,803
|
68,517,822
|
|
Vermont
|
4,767,143
|
4,128,477
|
4,652,531
|
4,785,824
|
4,048,853
|
22,382,828
|
|
Virgin Islands
|
1,347,460
|
1,158,923
|
1,299,808
|
1,328,563
|
1,122,415
|
6,257,169
|
|
Virginia
|
14,436,495
|
12,399,343
|
13,854,774
|
14,176,335
|
11,914,111
|
66,781,058
|
|
Washington
|
15,239,993
|
13,098,081
|
14,726,685
|
15,120,458
|
12,756,164
|
70,941,381
|
|
West Virginia
|
8,622,897
|
7,314,107
|
8,126,275
|
8,209,596
|
6,898,259
|
39,171,134
|
|
Wisconsin
|
24,887,261
|
20,982,254
|
23,095,485
|
23,542,090
|
19,739,356
|
112,246,446
|
|
Wyoming
|
14,432,352
|
12,244,765
|
13,588,772
|
13,861,148
|
11,741,122
|
65,868,159
|
|
Total
|
808,492,189
|
695,141,699
|
780,031,696
|
797,160,652
|
673,586,164
|
3,754,412,400
|
Table B-2. Pittman-Robertson Wildlife Restoration (Section 4(b)) Apportionment, by State and Territory (FY2015-FY2019)
(in nominal dollars)
|
State
|
FY2015
|
FY2016
|
FY2017
|
FY2018
|
FY2019
|
Total
|
|
Alabama
|
16,103,906
|
14,302,276
|
15,665,460
|
15,728,723
|
13,125,746
|
74,926,111
|
|
Alaska
|
33,176,254
|
28,226,990
|
31,463,221
|
31,855,497
|
26,856,405
|
151,578,367
|
|
American Samoa
|
1,105,874
|
940,900
|
1,048,774
|
1,061,850
|
895,213
|
5,052,611
|
|
Arizona
|
16,056,692
|
13,790,229
|
17,339,842
|
17,279,181
|
14,649,236
|
79,115,180
|
|
Arkansas
|
12,513,115
|
10,405,685
|
11,765,885
|
11,621,449
|
9,463,126
|
55,769,260
|
|
California
|
22,460,166
|
18,995,825
|
21,083,512
|
21,237,171
|
17,899,045
|
101,675,719
|
|
Colorado
|
16,749,953
|
14,139,468
|
15,821,958
|
16,050,882
|
13,630,427
|
76,392,688
|
|
Connecticut
|
3,317,626
|
2,822,699
|
3,146,323
|
3,185,550
|
2,685,641
|
15,157,839
|
|
Delaware
|
3,317,626
|
2,822,699
|
3,146,323
|
3,185,550
|
2,685,641
|
15,157,839
|
|
Washington, DC
|
—
|
—
|
—
|
—
|
—
|
—
|
|
Florida
|
9,830,949
|
8,347,617
|
9,460,287
|
9,550,576
|
8,022,290
|
45,211,719
|
|
Georgia
|
14,429,389
|
15,395,075
|
17,722,325
|
18,412,643
|
16,100,733
|
82,060,165
|
|
Guam
|
1,105,874
|
940,900
|
1,048,774
|
1,061,850
|
895,213
|
5,052,611
|
|
Hawaii
|
3,317,626
|
2,822,699
|
3,146,323
|
3,185,550
|
2,719,858
|
15,192,056
|
|
Idaho
|
14,135,404
|
11,994,184
|
13,523,504
|
13,874,046
|
11,875,606
|
65,402,744
|
|
Illinois
|
12,632,970
|
10,535,026
|
11,596,896
|
11,534,258
|
9,643,136
|
55,942,286
|
|
Indiana
|
9,633,586
|
8,075,910
|
8,784,278
|
8,772,877
|
7,294,823
|
42,561,474
|
|
Iowa
|
10,495,510
|
8,763,376
|
9,827,754
|
9,914,904
|
8,448,160
|
47,449,704
|
|
Kansas
|
13,610,477
|
11,528,002
|
12,828,082
|
13,045,783
|
11,018,271
|
62,030,615
|
|
Kentucky
|
11,383,225
|
9,742,511
|
10,810,867
|
10,830,192
|
9,065,328
|
51,832,123
|
|
Louisiana
|
12,758,946
|
10,898,251
|
12,283,026
|
12,439,874
|
10,497,788
|
58,877,885
|
|
Maine
|
6,957,575
|
5,856,800
|
6,458,339
|
6,455,009
|
5,438,385
|
31,166,108
|
|
Maryland
|
3,701,301
|
3,163,203
|
3,416,221
|
3,367,742
|
2,855,534
|
16,504,001
|
|
Massachusetts
|
3,317,626
|
2,822,699
|
3,146,323
|
3,185,550
|
2,685,641
|
15,157,839
|
|
Michigan
|
22,220,073
|
18,526,122
|
19,679,858
|
19,495,703
|
16,152,879
|
96,074,635
|
|
Minnesota
|
21,257,294
|
17,431,565
|
19,178,826
|
19,370,387
|
16,308,209
|
93,546,281
|
|
Mississippi
|
9,565,423
|
9,423,866
|
10,450,189
|
10,544,483
|
8,738,982
|
48,722,943
|
|
Missouri
|
17,721,890
|
14,885,182
|
16,473,699
|
16,566,649
|
13,943,368
|
79,590,788
|
|
Montana
|
20,103,239
|
17,136,186
|
19,105,438
|
19,530,996
|
16,104,868
|
91,980,727
|
|
N. Mariana Islands
|
1,105,874
|
940,900
|
1,048,774
|
1,061,850
|
895,213
|
5,052,611
|
|
Nebraska
|
11,749,574
|
9,867,189
|
10,989,437
|
11,233,056
|
9,526,834
|
53,366,090
|
|
Nevada
|
12,865,994
|
10,928,574
|
12,191,635
|
12,347,879
|
10,432,342
|
58,766,424
|
|
New Hampshire
|
3,317,626
|
2,822,699
|
3,146,323
|
3,185,550
|
2,685,641
|
15,157,839
|
|
New Jersey
|
3,317,626
|
2,822,699
|
3,146,323
|
3,185,550
|
2,685,641
|
15,157,839
|
|
New Mexico
|
14,674,117
|
12,463,268
|
13,961,309
|
14,187,160
|
11,963,696
|
67,249,550
|
|
New York
|
16,489,055
|
13,785,028
|
15,822,602
|
16,061,523
|
13,380,413
|
75,538,621
|
|
North Carolina
|
16,966,616
|
14,529,401
|
16,216,245
|
16,537,915
|
14,108,531
|
78,358,708
|
|
North Dakota
|
10,485,623
|
8,779,707
|
9,664,309
|
9,777,510
|
8,253,101
|
46,960,250
|
|
Ohio
|
12,845,488
|
10,675,863
|
11,669,476
|
11,656,810
|
9,648,275
|
56,495,912
|
|
Oklahoma
|
16,095,209
|
13,500,885
|
15,162,651
|
17,057,413
|
14,715,523
|
76,531,681
|
|
Oregon
|
15,646,421
|
13,082,388
|
14,605,848
|
14,779,696
|
13,551,469
|
71,665,822
|
|
Pennsylvania
|
25,193,479
|
21,031,073
|
23,394,784
|
23,356,811
|
19,470,506
|
112,446,653
|
|
Puerto Rico
|
3,317,624
|
2,822,699
|
3,146,323
|
3,185,550
|
2,685,641
|
15,157,837
|
|
Rhode Island
|
3,317,626
|
2,822,699
|
3,146,323
|
3,185,550
|
2,685,641
|
15,157,839
|
|
South Carolina
|
7,593,491
|
6,444,017
|
7,189,433
|
7,164,389
|
5,948,056
|
34,339,386
|
|
South Dakota
|
13,171,104
|
10,704,666
|
11,887,809
|
12,174,830
|
10,236,375
|
58,174,784
|
|
Tennessee
|
19,504,124
|
16,483,061
|
17,965,510
|
17,743,945
|
14,675,272
|
86,371,912
|
|
Texas
|
33,176,254
|
28,226,989
|
31,463,221
|
31,855,497
|
26,856,405
|
151,578,366
|
|
Utah
|
13,195,651
|
11,263,637
|
12,699,886
|
13,016,068
|
11,117,591
|
61,292,833
|
|
Vermont
|
3,317,626
|
2,822,699
|
3,146,323
|
3,185,550
|
2,685,641
|
15,157,839
|
|
Virgin Islands
|
1,105,874
|
941,294
|
1,048,774
|
1,061,850
|
895,213
|
5,053,005
|
|
Virginia
|
10,087,947
|
8,482,008
|
9,336,150
|
9,375,513
|
7,824,475
|
45,106,093
|
|
Washington
|
10,891,445
|
9,180,746
|
10,208,061
|
10,319,636
|
8,666,528
|
49,266,416
|
|
West Virginia
|
7,173,380
|
6,008,329
|
6,620,067
|
6,609,322
|
5,535,047
|
31,946,145
|
|
Wisconsin
|
20,973,296
|
17,456,409
|
19,028,444
|
19,221,052
|
16,058,431
|
92,737,632
|
|
Wyoming
|
12,982,835
|
10,938,987
|
12,082,564
|
12,260,874
|
10,377,910
|
58,643,170
|
|
Total
|
663,540,568
|
564,563,859
|
629,410,911
|
637,133,274
|
537,264,963
|
3,031,913,575
|
Table B-3. Pittman-Robertson Basic Hunter Education (Section 4(c)) Apportionment, by State and Territory (FY2015-FY2019)
(in nominal dollars)
|
State
|
FY2015
|
FY2016
|
FY2017
|
FY2018
|
FY2019
|
Total
|
|
Alabama
|
3,108,193
|
2,780,902
|
3,236,852
|
3,449,963
|
2,911,063
|
15,486,973
|
|
Alaska
|
1,369,597
|
1,225,378
|
1,426,288
|
1,520,194
|
1,282,732
|
6,824,189
|
|
American Samoa
|
228,266
|
204,229
|
237,714
|
253,366
|
213,788
|
1,137,363
|
|
Arizona
|
4,108,788
|
3,676,135
|
4,278,864
|
4,560,582
|
3,848,196
|
20,472,565
|
|
Arkansas
|
1,369,597
|
1,225,378
|
1,426,288
|
1,520,194
|
1,282,732
|
6,824,189
|
|
California
|
4,108,788
|
3,676,135
|
4,278,864
|
4,560,582
|
3,848,196
|
20,472,565
|
|
Colorado
|
3,270,414
|
2,926,041
|
3,405,786
|
3,630,021
|
3,062,994
|
16,295,256
|
|
Connecticut
|
2,324,184
|
2,079,448
|
2,420,389
|
2,579,746
|
2,176,777
|
11,580,544
|
|
Delaware
|
1,369,597
|
1,225,378
|
1,426,288
|
1,520,194
|
1,282,732
|
6,824,189
|
|
Washington, DC
|
—
|
—
|
—
|
—
|
—
|
—
|
|
Florida
|
4,108,788
|
3,676,135
|
4,278,864
|
4,560,582
|
3,848,196
|
20,472,565
|
|
Georgia
|
4,108,788
|
3,676,135
|
4,278,864
|
4,560,582
|
3,848,196
|
20,472,565
|
|
Guam
|
228,266
|
204,229
|
237,714
|
253,366
|
213,788
|
1,137,363
|
|
Hawaii
|
1,369,597
|
1,225,378
|
1,426,288
|
1,520,194
|
1,282,732
|
6,824,189
|
|
Idaho
|
1,369,597
|
1,225,378
|
1,426,288
|
1,520,194
|
1,282,732
|
6,824,189
|
|
Illinois
|
4,108,788
|
3,676,135
|
4,278,864
|
4,560,582
|
3,848,196
|
20,472,565
|
|
Indiana
|
4,108,788
|
3,676,135
|
4,278,864
|
4,560,582
|
3,848,196
|
20,472,565
|
|
Iowa
|
1,369,597
|
1,225,378
|
1,426,288
|
1,520,194
|
1,282,732
|
6,824,189
|
|
Kansas
|
1,369,597
|
1,225,378
|
1,426,288
|
1,520,194
|
1,282,732
|
6,824,189
|
|
Kentucky
|
2,821,828
|
2,524,695
|
2,938,633
|
3,132,106
|
2,642,859
|
14,060,121
|
|
Louisiana
|
2,947,987
|
2,637,566
|
3,070,013
|
3,272,140
|
2,761,018
|
14,688,724
|
|
Maine
|
1,369,597
|
1,225,378
|
1,426,288
|
1,520,194
|
1,282,732
|
6,824,189
|
|
Maryland
|
3,754,457
|
3,359,116
|
3,909,866
|
4,167,287
|
3,516,339
|
18,707,065
|
|
Massachusetts
|
4,108,788
|
3,676,135
|
4,278,864
|
4,560,582
|
3,848,196
|
20,472,565
|
|
Michigan
|
4,108,788
|
3,676,135
|
4,278,864
|
4,560,582
|
3,848,196
|
20,472,565
|
|
Minnesota
|
3,449,066
|
3,085,882
|
3,591,834
|
3,828,317
|
3,230,317
|
17,185,416
|
|
Mississippi
|
1,369,597
|
1,225,378
|
1,426,288
|
1,520,194
|
1,282,732
|
6,824,189
|
|
Missouri
|
3,894,512
|
3,484,428
|
4,055,719
|
4,322,743
|
3,647,511
|
19,404,913
|
|
Montana
|
1,369,597
|
1,225,378
|
1,426,288
|
1,520,194
|
1,282,732
|
6,824,189
|
|
N. Mariana Islands
|
228,266
|
204,229
|
237,714
|
253,366
|
213,788
|
1,137,363
|
|
Nebraska
|
1,369,597
|
1,225,378
|
1,426,288
|
1,520,194
|
1,282,732
|
6,824,189
|
|
Nevada
|
1,369,597
|
1,225,378
|
1,426,288
|
1,520,194
|
1,282,732
|
6,824,189
|
|
New Hampshire
|
1,369,597
|
1,225,378
|
1,426,288
|
1,520,194
|
1,282,732
|
6,824,189
|
|
New Jersey
|
4,108,788
|
3,676,135
|
4,278,864
|
4,560,582
|
3,848,196
|
20,472,565
|
|
New Mexico
|
1,369,597
|
1,225,378
|
1,426,288
|
1,520,194
|
1,282,732
|
6,824,189
|
|
New York
|
4,108,788
|
3,676,135
|
4,278,864
|
4,560,582
|
3,848,196
|
20,472,565
|
|
North Carolina
|
4,108,788
|
3,676,135
|
4,278,864
|
4,560,582
|
3,848,196
|
20,472,565
|
|
North Dakota
|
1,369,597
|
1,225,378
|
1,426,288
|
1,520,194
|
1,282,732
|
6,824,189
|
|
Ohio
|
4,108,788
|
3,676,135
|
4,278,864
|
4,560,582
|
3,848,196
|
20,472,565
|
|
Oklahoma
|
2,439,450
|
2,182,582
|
2,540,424
|
2,707,685
|
2,284,732
|
12,154,873
|
|
Oregon
|
2,491,293
|
2,228,965
|
2,594,411
|
2,765,227
|
2,333,287
|
12,413,183
|
|
Pennsylvania
|
4,108,788
|
3,676,135
|
4,278,864
|
4,560,582
|
3,848,196
|
20,472,565
|
|
Puerto Rico
|
228,266
|
204,229
|
237,714
|
253,366
|
213,788
|
1,137,363
|
|
Rhode Island
|
1,369,597
|
1,225,378
|
1,426,288
|
1,520,194
|
1,282,732
|
6,824,189
|
|
South Carolina
|
3,007,808
|
2,691,087
|
3,132,309
|
3,338,538
|
2,817,044
|
14,986,786
|
|
South Dakota
|
1,369,597
|
1,225,378
|
1,426,288
|
1,520,194
|
1,282,732
|
6,824,189
|
|
Tennessee
|
4,108,788
|
3,676,135
|
4,278,864
|
4,560,582
|
3,848,196
|
20,472,565
|
|
Texas
|
4,108,788
|
3,676,135
|
4,278,864
|
4,560,582
|
3,848,196
|
20,472,565
|
|
Utah
|
1,369,597
|
1,225,378
|
1,426,288
|
1,520,194
|
1,282,732
|
6,824,189
|
|
Vermont
|
1,369,597
|
1,225,378
|
1,426,288
|
1,520,194
|
1,282,732
|
6,824,189
|
|
Virgin Islands
|
228,266
|
204,229
|
237,714
|
253,366
|
213,788
|
1,137,363
|
|
Virginia
|
4,108,788
|
3,676,135
|
4,278,864
|
4,560,582
|
3,848,196
|
20,472,565
|
|
Washington
|
4,108,788
|
3,676,135
|
4,278,864
|
4,560,582
|
3,848,196
|
20,472,565
|
|
West Virginia
|
1,369,597
|
1,225,378
|
1,426,288
|
1,520,194
|
1,282,732
|
6,824,189
|
|
Wisconsin
|
3,698,166
|
3,308,750
|
3,851,243
|
4,104,807
|
3,463,616
|
18,426,582
|
|
Wyoming
|
1,369,597
|
1,225,378
|
1,426,288
|
1,520,194
|
1,282,732
|
6,824,189
|
|
Total
|
136,959,621
|
122,537,840
|
142,628,785
|
152,019,378
|
128,273,201
|
682,418,825
|
Table B-4. Pittman-Robertson Enhanced Hunter Education (Section 10) Apportionment, by State and Territory (FY2015-FY2019)
(in nominal dollars)
|
State
|
2015
|
2016
|
2017
|
2018
|
2019
|
Total
|
|
Alabama
|
181,372
|
182,462
|
181,373
|
181,735
|
182,644
|
909,586
|
|
Alaska
|
79,920
|
80,400
|
79,920
|
80,080
|
80,480
|
400,800
|
|
American Samoa
|
13,320
|
13,400
|
13,320
|
13,347
|
13,414
|
66,801
|
|
Arizona
|
239,760
|
241,200
|
239,760
|
240,240
|
241,440
|
1,202,400
|
|
Arkansas
|
79,920
|
80,400
|
79,920
|
80,080
|
80,480
|
400,800
|
|
California
|
239,760
|
241,200
|
239,760
|
240,240
|
241,440
|
1,202,400
|
|
Colorado
|
190,838
|
191,985
|
190,838
|
191,220
|
192,176
|
957,057
|
|
Connecticut
|
135,623
|
136,437
|
135,623
|
135,894
|
136,574
|
680,151
|
|
Delaware
|
79,920
|
80,400
|
79,920
|
80,080
|
80,480
|
400,800
|
|
Washington, DC
|
—
|
—
|
—
|
—
|
—
|
—
|
|
Florida
|
239,760
|
241,200
|
239,760
|
240,240
|
241,440
|
1,202,400
|
|
Georgia
|
239,760
|
241,200
|
239,760
|
240,240
|
241,440
|
1,202,400
|
|
Guam
|
13,320
|
13,400
|
13,320
|
13,347
|
13,414
|
66,801
|
|
Hawaii
|
79,920
|
80,400
|
79,920
|
80,080
|
80,480
|
400,800
|
|
Idaho
|
79,920
|
80,400
|
79,920
|
80,080
|
80,480
|
400,800
|
|
Illinois
|
239,760
|
241,200
|
239,760
|
240,240
|
241,440
|
1,202,400
|
|
Indiana
|
239,760
|
241,200
|
239,760
|
240,240
|
241,440
|
1,202,400
|
|
Iowa
|
79,920
|
80,400
|
79,920
|
80,080
|
80,480
|
400,800
|
|
Kansas
|
79,920
|
80,400
|
79,920
|
80,080
|
80,480
|
400,800
|
|
Kentucky
|
164,663
|
165,651
|
164,662
|
164,992
|
165,816
|
825,784
|
|
Louisiana
|
172,024
|
173,057
|
172,023
|
172,369
|
173,229
|
862,702
|
|
Maine
|
79,920
|
80,400
|
79,920
|
80,080
|
80,480
|
400,800
|
|
Maryland
|
219,084
|
220,399
|
219,084
|
219,522
|
220,619
|
1,098,708
|
|
Massachusetts
|
239,760
|
241,200
|
239,760
|
240,240
|
241,440
|
1,202,400
|
|
Michigan
|
239,760
|
241,200
|
239,760
|
240,240
|
241,440
|
1,202,400
|
|
Minnesota
|
201,263
|
202,472
|
201,264
|
201,666
|
202,674
|
1,009,339
|
|
Mississippi
|
79,920
|
80,400
|
79,920
|
80,080
|
80,480
|
400,800
|
|
Missouri
|
227,256
|
228,622
|
227,256
|
227,711
|
228,849
|
1,139,694
|
|
Montana
|
79,920
|
80,400
|
79,920
|
80,080
|
80,480
|
400,800
|
|
N. Mariana Islands
|
13,320
|
13,400
|
13,320
|
13,347
|
13,414
|
66,801
|
|
Nebraska
|
79,920
|
80,400
|
79,920
|
80,080
|
80,480
|
400,800
|
|
Nevada
|
79,920
|
80,400
|
79,920
|
80,080
|
80,480
|
400,800
|
|
New Hampshire
|
79,920
|
80,400
|
79,920
|
80,080
|
80,480
|
400,800
|
|
New Jersey
|
239,760
|
241,200
|
239,760
|
240,240
|
241,440
|
1,202,400
|
|
New Mexico
|
79,920
|
80,400
|
79,920
|
80,080
|
80,480
|
400,800
|
|
New York
|
239,760
|
241,200
|
239,760
|
240,240
|
241,440
|
1,202,400
|
|
North Carolina
|
239,760
|
241,200
|
239,760
|
240,240
|
241,440
|
1,202,400
|
|
North Dakota
|
79,920
|
80,400
|
79,920
|
80,080
|
80,480
|
400,800
|
|
Ohio
|
239,760
|
241,200
|
239,760
|
240,240
|
241,440
|
1,202,400
|
|
Oklahoma
|
142,349
|
143,205
|
142,349
|
142,634
|
143,344
|
713,881
|
|
Oregon
|
145,374
|
146,247
|
145,374
|
145,665
|
146,393
|
729,053
|
|
Pennsylvania
|
239,760
|
241,200
|
239,760
|
240,240
|
241,440
|
1,202,400
|
|
Puerto Rico
|
13,320
|
13,400
|
13,320
|
13,347
|
13,414
|
66,801
|
|
Rhode Island
|
79,920
|
80,400
|
79,920
|
80,080
|
80,480
|
400,800
|
|
South Carolina
|
175,515
|
176,568
|
175,516
|
175,866
|
176,743
|
880,208
|
|
South Dakota
|
79,920
|
80,400
|
79,920
|
80,080
|
80,480
|
400,800
|
|
Tennessee
|
239,760
|
241,200
|
239,760
|
240,240
|
241,440
|
1,202,400
|
|
Texas
|
239,760
|
241,200
|
239,760
|
240,240
|
241,440
|
1,202,400
|
|
Utah
|
79,920
|
80,400
|
79,920
|
80,080
|
80,480
|
400,800
|
|
Vermont
|
79,920
|
80,400
|
79,920
|
80,080
|
80,480
|
400,800
|
|
Virgin Islands
|
13,320
|
13,400
|
13,320
|
13,347
|
13,414
|
66,801
|
|
Virginia
|
239,760
|
241,200
|
239,760
|
240,240
|
241,440
|
1,202,400
|
|
Washington
|
239,760
|
241,200
|
239,760
|
240,240
|
241,440
|
1,202,400
|
|
West Virginia
|
79,920
|
80,400
|
79,920
|
80,080
|
80,480
|
400,800
|
|
Wisconsin
|
215,799
|
217,095
|
215,798
|
216,231
|
217,309
|
1,082,232
|
|
Wyoming
|
79,920
|
80,400
|
79,920
|
80,080
|
80,480
|
400,800
|
|
Total
|
7,992,000
|
8,040,000
|
7,992,000
|
8,008,000
|
8,048,000
|
40,080,000
|
Source: CRS, data from U.S. Fish and Wildlife Service, Wildlife Restoration Program – Funding (WR Final Apportionment FY2015-FY2019), at https://wsfrprograms.fws.gov/Subpages/GrantPrograms/WR/WR_Funding.htm.
Note: Table includes values reported in nominal dollars not accounting for change in purchasing power. The variation in total annual apportionment is due to adjustments made pursuant to the Balanced Budget and Emergency Deficit Control Act, as amended (2 U.S.C. §§900 et seq.).