The federal crop insurance program offers subsidized crop insurance policies to farmers. Historically, the federal crop insurance program has covered primarily traditional field crops such as wheat, corn, and soybeans. In contrast, specialty crops—covering fruits, vegetables, tree nuts, and nursery crops—have not been a major part of the federal crop insurance program. However, legislative changes, coupled with ongoing administrative efforts by the U.S. Department of Agriculture (USDA), have expanded federal crop insurance coverage for specialty crops, and they now account for a small but growing number of federal crop insurance policies bought by farmers. Over the past few decades, total specialty crop insured liabilities rose from nearly $1 billion in 1989 to nearly $18.5 billion in 2017. Federal crop insurance policies currently cover around 38 specialty crop categories, which include roughly 80 types of fruits, vegetables, tree nuts, and nursery crops.
Many specialty crops, however, do not have crop-specific insurance policies. Currently, about one-half of all U.S. specialty crop acres are covered by federal crop insurance policies. Some specialty crops may be covered under a Whole Farm Revenue Protection (WFRP) insurance policy, intended to fill in coverage gaps for producers of uninsured crops that lack individual policy coverage and for producers marketing to local, farm-identity preserved, or direct markets. Despite this expansion, coverage for specialty crops remains below that for traditional crops. Combined, federal crop insurance for specialty crops and WFRP together accounted for about 17% of the entire federal crop insurance portfolio by liability during crop year 2017.
This report focuses on how specialty crops are covered under the federal crop insurance program. For detailed background and historical information on the federal crop insurance program as a whole, and on how the federal crop insurance program operates, see CRS Report R45193, Federal Crop Insurance: Program Overview for the 115th Congress.
Crop Insurance Program Authority and Operation
Overview of the Federal Crop Insurance Program
The federal crop insurance program is permanently authorized by the Federal Crop Insurance Act, as amended (7 U.S.C. §1501 et seq.). The USDA's Risk Management Agency (RMA) regulates the program, and the Federal Crop Insurance Corporation (FCIC) funds it.
Congress first authorized federal crop insurance in an effort to mitigate the effects on farmers of the Great Depression and of the crop losses seen in the Dust Bowl. In 1938, the FCIC was created to carry out the program, which focused on major crops like wheat in leading producing regions. During the same era, farm programs were established to support crop prices and boost farm income for producers of so-called program crops, including wheat, corn, and cotton.
The availability of federal crop insurance expanded with the passage of the Federal Crop Insurance Act of 1980 (P.L. 96-365), which brought coverage to many more crops and regions of the country. To increase participation, Congress enhanced the crop insurance program in 1994 by raising subsidy levels and in 2000 by expanding geographic availability and again raising subsidy levels.1 The changes also expanded the role of the private sector in developing new products that would help farmers manage their risks. Today, many banks, when making operating loans, require that farmers purchase crop insurance.
The federal crop insurance program provides farmers with risk management tools to cope with yield and price declines. Under the program, farmers can purchase subsidized policies that pay indemnities when their production or revenue2 falls below a producer-selected coverage level. Insurance policies are sold and completely serviced through approved private insurance companies. The insurance companies' losses are reinsured by USDA, and their administrative and operating costs are subsidized by the federal government.
In purchasing a crop insurance policy, a producer selects a level of coverage (i.e., deductible) and pays a portion of the premium that increases with higher coverage levels (or none of it in the case of catastrophic coverage). The federal government pays the rest of the premium (63%, on average, in 2017).
The federal crop insurance program offers two main levels of coverage: Catastrophic Risk Protection (CAT) and buy-up coverage:3
- 1. CAT coverage insures against losses in excess of 50% of normal yield, equal to 55% of the estimated market price of the crop (called 50/55 coverage). The premium is 100% subsidized. Producers pay an administrative fee of $655 per crop per county.4 Limited-resource producers may have this fee waived.5 CAT coverage is not available on all types of policies.
- 2. Buy-up coverage allows producers to obtain coverage beyond the catastrophic level and pay a premium that is subsidized by the federal government. Buy-up provides for additional coverage up to 85% of production per acre and 100% of a specified market price established for each crop and region. The premium subsidy for these policies ranges from 38% to 67%.6 Producers pay an administrative fee of $30 per crop per county.7
The availability of crop insurance for a particular crop in a particular region is an administrative decision made by RMA. The decision is made on a crop-by-crop and county-by-county basis based on farmer demand for coverage and the level of risk associated with the crop in the region, among other factors. In areas where a policy is not available, farmers may request that RMA expand the program to their county. The process usually starts with a pilot program in order for RMA to gain experience and test the program components before it becomes more widely available. Alternatively, a policy can be reviewed and later discontinued if it fails to perform at an acceptable level (e.g., it experiences low participation or high losses).
RMA also regularly responds to requests from commodity organizations or industry representatives for enhancements to existing coverage, such as adding revenue coverage. RMA offers pilot programs with various types of coverage for new crops (particularly specialty crops) or that include new geographical areas. It uses the performance of these programs to inform its decision on whether to extend coverage permanently.8
Expansion of Coverage for Specialty Crops
Efforts to expand federal crop insurance coverage to crops that had not traditionally been eligible under the program dates back to the 1990s. The Federal Crop Insurance Reform and Department of Agriculture Reauthorization Act of 1994 (P.L. 103-354) helped initiate efforts to expand federal crop insurance coverage for specialty crop producers. It amended the Federal Crop Insurance Act to require (among other things) additional data collection, reporting to facilitate the development of new crop insurance policies, tracking the progress of newly developed policies, and an expected timetable for expanding crop insurance coverage to include "new and specialty crops."9 Since then RMA has submitted episodic reports to Congress tracking this progress.10 The Agriculture Risk Protection Act of 2000 (P.L. 106-224) further emphasized increasing the availability of risk management tools for producers of crops with no individual policy coverage.
Previous omnibus farm bills—including the Agricultural Act of 2014 (P.L. 113-79, "2014 farm bill") and the Food, Conservation, and Energy Act of 2008 (P.L. 110-246, "2008 farm bill")—also enhanced the federal crop insurance program by expanding its scope and broadening policy coverage for specialty crops, organic agriculture, and crops that are sold directly to local markets. These laws authorized and extended other USDA programs that help facilitate the formulation of crop insurance policies for specialty crop producers, including market data collection programs.
The 2008 and 2014 farm bills further expanded provisions governing how RMA administers and implements Section 508(h) of the Federal Crop Insurance Act, which governs new policy development, including how it is contracted out and funded, how policy ratings are undertaken, and how a policy may start as a pilot and may (or may not) evolve to a full-fledged insurance policy. Additional information on the Section 508(h) process is described in "Development of New Policies and Section 508(h)."
The 2014 farm bill also directed RMA to develop the WFRP insurance policy as part of an effort to provide additional options for crops that lack crop-specific policy coverage. WFRP policies insure revenue of the entire farm, rather than an individual crop, under a single insurance policy that is not limited to specialty crop production. The types of producers eligible for whole farm policies include direct-to-consumer marketers and producers of multiple agricultural commodities, including specialty crops, industrial crops, livestock, and aquaculture products. Coverage is also expanded for the value of packing, packaging, or any other similar on-farm activity. WFRP can be combined with other policies with buy-up coverage. WFRP does not offer CAT-level coverage and cannot be combined with CAT-level policies. WFRP is discussed further in "Whole Farm Revenue Protection (WFRP) Insurance."
Despite expansion of the federal crop insurance program, coverage for specialty crops remains below that for traditional crops in terms of individual crop policies and covered acres. Often insurers face technical difficulties in developing new policies such as price discovery, non-weather risks, and premium ratings. In some cases, USDA has not pursued policies for particular commodities because producers have expressed concerns that offering insurance could adversely affect the market (i.e., because an insurance policy reduces producer risk, farmers may plant more acreage, which could drive down prices and total crop revenue). This has been a particular concern for vegetable crops and explains in part lower levels of insured vegetable acreage compared with other crops.11 These and other challenges are discussed later in "Challenges with Developing Specialty Crop Policies."
Specialty Crop Insured Coverage and Participation
Definition of Specialty Crops
In statute, specialty crops refers to "fruits and vegetables, tree nuts, dried fruits, and horticulture and nursery crops (including floriculture)" [7 U.S.C. §1621 note].12 This definition covers more than 300 individual agricultural commodities.13 It includes fresh and processed fruits and vegetables, tree nuts,14 a range of nursery plants (trees, shrubs, and flowering plants), culinary herbs and spices, coffee and tea, and also honey and maple syrup, according to guidelines established by USDA. The statutory definition of specialty crops ties to program eligibility and funding allocations for a number of USDA programs providing marketing and research assistance to eligible producer groups.15
Unlike many traditional commodity crops, specialty crops are generally not eligible for USDA farm revenue support programs—that is, programs such as the Agricultural Risk Loss Coverage (ARC), Price Loss Coverage (PLC), and Marketing Assistance Loans (MAL) programs.16 The federal government has historically supported specialty crops indirectly through research and marketing grants. 17 The federal government provides direct assistance to individual specialty crop farmers via federal crop insurance and supplemental disaster assistance.
Overview of Premiums, Product Introductions, and Participation
Legislative changes coupled with USDA administrative efforts have contributed to broader federal crop insurance coverage of fruits, vegetables, tree nuts, and nursery crops over the past few decades. Total liability, or the estimated value of the insured portion of the crop, is a useful measure of program growth. Specialty crop insured liabilities rose from nearly $1 billion in 1989 to nearly $18.5 billion in 2017 (Figure 1), reflecting increased production and participation.18 In contrast, total liabilities for all federally insured crops and livestock was $106.7 billion in 2017.19 At $18.5 billion, specialty crops represented about 17% of the federal crop insurance portfolio by liability in 2017 (Figure 1).
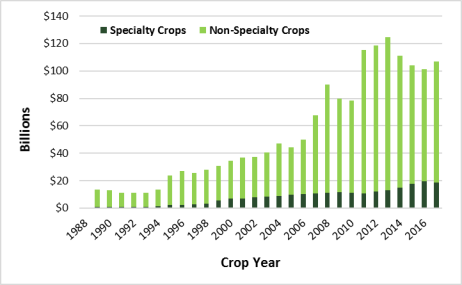
Table 1 provides summary statistics of federal crop insurance coverage for specialty crops for crop years 2015 through 2017. It provides total premium, premium subsidies, producer-paid premium, liabilities, indemnities (claim payments), and the number of policies earning premium.20 Premium subsidies across all commodities (not shown in the table) totaled $6.4 billion (63% of total premium), whereas premium subsidies for specialty crops totaled $701 million (64% of total specialty crop premium) in crop year 2017.21 Producer-paid premiums are the difference between total premium and premium subsidies.
|
|
2015 |
2016 |
2017 |
|
Total Premium ($ millions) |
$961 |
$1,104 |
$1,095 |
|
Premium Subsidies ($ millions) |
$616 |
$699 |
$701 |
|
Producer-Paid Premium ($ millions) |
$345 |
$405 |
$394 |
|
Liabilities ($ millions) |
$17,620 |
$19,642 |
$18,474 |
|
Indemnities ($ millions) |
$903 |
$802 |
$831 |
|
Policies Earning Premium |
60,429 |
60,490 |
59,186 |
Source: CRS, using RMA Summary of Business data.
Notes: Dollars are not adjusted for inflation. Selected crops based on the statutory definition for specialty crops (7 U.S.C. §1621 note).
Looking back to 1999, insurance policies then covered 52 specialty crops with planned testing on another nine, according to the Government Accountability Office (GAO).22 These 61 crops reportedly accounted for a majority of the overall value of specialty crops at that time, but coverage on about 300 additional crops remained unavailable. Coverage expansion for specialty crops continued over the subsequent decade. By 2011, insurance was available for more than 80 specialty crops in counties considered to be major growing areas. Among the crops included were avocados, blueberries, grapes, citrus, onions, pumpkins, and tomatoes.
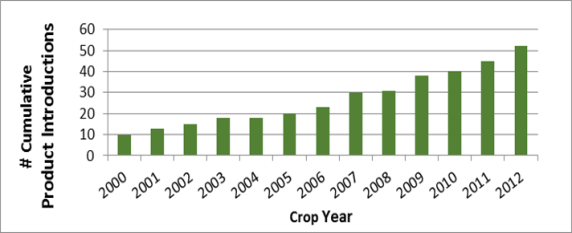
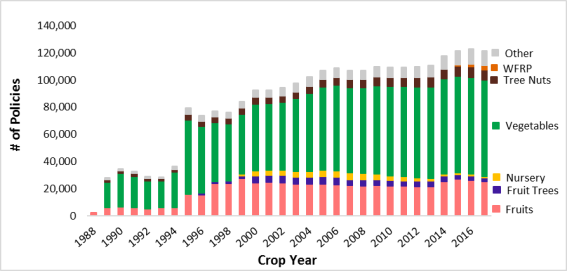
The cumulative new crop insurance product introductions for specialty crops increased from 10 in 2000 to 52 in 2012 (Figure 2).23 Figure 3 shows the number of specialty crop policies earning premium under the federal crop insurance program from crop years 2000 to 2017. While the number of specialty crop policies shows a general upward trend from 2000 to 2017, the total liability (amount insured) for specialty crops shows a more consistent upward trend during the same time period (Figure 4). A larger increase in liability than in the number of policies could be attributed to several factors, among them more high-value crop policies, increases in commodity prices, farm consolidation, and inflation.
Specialty Crops: Covered and Uncovered Crops
About 9 million acres of specialty crops, approximately 800,000 bee colonies, about 100,000 tons of raisins, and roughly 60,000 fruit and coffee trees were covered by federal crop insurance during crop year 2017. As of 2015, federal crop insurance policies were offered for 38 specialty crop categories (Table 2), which include roughly 80 types of fruits, vegetables, tree nuts, and nursery crops.24 In 1999, insurance policies covered about 50 types of specialty crops.25
|
Selected Crop |
FCIC Insured Acres |
Percent Eligible Acres Insured |
Liability ($) |
|
|
Total |
8,134,316 |
76% |
14,770,562,149 |
|
|
Almonds |
737,312 |
80% |
|
|
|
Apples |
239,144 |
74% |
|
|
|
Apricots |
6,373 |
62% |
|
|
|
Avocados |
37,022 |
62% |
|
|
|
Beans, fresh |
4,531 |
6% |
|
|
|
Blueberries |
68,830 |
61% |
|
|
|
Cabbage |
13,500 |
23% |
|
|
|
Cherries |
88,638 |
68% |
|
|
|
Chile peppers |
1,921 |
10% |
|
|
|
Citrus fruit |
662,812 |
87% |
|
|
|
Cranberries |
32,561 |
80% |
|
|
|
Cucumbers |
30,721 |
25% |
|
|
|
Dry beans |
1,383,209 |
78% |
|
|
|
Dry peas |
1,717,930 |
94% |
|
|
|
Figs |
4,103 |
64% |
|
|
|
Grapes/raisins |
584,881 |
64% |
|
|
|
Green peas |
138,512 |
76% |
|
|
|
Macadamia nuts |
11,948 |
75% |
|
|
|
Mint |
19,788 |
22% |
|
|
|
Nectarines |
15,279 |
72% |
|
|
|
Olives |
26,250 |
73% |
|
|
|
Onions |
102,890 |
71% |
|
|
|
Peaches |
68,033 |
68% |
|
|
|
Pears |
33,224 |
72% |
|
|
|
Pecans |
156,867 |
40% |
|
|
|
Peppers |
8,512 |
20% |
|
|
|
Pistachios |
105,268 |
45% |
|
|
|
Plums/prunes |
57,683 |
86% |
|
|
|
Potatoes |
843,023 |
79% |
|
|
|
Processing beans |
94,222 |
57% |
|
|
|
Pumpkins |
8,001 |
19% |
|
|
|
Strawberries |
1,378 |
2% |
|
|
|
Sweet corn |
251,904 |
49% |
|
|
|
Sweet potatoes |
6,738 |
5% |
|
|
|
Table grapes |
78,091 |
63% |
|
|
|
Tomatoes |
335,081 |
82% |
|
|
|
Tropical fruit |
4,569 |
42% |
|
|
|
Walnuts |
153,567 |
53% |
|
Source: CRS, using RMA Summary of Business data and NASS planted acres. Crop year 2015 represents the most complete set of acreage data for all the crop categories. Not included in total liabilities are nursery products, bee colonies, fruit/coffee trees, and tons of raisins—all of which measured in units other than acres.
 |
|
Source: CRS, using RMA Summary of Business data accessed during October 2018. Notes: "Other" consists of camelina, clary sage, coffee, coffee trees, mint, mustard, olives, and popcorn. Selected crops based on the statutory definition of specialty crops (7 U.S.C. §1621 note). Policies earning premium are policies that went into effect. WFRP refers to Whole Farm Revenue Protection policies, which insure a producer's entire farm revenue and thus may include specialty crops and non-specialty crops. RMA first offered WFRP policies in crop year 2015. Prior to that, RMA offered a similar policy known as Adjusted Gross Revenue (AGR) and AGR Lite. CRS could not locate data on AGR and AGR Lite policies on the RMA Summary of Business tool. |
Crops covered by individual federal crop insurance plans include almonds, apples, avocados, bananas, blueberries, cabbage, chili peppers, various citrus fruits, coffee, cranberries, cucumbers, dry beans, dry peas, figs, fresh market beans, fresh market sweet corn, fresh market tomatoes, grapes, green peas, macadamia nuts, mint, mustard, nursery, olives, onions, papaya, pears, pecans, peppers, pistachios, popcorn, potatoes, processing beans, pumpkins, raisins, policies on stone fruit (cherries, fresh apricots, fresh freestone peaches, fresh nectarines, peaches, plums, processing apricots, processing cling peaches, processing freestone peaches, prunes), strawberries, sweet corn, sweet potatoes, table grapes, tomatoes, other types of fruit and nut trees, and walnuts.26 Bee colonies are also covered.
Although the availability of federal crop insurance has been expanding, it is not available for all specialty crops. Crops without insurance for which the USDA's National Agricultural Statistics Service (NASS) reports planted acreage include artichokes, asparagus, blackberries, boysenberries, broccoli, cantaloupes, carrots (fresh and for processing), cauliflower, celery, dates, garlic, guavas, hazelnuts, honeydews, kiwi fruit, lettuce, spinach, squash, tart cherries, and watermelons. In addition, specialty crops for which NASS does not report planted acreage that do not have crop-specific policies include cashews, chives, dates, eggplants, garlic, hazelnuts, leeks, lettuce, melons, most leafy greens, most herbs and spices, some tropical plants, and most root crops.
Market Penetration
RMA reports that nearly 300 million acres were covered by federal crop insurance policies in crop year 2015.27 Of those acres, about 8.1 million acres (3%) were specialty crops (Table 2). For the 38 specialty crop categories for which federal crop insurance policies are measured by acreage (as opposed to bee colonies, tons, trees, or plant inventory value), the average participation rate in federal crop insurance was about 76% of eligible acres in crop year 2015.28
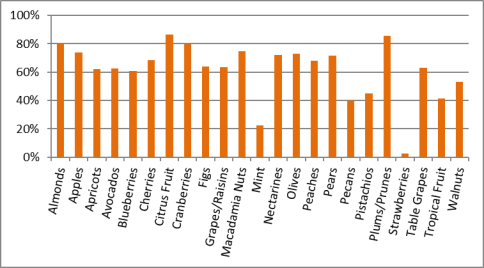
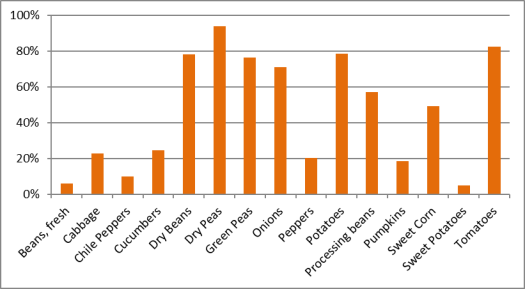
Figure 5 and Figure 6 show these data for selected fruit, tree nut, and vegetable categories. Market penetration often varies widely by crop. For fruits and tree nuts, the share of federally insured acres ranges from less than 1% (strawberries) to more than 80% (citrus and plums/prunes) (Figure 5). For vegetables and melons, insured acres range from 5% of total acres (fresh beans and sweet potatoes) to more than 80% (dry peas, tomatoes) (Figure 6).
Insured acreage as a share of crop acreage is relatively high (about 70% of total specialty crop area) in major specialty crop states, including California, Florida, and Washington.29 Acreage participation for pulse crops (e.g., dry peas, dry beans) is high in Minnesota, Montana, North Dakota, and South Dakota. The 2015 FCIC report to Congress on specialty crops contains detailed acreage data by crop and state, along with maps showing crop insurance participation.
 |
|
Source: CRS, using RMA Summary of Business data during October 2017. Data are for crop year 2015. Notes: Percentages reflect FCIC-insured acres as a share of total USDA-reported acres for that crop. |
 |
|
Source: CRS, using RMA Summary of Business data during October 2017. Data are for crop year 2015. Notes: Percentages reflect FCIC-insured acres as a share of total USDA-reported acres for that crop. |
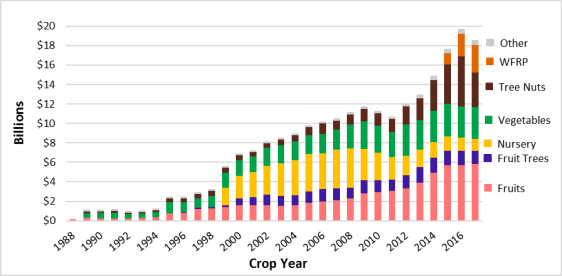
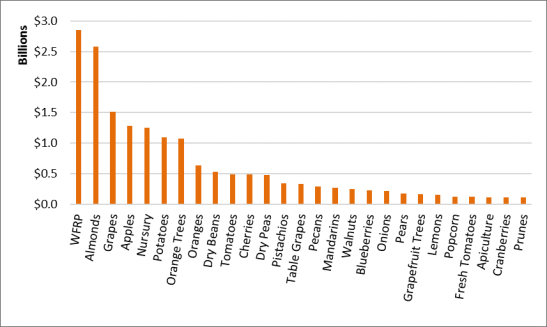
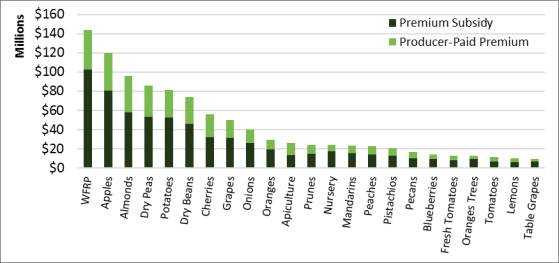
Figure 7 shows liabilities for specialty crops with the highest liabilities for crop year 2017. Figure 8 shows a breakdown of crop insurance premium subsidies and producer-paid premium by specialty crop in crop year 2017. That year, the average premium subsidy amount across all specialty crop policies and WFRP was 64%, about 1 percent higher than the average premium subsidy rate for the entire crop insurance portfolio.
Whole Farm Revenue Protection (WFRP) Insurance
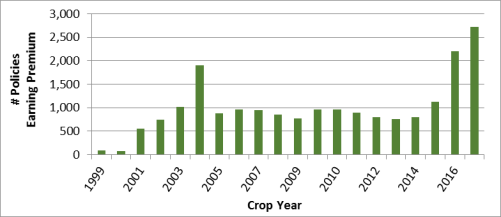
RMA provides a WFRP policy option to growers insuring 50% to 85% of revenue for all the commodities on a farm under one insurance policy. WFRP benefits farms with specialty or organic commodities that lack individual policy coverage, as well as those farms marketing to local, regional, farm-identity preserved, or direct markets. RMA estimates that 2,700 such policies received premium subsidies in 2017, up from 1,100 policies in 2015 (Figure 9). WFRP premium subsidies totaled about $102 million in 2017, and producer-paid premium amounted to about $42 million, while total liability was estimated at $2.8 billion, up from $1.1 billion in 2015.
The 2014 farm bill (P.L. 113-79) required that RMA provide a WFRP policy option to agricultural producers and authorized higher premium subsidy levels for whole-farm policies than for other policy types. The WFRP pilot policy was first offered in 2015. Prior to that, USDA offered similar policies under other names (in particular, Adjusted Gross Revenue or "AGR" policies from 1999 to 2002, and AGR and AGR Lite policies from 2003 to 2014). WFRP insures 50% to 85% of revenue for all commodities on a farm under one insurance policy, including (but not limited to) farms with specialty or organic commodities or those marketing to local, regional, farm-identity preserved, specialty, or direct markets.
 |
|
Source: CRS, using Risk Management Agency Summary of Business data accessed during October 2017. Notes: Data are not available to distinguish between policies for specialty crop growers from all U.S. agricultural producers. Available data reflect: Adjusted Gross Revenue (AGR) policies (1999-2002), AGR and AGR Lite policies (2003-2014), and WFRP policies (2015-2017). |
WFRP is available in all counties nationwide—either as a stand-alone policy or in combination with other policies—to farms with up to $10 million in insured revenue at the 85% coverage level and up to $17 million in insured revenue at the 50% coverage level.30 WFRP does not offer CAT-level coverage (high deductible, 100% premium subsidy) and cannot be combined with CAT-level policies. WFRP premium subsidies range from 55% to 80%, and coverage levels range from 50% to 85%. In crop year 2017, the average premium subsidy for WFRP was 70%, whereas the average premium subsidy across the entire crop insurance portfolio was 63%. That year WFRP policies accounted for 3% of all federal crop insurance liabilities.
WFRP requires producers to provide five consecutive years of Schedule F from their federal tax forms on which farm income and expenses are reported to determine their historical revenue guarantee. Some speculate that one of the reasons WFRP participation is not higher is that producers are reluctant to provide tax data.31
Select Policy Types Relevant to Specialty Crops
Federal crop insurance policies for specialty crops (and all other crops) are generally either yield-based or revenue-based. For most yield-based policies, a producer can receive an indemnity if there is a yield loss relative to the farmer's "normal" (historical) yield. Revenue-based policies protect against crop revenue loss resulting from declines in yield, price, or both.32
Yield-Based Insurance Policies
There are two types of yield-based insurance policies for specialty crops: (1) Actual Production History (APH) plans and (2) dollar plans. APH policies account for about 70% of specialty crops policies, with the exception of nursery crops, which tend to be mostly covered through dollar plans.33 Text Box 1 shows examples of an APH policy for citrus fruit with a 50% coverage level and a dollar plan for nursery products with a 65% coverage level.
Actual Production History (APH) Plans
APH policies insure producers against yield losses due to natural causes such as drought, excess precipitation, hail, frost, freeze, fire (if due to natural causes), and insects and disease. An indemnity is not paid if crop loss is caused by insufficient or improper applications of pest or disease control measures.34 The producer selects the amount of average yield to insure, ranging from 50% to 75% (in some areas up to 85%). The producer also selects the percent of the predicted price to insure, ranging between 55% and 100% of the crop price established annually by RMA. If the harvested crop plus any appraised production is less than the yield insured, the producer is paid an indemnity based on the difference. Indemnities are calculated by multiplying this difference by the insured percentage of the price selected when crop insurance was purchased and by the insured share (coverage level).
When purchasing an APH policy, a producer is assigned a "normal" crop yield based on the producer's actual production history and a price for the commodity based on estimated market conditions. The producer can then select a percentage of his normal yield to be insured and a percentage of the price he or she wishes to receive when crop losses exceed the selected loss threshold.35
Dollar Plans
Dollar plans provide protection against declining value due to damage that causes a yield shortfall. Unlike APH policies, a dollar policy guarantees a dollar amount of coverage and not a level of production, with the amount of insurance based on the cost of growing a crop in a specific area. A loss occurs when the annual crop value is less than the amount of insurance. The maximum dollar amount of insurance is stated on the actuarial document.36 The insured may select a percentage of the maximum dollar amount equal to CAT or higher coverage levels.
The design and implementation of dollar plan policies have been criticized for not insuring actual losses and for covering fraudulent claims. A 1997 USDA Office of the Inspector General audit report on fresh market tomato dollar plans outlined several specific fraud, waste, and abuse concerns.37 More recently, in December 2017 an RMA-commissioned report on options for improving or replacing dollar plans concluded that the dollar plan as studied (limited area and three crops) "is not sustainable."38
|
Text Box 1: Actual Production History (APH) and Dollar Plan APH Policy for Citrus Fruit: 50% Coverage Level A claim can be filed whenever production falls short of the guarantee selected by the insured. The indemnity is determined by multiplying the production shortfall by the pre-selected price. The following example uses an APH yield of 600 cartons per acre, 50% coverage level, and a selected price of $5.55 per carton. 600 cartons per acre average yield (APH yield) x 0.50 selected coverage level percentage 300 cartons per acre guarantee - 200 cartons per acre actually produced 100 cartons per acre loss x $5.55 price election $555 gross indemnity per acre Source: USDA Fact sheet, "Citrus–Actual Production History," June 2012. Dollar Plan for Nursery: 65% Coverage Level The dollar plan provides protection against a decline in value due to damage that causes a yield shortfall. The following example uses a plant inventory value of $100,000 and a 65% coverage level. $100,000 plant inventory value x 0.65 selected coverage level percentage $65,000 unit amount of insurance In the event of a loss: $100,000 field market value before loss -$50,000 field market value after loss $50,000 value of loss -$35,000 deductible (1.0 - coverage level) X inventory = (1 - 0.65) X $100,000 = $35,000 $15,000 indemnity Source: USDA, "Nursery Commodity Insurance," February 2018. |
Revenue-Based Insurance
Revenue insurance is widely available for major program crops (e.g., wheat, corn, soybeans) and protects growers against losses from low yields, low prices, low quality, or any combination of these events. For specialty crops, designing revenue-based insurance products is challenging. These crops often do not have centralized price discovery mechanism such as a futures exchange for developing price projections prior to planting. They also often lack data on actual harvest-time prices.
To address these types of data challenges, actual revenue history (ARH) insurance plans have been implemented on a pilot basis for certain specialty crops such as navel oranges and cherries. Rather than insuring historical yields, these pilot policies insure historical revenues using historical prices. This approach assumes that historical prices provide a reasonable estimate of expected future prices. This assumption is deemed viable for perishable crops, such as most fruit and vegetables, but is considered less tenable with storable crops where stock carryover from the previous year can affect current market-year prices.39 ARH insurance plans have parallels to the APH insurance plans, with the primary difference being that instead of insuring historical yields, the plan insures historical revenues.40 Text Box 2 shows an example of an ARH policy for California navel oranges.
|
Text Box 2: Actual Revenue History (ARH) for California Navel Oranges ARH protects against losses from low yields, low prices, low quality, or any combination of these events. Coverage is based on the farmer's own net revenue history and the farmer's choice of coverage level and payment factor (which affects the premium cost and potential indemnity). The crop's revenue is determined after harvest at the point of first delivery. Insurance Terms: $3,200 per acre approved revenue x 0.75 selected coverage level percentage x 1.0 selected payment factor (ranges from 0.67 to 1.0; affects the premium cost to producer) $2,400 per acre amount of insurance Actual Revenue: 400 cartons x 5.00 per carton net price $2,000 per acre revenue to count Indemnity: $2,400 per acre amount of insurance -$2,000 per acre revenue to count (actual revenue) $400 difference x 1.0 payment factor $400 indemnity per acre Source: USDA Fact Sheet, "Actual Revenue History-Navels," March 2012. |
Designed as a catch-all for a variety of crops that may not have individual revenue insurance plans, WFRP policies insure 50%-85% of revenue for all commodities on a farm under one policy. For more information on WFRP, see "Whole Farm Revenue Protection (WFRP) Insurance."
Index-Based Policies
RMA offers a few index-based policies, which trigger claim payments based on a predetermined index that is entirely independent of the individual farm operation (e.g., rainfall level). Indemnities are automatically triggered whenever the index falls below a producer-selected coverage level instead of requiring insureds to file claims.41 One of those policies covers a specialty crop—the Apiculture Pilot Insurance Program (API), which covers honey production. Text Box 3 provides detailed information on producers' choices under API.
|
Text Box 3: Apiculture Rainfall Index Policy API provides a safety net for beekeepers' primary income source—honey, pollen collection, wax, and breeding stock—based on a rainfall index. Apiculture systems consist of different types of plants or crops and often contain mixtures of different species, each with different growth habits and seasons, precipitation requirements, and other climate conditions necessary to maintain plant growth over extended periods of time. API was designed to provide maximum flexibility to cover these diverse situations. The Rainfall Index uses National Oceanic and Atmospheric Administration Climate Prediction Center data, which uses a grid system to evaluate the geographic location of specific index values. Each grid is 0.25 degrees in latitude by 0.25 degrees in longitude, which translates to approximately 17 by 17 miles at the equator. Colonies will be assigned to one or more grids based on the location to be insured. Availability API is available in the 48 contiguous states with the exception of grids that cross international borders. Coverage and Claims Coverage is based on producers' selection of coverage level, index intervals, and productivity factors. The index interval represents a two-month period, and the period producers select should be the one when precipitation is most important to their operations. Coverage levels vary from 70% to 90% of the maximum dollar amount of protection offered (total liability) for a producer's colonies. In other words, the policy requires a deductible ranging from 10% to 30%. Producers select a productivity factor to match the amount of protection to the value of the production that best represents their operations and the productive capacity of their colonies. They do not have to insure all of their colonies. However, they cannot insure more than the total number of colonies they own. By selecting a productivity factor, producers can establish a value between 60% and 150% of the county base value, which is based on honey production and uses a five-year rolling average of NASS data. The yield data are based on the NASS state average, and the price is the national average honey price for a given year. Producers' insurance payments are determined by using Climate Prediction Center data for the grid(s) and index interval(s) they have chosen to insure. When the final grid index falls below their "trigger grid index," they may receive an indemnity. This insurance coverage is for a single peril: lack of precipitation. Coverage is based on the experience of the entire grid. It is not based on an individual farm or ranch or specific weather stations in the general area. Tools Producers are asked to make several choices when insuring production from their colonies, including coverage level, index intervals, productivity factor, and number of colonies. Producers may work with their crop insurance agents to view the Grid ID Locator map and index grids for their area. Source: RMA Fact Sheet, "Apiculture Pilot Insurance Program—Honey, Pollen Collection, Beeswax, Breeding Stock," https://legacy.rma.usda.gov/pubs/rme/apiculture.pdf. |
Development of New Policies and Section 508(h)
The Federal Crop Insurance Act provides two methods for developing new crop insurance programs, including (1) internal products developed by RMA or under contract and (2) external products submitted through procedures specified in Section 508(h) of the Federal Crop Insurance Act (7 U.S.C. §1508(h)).
RMA-Developed Products
Section 522 of the Federal Crop Insurance Act (7 U.S.C. §1522) grants RMA authority to develop new crop insurance policies. This authority was partially removed in 2000 but later reinstated by the 2014 farm bill (P.L. 113-79). Before the enactment of Agricultural Risk Protection Act of 2000 (ARPA, P.L. 106-224), products were typically developed internally.42 ARPA added paragraph (e)(4) to Section 522, which stated, "on and after October 1, 2000, the Corporation shall not conduct research and development for any new policy for an agricultural commodity offered under this subchapter." The 2014 farm bill repealed paragraph (e)(4).
Private Sector Developed Products
ARPA expanded the role of the private sector, allowing private entities to participate in conducting research and development of new insurance products and features. With the expansion of the contracting and partnering authority, Congress authorized RMA to enter into contracts or to create partnerships for research and development of new and innovative insurance products. Private entities could also submit unsolicited proposals for insurance products to the FCIC Board of Directors for approval. In considering such proposals, the board is to evaluate whether the products (1) are in the best interests of producers, (2) follow sound insurance principles, and (3) are actuarially appropriate.43
Section 508(h) governs new crop insurance policy development, including how it is contracted out and funded, how policy ratings are undertaken, and how a policy may start as a pilot and may (or may not) evolve to a full-fledged insurance policy. FCIC is authorized to reimburse private entities for research, development, and maintenance costs if they develop insurance programs that are approved by the FCIC board.44
Private sector individuals may submit to the FCIC board (1) crop insurance policies, (2) provisions of policies, or (3) rates of premium. These submissions are commonly referred to as 508(h) submissions. If a private individual prefers, a concept proposal can be submitted to the board prior to fully developing a 508(h) submission. The board may approve an advance payment for the concept proposal for up to 75% of expected research and development expenses to aid in the development of the 508(h) submission.45
If approved by the board, these insurance products can receive reimbursement for research, development and operating costs, in addition to any approved premium subsidies and reinsurance. Private submitters are eligible to recoup maintenance costs for up to three years after products are offered on the market if they continue to provide support for the products.46 After three years, the private entity has the choice of turning the product over to RMA, thereby relinquishing all ownership rights in the product, or retaining ownership of the insurance product and continuing to update it in return for a user fee as approved by the board and paid by Approved Insurance Providers who sell the product.47
Pilot Status of New Products
The FCIC board must approve all new products. This process can take up to a year and generally depends on the quality and thoroughness of the submission package presented to the board, as well as the responsiveness of the submitter to issues raised by the board and the reviewers, among other factors. In most cases, an independent external panel of experts reviews a proposed product and assesses its actuarial weakness and suggests product improvements. The revised product is submitted to the FCIC board for approval. Once approved, the product is typically implemented as a pilot program in a limited area to test it for effectiveness while limiting financial exposure.
Pilot programs typically operate for four years but may be extended for additional testing if needed.48 Eventually the FCIC board either converts the pilot to a regular program or terminates it. Under law, RMA is not allowed to conduct pilot programs if insurance against the risk to be covered is generally available in the private sector without governmental support.
RMA's 2010 Report to Congress describes selected pilot programs that have been developed through the internal procedure and authority, covering quarantine and policies based on actual revenue history (e.g., rather than yields).49 It also describes a range of private sector initiatives covering pumpkins, apiculture, plantains and bananas, sugarcane, and fresh market beans.
Challenges with Developing Specialty Crop Policies
Even though new crop insurance product introductions for specialty crops have been increasing, USDA and the industry continue to face a number of challenges when developing and making available new insurance policies for specialty crops that are not currently covered. Most challenges stem from the basic structure of the specialty crop industry, which is often characterized by relatively small acreages, multiple crop varieties (often targeting niche markets), differences in farming practices (which contribute to greater complexity and cost), quality and price discovery issues, grower interest, non-weather risks, and other coverage limitations.50 Factors such as these affect the potential marketability, actuarial soundness, and feasibility of an insurance policy.
A small market reduces sales incentive for companies selling insurance while contributing to higher per-unit costs for developing the product, training staff, modifying computer programs, and other activities. Small acreage also results in low market volume or the establishment of production contracts between producers and buyers. Crops grown and marketed in smaller quantities and/or targeting niche markets often command a price premium, resulting in often highly variable market prices, further complicating price discovery. Moreover, most specialty crops are intended primarily for sale in the higher-value fresh market versus the typically lower-value crops sold for further processing. Fresh product is highly perishable and non-storable, unlike the field crops that are more widely covered by federal crop insurance policies.
In general, lack of reliable pricing data for crops not traded on commodity exchanges has been an ongoing challenge for USDA in the federal crop insurance program.51 RMA's price discovery for specialty crops largely relies on Agricultural Marketing Service, NASS, and other USDA agency data and academic and industry sources.52 In the absence of a well-developed cash market, such "thin market" conditions make it difficult to observe and forecast market prices. For example, in 2015 FCIC cancelled the Dry Bean Revenue Endorsement because USDA did not have sufficient market data from processors to establish a harvest price from which to calculate whether indemnities would be triggered under the endorsement.53
Setting price guarantees correctly is critical for encouraging participation, the actuarial soundness of the program, and maintaining the overall market dynamics for the crop. If the insurance is priced (rated) too high, producers who tend to have few losses might decide against purchasing insurance, leaving only high-risk farmers in the pool (known as "adverse selection"). If the insurance is priced too low, premiums may not cover expected indemnities, potentially inflating the federal cost of the program by providing a greater premium and higher administrative and operating subsidies than was intended. Artificially low premiums might encourage additional crop production, further contributing to weak market prices, thereby adversely affecting financial returns for producers.
Another challenge for insuring specialty crops is the diversity and multitude of crop varieties and production practices. Compared with field crops, specialty crops tend to have a wider variety of farming practices that depend on the crop variety, adding complexity to the policy and its development cost. For example, a vegetable crop may need to be grown on raised beds, use plastic, or have specific crop rotations. Various marketing claims made for products (such as that they are organic or other production or sustainability claims) can contribute to product complexity. Understanding how these factors affect potential yields is required for determining what practices can be insured and for developing and establishing underwriting standards. Variation across crops and variety within crop types also complicate the loss adjustment process (i.e., assessing the effect of weather on crop production).
Finally, in some cases, USDA has reportedly not pursued policies for particular commodities because some producers have expressed concerns that offering insurance could adversely affect the market (i.e., because an insurance policy reduces producer risk, farmers may plant more acreage, which could drive down prices and total crop revenue). This has been a particular concern for producers of vegetable crops and explains in part lower levels of insured vegetable crop acreage compared with other crops.54
Producer interest in the availability of a new policy often starts at the local level and is channeled through RMA's regional offices. In general, for a policy to be viable, a crop must have established cultivars, defined farming practices, developed markets, and identified known perils. Significant producer interest (demand for the policy) is also critical. Perhaps more importantly, insurance policies are dependent on the availability of high quality data. High quality data, from an insurance standpoint, refers to data being timely (so that claims can be paid quickly), relevant (so the product offers reliable protection), audited to international reinsurance standards, and available over a sufficiently long time horizon (time series).55 Data availability and data quality often pose a challenge for crop insurance purposes.
Alternatives to Crop Insurance
USDA offers several programs to help farmers recover financially from natural disasters, including droughts and floods. These programs help to provide assistance to producers of noninsured crops or crops with no current individual policy coverage, including some specialty crops. Other supplemental disaster programs further provide assistance to some specialty crop producers from tree losses and the loss of bee colonies. USDA also provides low-interest emergency loans and land rehabilitation assistance to help farmers return land to production following natural disasters.56
Considerations for Congress
Among the issues that may arise if Congress continues to consider the role of the federal crop insurance options for specialty crop producers are:
- Availability of crop-specific policies. Crop-specific policies have not been developed for a number of specialty crops, including artichokes, asparagus, blackberries, boysenberries, broccoli, cantaloupes, carrots (fresh and for processing), cashews, cauliflower, chives, celery, dates, eggplants, garlic, guavas, hazelnuts, honeydews, kiwi fruit, lettuce, spinach, squash, tart cherries, watermelons, most leafy greens, most herbs and spices, some tropical plants, and most root crops. Private submitters proposing to develop new policies must present evidence of marketability to FCIC and RMA.57 Congress might consider whether there are opportunities for USDA to facilitate market research and publish market data to assist with the development of new policies and spur greater competition among private submitters.
- Development cost benchmarks. Section 11120 of P.L. 115-334 modifies the definition of reasonable research and development costs related to policies that have been approved by the FCIC board for reimbursement.58 Costs are to be deemed reasonable if based on (1) for employees or contractors, wage rates equal to not more than two times the Bureau of Labor Statistics hourly wage rates, plus benefits; and (2) other actual documented costs incurred by the applicant. That section also limits the FCIC board's review of user fees. Given that Congress reinstated RMA's authority to develop new products in the 2014 farm bill (P.L. 113-79), Congress might inquire whether costs incurred for RMA-developed policies could provide a benchmark for the reasonableness of private sector requests for reimbursement of development costs.
- Limited participation in WFRP policies. WFRP is available in every county of every state. Its premium subsidies range from 55% to 80%, and coverage levels range from 50% to 85%. In crop year 2017 the average premium subsidy for WFRP was 70%, whereas the average premium subsidy across the entire crop insurance portfolio was 63%. That year WFRP policies accounted for about 3% of all federal crop insurance liabilities. Some speculate that part of the reason that WFRP participation is not higher is that producers are reluctant to provide tax return data.59 These policies require producers to provide five consecutive years of Schedule F from their federal tax forms. Given the benefits of risk pooling achieved by insuring a whole farm's revenue and the fraud prevention benefits from requiring tax returns to set historical revenue guarantees, Congress might consider whether there are efficiencies to be gained from incentivizing greater participation in WFRP.
- Determining a "market price" for commodities not sold on exchanges. Lack of reliable pricing data for crops that are not traded on commodity exchanges has been an ongoing challenge for USDA in the federal crop insurance program. RMA's price discovery for specialty crops largely relies on Agricultural Marketing Service, NASS, and other USDA agency data and academic and industry sources. In the absence of a well-developed cash market, such "thin market" conditions make it difficult to observe and forecast market prices, which affects RMA's ability to set the appropriate level of price guarantees. Setting price guarantees correctly is critical to the actuarial soundness of the program and for maintaining overall market dynamics for the crop. Increased farm-level price data for commodities not sold on exchanges could also assist producers of those commodities in negotiating contracts and in their financial planning. Congress might consider whether there is a role for the federal government in supporting data collection of farm prices of commodities that are not sold on exchanges.
- Coverage of quality losses. Many crops are vulnerable to lower prices or to becoming unmarketable due to quality losses. Small markets for specialty crops that are not sold on commodity exchanges may be particularly price-sensitive to variations in quality (e.g., herbs and spices, certain fruits and vegetables, honey). Certain federal crop insurance policies cover some quality losses, but the range of such coverage is limited. Congress might consider (1) whether the current coverage for quality losses is available for all crops that are vulnerable to quality losses, (2) whether loss adjustment procedures for quality losses accurately assess the variations in quality and the effects on marketability and prices, and (3) whether the procedures for assessing quality losses properly balance cost efficiency and fraud prevention.
- Effect of ad hoc payments on demand for crop insurance. One of the stated policy goals of federal crop insurance has been to reduce the agricultural sector's reliance on supplemental or "ad hoc" disaster assistance payments.60 However, according to the Congressional Budget Office, it is difficult to assess whether this policy goal has been achieved.61 The 115th Congress authorized ad hoc disaster assistance, and USDA has separately implemented a "trade aid" package, both of which apply to some specialty crops.62 Given the lower participation levels for certain specialty crop insurance policies as compared to non-specialty crops, Congress might consider whether repeated ad hoc payments in response to adverse events may have an effect on demand for federal crop insurance for crops generally and for specialty crops in particular.