Overview
Since its inception in 1938, the federal crop insurance program has expanded from an ancillary program with low participation to a central pillar of federal support for agriculture. In 2015, the program provided over $102.5 billion of insurance protection (liability) for over 100 crops (excluding hay, livestock, nursery, pasture, rangeland, and forage) on about 238 million acres, or 86% of eligible acres. Policy offerings and participation were smaller for the livestock sector—$1.3 billion in liability on less than 3% of total eligible livestock inventory.1
From 2007 to 2016, the federal crop insurance title had the second-largest outlays in the farm bill after nutrition. Total government spending on the federal crop insurance program from crop years 2007 to 2016 ($72.1 billion) can be separated into four categories:
- 1. Direct benefit to producers (indemnities2 minus producer-paid premium), $43.2 billion (60%);
- 2. Delivery3 subsidies paid to Approved Insurance Providers (AIPs), $14.8 billion (20%);
- 3. Net underwriting gains4 to AIPs, $13.4 billion (19%); and
- 4. U.S. Department of Agriculture (USDA) Risk Management Agency (RMA) appropriations, $754 million (1%).5
This report focuses entirely on the second federal spending category—delivery subsides. Program "delivery" generally refers to selling and servicing policies. Delivery subsidies are not based on actual delivery expenses. Instead, they are calculated as a percentage of premium based on a mutually negotiated rate agreed to by AIPs and the Federal Crop Insurance Corporation (FCIC).
This report explains how delivery subsidies are calculated, the limitations of publicly available data on the actual delivery expenses of AIPs, and how AIPs spend delivery subsidies. The other federal crop insurance spending categories—direct benefits to producers, net underwriting gains and losses, and RMA appropriations—are broadly discussed in CRS Report R45193, Federal Crop Insurance: Program Overview for the 115th Congress.
Background
Since 1980, federal crop insurance has operated through a shared public-private arrangement funded by taxpayers and producers. Three principal entities operate the program:
- 1. Private insurance companies, known as AIPs, which are the primary insurers selling and servicing the insurance policies;
- 2. FCIC, which reinsures the policies and subsidizes the delivery expenses of AIPs; and
- 3. RMA, which determines policy terms, sets premium rates, and regulates AIPs.
The terms of the financial arrangement between FCIC and AIPs are set out in a mutually negotiated Standard Reinsurance Agreement (SRA). Each AIP signs an SRA with FCIC annually.
Prior to 1980, USDA was wholly responsible for "delivering" policies (selling and servicing) and retaining underwriting gains and losses. The Federal Crop Insurance Act of 1980 (7 U.S.C. §§1501 et seq., P.L. 96-365) created the public-private partnership with AIPs, which brought AIPs into product delivery and risk-sharing with FCIC. FCIC started paying subsidies to AIPs for delivering policies. AIPs also started sharing in underwriting gains and losses with FCIC.6
Calculation of Delivery Subsidies
FCIC subsidizes AIPs' delivery costs for the two main levels of insurance coverage—catastrophic (CAT) and buy-up coverage:
- 1. Catastrophic Loss Adjustment Expense subsidy (CAT LAE) is for policies with CAT coverage (higher deductible);7 and
- 2. Administrative and Operating subsidy (A&O) is for policies with buy-up coverage (lower deductible).8
FCIC does not reimburse AIPs for their actual delivery expenses. A&O and CAT LAE are calculated as a percentage of premium but are not taken from total premium. They are paid as a separate government subsidy to AIPs. The SRA sets their amounts as follows:9
- A&O: for delivery of buy-up coverage (lower deductibles), equals between 12% and 21.9% of premium, depending on policy type.
- CAT LAE: for delivery of catastrophic level coverage (higher deductibles), is fixed at 6% of premium.10
A&O Cup and Cap
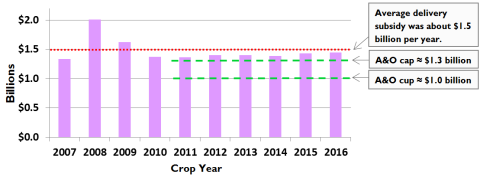
The 2011 SRA and subsequent SRAs established a minimum (cup) of approximately $1.0 billion and a maximum (cap) of approximately $1.3 billion per year for A&O subsidies—subject to an adjustment for inflation from 2011 to 2015—to help stabilize A&O amounts. Previously, A&O payments fluctuated widely based on crop values.11 However, it is unclear how this $1.0 billion to $1.3 billion value, adjusted for inflation, relates to actual delivery expenses incurred by AIPs.
Although the A&O cup and the cap are finite amounts, they are described as formulas in the 2011 and subsequent SRAs.12 The formulas use the following defined terms:
- Average A&O rate: (for all eligible crop insurance contracts for the 2008 reinsurance year) the total A&O subsidy paid to all AIPs divided by total net book premium earned by all AIPs for insurance contracts for which A&O subsidy was paid by FCIC as of the January 2010 monthly settlement report.
- Earned premium rate: the total net book premium earned by all AIPs for the 2008 reinsurance year on all eligible crop insurance contracts for which A&O subsidy was paid by FCIC divided by total liability as of the January 2010 monthly settlement report.
- Total liability: the amount of liability for all eligible crop insurance contracts written by all AIPs for the 2008 reinsurance year for which A&O subsidy was paid by FCIC as of the January 2010 monthly settlement report.13
|
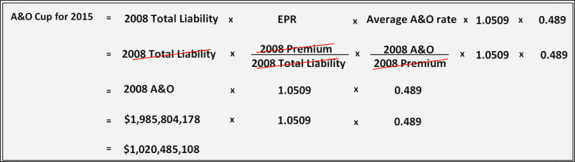
Figure 1. Federal Crop Insurance A&O Cup
(2015 and subsequent reinsurance years)
|
 |
|
Source: CRS using 2015-2019 Standard Reinsurance Agreements (SRAs).
Notes: Several of the terms in the A&O Cup formula cancel out as indicated by the red cross-out lines in the second row. To calculate the A&O cup, one input is needed—the A&O paid by FCIC for the 2008 reinsurance year as of the January 2010 monthly settlement report ("2008 A&O"). CRS could not locate this number in the SRAs or in RMA's reporting of program costs on its website. In response to a specific inquiry, RMA provided to CRS the amount for 2008 A&O at $1,985,804,178. The inflation and cup multipliers above are set in Section III (a)(2)(H) of the 2015 SRA and subsequent SRAs. EPR is the earned premium rate defined in Section I of the SRA.
|
Formula for A&O Cup
The 2015 and subsequent SRAs sets the cup for A&O at $1,020,485,108 using the formula in Figure 1 and the above definitions, as calculated by CRS.14
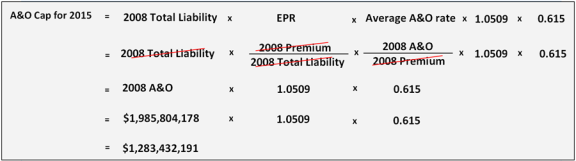
Formula for A&O Cap
The 2015 SRA and subsequent SRAs sets the cap for the A&O subsidy at $1,283,432,191, as calculated by CRS using the formula in Figure 2 and the above definitions.15
|
Figure 2. Federal Crop Insurance A&O Cap
(2015 and subsequent reinsurance years)
|
 |
|
Source: CRS using 2015-2019 Standard Reinsurance Agreements.
Notes: Several of the terms in the A&O cup formula cancel out as indicated by the red cross-out lines in the second row. To calculate the A&O cap, the same single input—2008 A&O—is needed. CRS could not locate this number in the SRAs or in RMA's reporting of program costs on its website. In response to a specific inquiry, RMA provided to CRS the amount for 2008 A&O at $1,985,804,178. The inflation and cup multipliers above are set in Section III (a)(2)(G) of the 2015 SRA and subsequent SRAs.
|
Inflation Adjustment
The inflation multiplier of 1.0509 used in the cup and cap formulas in Figure 1 and Figure 2 is different in the 2011, 2012, 2013, 2014, and 2015 SRAs. Since 2015, all SRAs have had the same multiplier—1.0509 (Table 1). These multipliers, which started in 2011 and ended in 2015, have had the effect of making an inflationary adjustment. The inflationary adjustment is made on the base year 2011, which had an inflation multiplier of 1.0.
From reinsurance year 2011 to reinsurance year 2015, the cup increased by $49,426,865 and the cap increased by $62,162,622. Despite the increase in potential delivery-subsidy outlays represented by the cup and the cap inflation adjustment, future inflationary adjustments are not mentioned in the 2011 SRA or in any subsequent SRA. Instead, an RMA Manager's Bulletin from June 30, 2010, on the "2011 Standard Reinsurance Agreement"16 mentions an enclosure that outlines the changes to the inflation multipliers to the A&O cup and cap for reinsurance years 2012-2015.17 For each year where an inflation multiplier was changed, RMA published an Informational Memorandum announcing the changes.18
Table 1 provides the inflation multipliers for the A&O cup and cap for reinsurance years 2011-2018.
Table 1. A&O Cup and Cap Inflation Multipliers for Reinsurance Years 2011-2018
|
Reinsurance Year
|
Inflation Multiplier
|
Cup
|
Cap
|
|
2011
|
1.0000
|
$971,058,243
|
$1,221,269,569
|
|
2012
|
1.0140
|
$984,653,058
|
$1,238,367,343
|
|
2013
|
1.0262
|
$996,499,969
|
$1,253,266,832
|
|
2014
|
1.0375
|
$1,007,472,927
|
$1,267,067,178
|
|
2015
|
1.0509
|
$1,020,485,108
|
$1,283,432,191
|
|
2016
|
1.0509
|
$1,020,485,108
|
$1,283,432,191
|
|
2017
|
1.0509
|
$1,020,485,108
|
$1,283,432,191
|
|
2018
|
1.0509
|
$1,020,485,108
|
$1,283,432,191
|
Source: CRS using Risk Management Agency data and the Standard Reinsurance Agreement (SRA).
Notes: The inflation multipliers are from the respective year's SRA at https://www.rma.usda.gov/pubs/ra/. The cup and cap amounts were calculated by inputting the inflation multipliers and the 2008 A&O amount ($1,985,804,178) that RMA provided to CRS into the formulas in Figure 1 and Figure 2.
Exclusions from A&O Cup and Cap
CAT LAE, SnapBack,19 and some policies are excluded from the A&O cup and cap (Table 2).20
Table 2. A&O Cup and Cap Coverage
(2011 and Subsequent Reinsurance Years)
|
Description
|
% of Premium
|
|
Included in the Cup and Cap
|
|
Revenue Policies
|
18.5
|
|
APH Policies
|
21.9
|
|
Excluded from the Cup and Cap
|
|
CAT LAE
|
6.0
|
|
Area Plans
|
12.0
|
|
Area Plans—not widely available as of 2008
|
20.1
|
|
New Revenue Policies
|
18.5
|
|
New APH Policies
|
21.9
|
|
SnapBack
|
additional 1.15
|
Source: CRS using the 2011 Standard Reinsurance Agreement (SRA) and subsequent SRAs.
Notes: Area plans cover area losses, usually at the county level. The SRA does not define widely available in the context of area policies. New revenue and actual production history (APH) policies are defined in the SRA as revenue and APH policies for an agricultural commodity in a county for which FCIC did not establish premium rates in the actuarial data master file for the 2010 reinsurance year. SnapBack is a bonus percentage of A&O that AIPs receive for certain policy types for operating in states with a loss ratio greater than 1.2.
Delivery Subsidy Outlays
From 2007 to 2016, annual delivery subsidies (A&O and CAT LAE combined) averaged about $1.5 billion and represented about 15% of total premium (Figure 3). Since the A&O cup and cap first went into effect in 2011, the total amount spent on delivery subsidies (A&O and CAT LAE combined) has exceeded the A&O cap every year (Figure 3), reflecting policies, coverages, and SnapBack that are not subject to the A&O cup and cap (Table 2).
|
Figure 3. Delivery Subsidies in the Federal Crop Insurance Program
(A&O and CAT LAE)
|
 |
|
Source: Compiled by CRS using RMA Crop Year Government Cost of Crop Insurance 2007-2016.
Notes: A&O is Administrative and Operating subsidy. CAT LAE is Catastrophic Loss Adjustment Expense.
|
AIP Use of Delivery Subsides—Agent Commissions
RMA sets premium rates for federal crop insurance policies and does not allow AIPs to compete on price (premium). All AIPs are directed to charge the same amount of premium for the same policy to the same farmer. Lack of price competition generated concerns among some observers around two issues in particular: (1) AIPs potentially paying excessive compensation to agents to grow their portfolios and (2) AIPs and agents potentially engaging in rebating mechanisms and other devices to indirectly compete on price. Although RMA has addressed both issues through regulations and guidance, some observers assert that these issues seem to be ongoing challenges.21
The largest single delivery expense reported by AIPs is compensation to crop insurance agents.22 Crop insurance agents are largely independent agents who sell policies for multiple AIPs. Because RMA determines premium rates, AIPs cannot compete for business based on the price of a policy. Instead they tend to compete by establishing relationships with agents and by providing superior customer service. Thus, it is generally in an AIP's interest to hire successful agents. This has made for a competitive market for federal crop insurance agents.
Since 2011, the SRA has set limits on the amount AIPs are allowed to pay agents.23 Specifically, AIPs may not pay more than 80% of A&O and CAT LAE by state as base commission to agents.24 However, an AIP may pay compensation up to 100% of A&O and CAT LAE by state if certain conditions are met.25 There is no limitation on how much any given agent may receive so long as it is within the maximum amount allowable per state.26 Conceivably, an AIP could pay one agent 80% of the A&O it received in a particular state so long as it did not pay commissions to any other agent.
AIP Reporting of Actual Expenses
Limited data is available on the actual expenses of AIPs. RMA requires AIPs to report actual expenses, but RMA does not publish the reported expense data.27
CRS is aware of three publicly available sources for information on AIP expenses: (1) annual statements from state departments of insurance, (2) Form 10-K and other reports submitted to the U.S. Securities and Exchange Commission (SEC) by AIPs that are owned by publicly traded companies, and (3) AIP survey data used in studies sponsored by the crop insurance industry.
Annual Statements Submitted to State Departments of Insurance
State departments of insurance require AIPs that sell state-regulated insurance products to provide detailed expense data on all lines of insurance, including federal crop insurance,28 in annual financial statements. Unlike RMA, state departments of insurance use calendar years rather than crop or reinsurance years. State department of insurance annual statements largely follow the same format but may vary slightly across states.
SEC Form 10-K Reports
The Form 10-K annual report and other reports submitted to the SEC provide comprehensive data on the business and financial conditions of publicly traded companies. Some of these reports include audited financial statements. AIPs that are publicly traded or owned by publicly traded companies submit financial data, including data on actual expenses, to the SEC. These reports are publicly available through EDGAR, the SEC's online database.29
Industry-Commissioned Studies
National Crop Insurance Services (NCIS), a crop insurance industry group, maintains that A&O and CAT LAE do not cover all AIP delivery expenses. In recent years NCIS has contracted with the consulting firm Grant Thornton for an annual report on the crop insurance industry's profitability and effectiveness.30
The most recent Grant Thornton report on the NCIS website31 is the 2016 update for reinsurance year 2015, which broadly states that it uses "governmental and company information" as its sources.32 The 2013 update for the 2012 reinsurance year report provides more specific source information—namely public RMA reports33 and "a survey by NCIS of its member companies," which included all the AIPs in the program at the time.34 Grant Thornton notes that its "services were provided in accordance with the Statement on Standards for Consulting Services promulgated by the American Institute of Certified Public Accountants and, accordingly, do not constitute the compilation, review or audit of any information."35 The consulting firm also reserves the right to update its analysis as it obtains additional information.36
From 1998 to 2015, Grant Thornton reported that AIPs spent more in expenses than they received in A&O.37 The reported "A&O Expense Deficit" is the amount by which expenses exceeded A&O.
Policy Issues
Delivery subsidies accounted for $14.8 billion (20%) of government spending on the federal crop insurance program during the crop years 2007-2016. The amount of these subsidies is based not on actual expenses incurred by AIPs but on percentages of premium set in the SRA that vary by policy type and coverage level. Given the importance of federal crop insurance to agricultural producers—and the level of federal subsidy involved in delivering policies—Congress may consider whether the current formula-based delivery subsidy is the most appropriate method to compensate AIPs for delivery costs and whether it is optimally allocated for stakeholders, including producers, AIPs, and taxpayers.
A potential difficulty in assessing the current method of subsidizing delivery expenses is the absence of comprehensive and publicly available data on the actual delivery expenses incurred by AIPs. Such data would appear to be a prerequisite for further analysis of the efficacy and efficiency of delivery subsidies in the federal crop insurance program. The available data on actual delivery expenses is not easily matched with A&O delivery subsidies and leaves unanswered the question of whether current subsidies are deficient, sufficient, or excessive.
Although AIPs are required to report actual expenses to RMA and state departments of insurance, RMA does not publish data on AIP expenses. Other available sources of this data are incomplete across participating AIPs, are not based on crop or reinsurance years, or arise from industry surveys. Congress could consider whether requiring that AIPs certify reported actual expenses to RMA—or requiring such submissions to be independently audited—would improve program transparency and efficiency. Given the difficulty that exists in verifying the delivery expenses of AIPs from publicly available sources, Congress could also consider whether RMA should provide this information to it in some form on a periodic basis.