Introduction
The Chesapeake Bay (the Bay) is the largest estuary in the United States. Congress has described it as a "national treasure" (P.L. 106-457), and it is recognized as a "Wetlands of International Importance" by the Ramsar Convention.1 The Chesapeake Bay estuary resides in a more than 64,000-square-mile watershed that extends across parts of Delaware, Maryland, New York, Pennsylvania, Virginia, West Virginia, and the District of Columbia. It is home to more than 18 million people and thousands of species of plants and animals.
Over time, the Bay's ecological conditions have deteriorated due to land-use changes, increased sediment loads and nutrient pollution, the use and spread of chemical contaminants, overfishing and overharvesting of aquatic species, and the introduction of invasive species. These changes have resulted in reductions to economically important fisheries, such as oysters and crabs; the loss of habitat, such as underwater vegetation and sea grass; annual dead zones, as nutrient-driven algal blooms die and decompose; and potential impacts to tourism, recreation, and real estate values. Joint state and federal restoration attempts did not begin until the early 1980s. Since then, federal agencies have worked together under a watershed-wide agreement and through a restoration program spearheaded by the U.S. Environmental Protection Agency (EPA).
Congress has and may continue to examine Chesapeake Bay restoration efforts. Actions in the Chesapeake watershed have served as examples for other estuary restoration efforts in the United States. This report provides background on the physical and ecological properties of the Bay and watershed, its economic value, the health of the ecosystem over time, and federal governance of Bay restoration efforts. It then discusses issues facing Congress as work continues toward 2025 restoration goals set by several state and federal plans.
Description of the Bay
Physical and Ecological Qualities
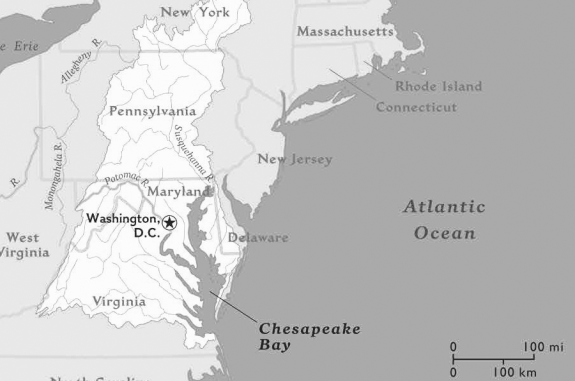
The Chesapeake Bay receives water from across the Chesapeake Bay watershed, including parts of six states (Delaware, Maryland, New York, Pennsylvania, Virginia, and West Virginia) and the entirety of the District of Columbia (DC) (Figure 1). The Bay watershed is more than 64,000 square miles in size, and its land-to-water surface area ratio (14:1) is the largest of any coastal water body in the world.2
More than 100,000 streams and rivers flow into the Chesapeake Bay.3 The Bay and its tidal tributaries have almost 11,700 miles of shoreline and an average depth between 26 feet and 33 feet with deep troughs that reach up to 174 feet in depth.4 The Bay's waters are roughly 50% freshwater and 50% salt water. The Susquehanna River supplies 45% of the Bay's freshwater. Four other rivers, the Rappahannock, York, James, and Potomac, provide another 45%.5 The remaining 10% of the Bay's freshwater comes from smaller rivers and tributaries.
|
Figure 1. Boundaries and Rivers of the Chesapeake Bay Watershed |
 |
|
Source: Congressional Research Service (CRS), adapted from National Geographic Education, "Chesapeake Bay Map Gallery," at https://www.nationalgeographic.org/maps/chesapeake-bay/. |
More than 3,600 species of plants, fish, and animals—including 348 species of finfish, 173 species of shellfish, more than 2,700 plant species, and 16 species of underwater grasses—are part of the Bay watershed ecosystem. The Bay is part of the Atlantic Flyway, and at least 140 species of birds regularly use the Bay's aquatic resources;6 every year, 1 million waterfowl winter in the Bay region.7 The watershed is also home to 46 plants and 113 animals listed as threatened or endangered species as of August 2014.8
The Bay's Economic Value
In 2016, more than 18 million people lived in the Chesapeake Bay watershed. According to the U.S. Geological Survey (USGS), that number is likely to rise to 20 million by 2030.9 The Bay's economy centers on seafood, tourism, recreation, and real estate.10 Few reports estimating the total economic value of the Chesapeake Bay are available. Instead, reports focus on a limited set of industries and services. For example, in 1989, Maryland state economists estimated that the Bay added $678 billion annually to the economies of Maryland and Virginia in annual incomes generated from commercial fishing; activities for the ports, ship and boat building, ship repair, and tourism; and waterfront property premiums.11 NOAA reported that the commercial seafood industry in Maryland and Virginia landed more than 440 million pounds of seafood, for a total value of nearly $300 million, in 2016.12 In 2013, researchers estimated that the value of the Chesapeake Bay watershed for selected ecosystem services (food production, climate stability, air pollution treatment, water supply, water regulation, waste treatment, aesthetics, and recreation) was $107 billion per year. According to the researchers, the aesthetic value of the Bay was worth over $38 billion per year and accounted for the largest component of the total.13
Bay Ecosystem Health over Time
The Chesapeake Bay has experienced various natural and man-made changes over the course of its existence.
Land Use and Habitat Changes
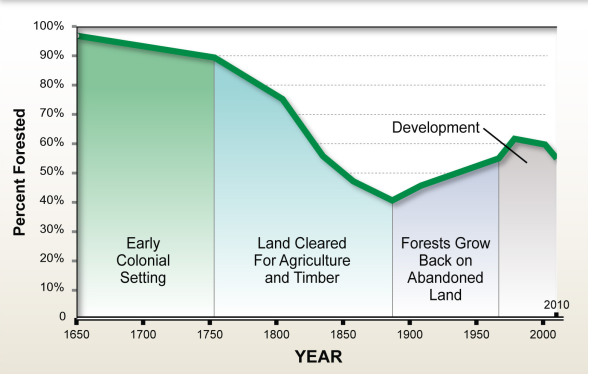
Land use has been changing in the watershed, with trends toward loss of forests, wetlands, and underwater vegetation and increases in agricultural, urban, and suburban development. Forest, wetlands, and underwater vegetation regulate water flow and sediment,14 provide food and habitat for wildlife, and filter contaminants. Some scientists estimate that the Bay's watershed was once fully forested and became primarily used for agriculture by the early 1900s.15 The most recently available data from 2012 show that forested areas cover about 55% of the watershed (Figure 2), with the remaining land cover divided between agricultural and urban/mixed uses.16 Wetlands and underwater vegetation (known as submerged aquatic vegetation) once covered up to 600,000 acres of the Bay and its tidal tributaries but have decreased in area since the 1960s.17 However, this trend has been reversing. For example, in 2017, scientists found the highest amounts of submerged aquatic vegetation in the Bay since 1984, estimated at more than 100,000 acres.18 Forest and wetland conversion into agricultural, urban, or suburban areas, and underwater vegetation loss or degradation can affect the Bay's water resources in several ways. Two key effects, according to scientists, are increased sediment loads and nutrient pollution, as discussed below.
Sediment Loads
Deforestation, agriculture, and increases in the amount of impervious surfaces from urban and suburban development have lowered the Bay ecosystem's ability to regulate and filter sediment. These land-use changes can accelerate water flow off of the land and into water bodies and increase erosion, transporting sediment along the way. In some parts of the Bay, sedimentation rates have increased by four to five times since the 1800s.19 In terms of human and wildlife health, sediment can lower light penetration, affecting underwater grasses, and can transport toxic contaminants, diseases, and excess nutrients downstream.20 Accreted sediments also can cause navigational hazards and block waterways.21
|
Figure 2. Forest Cover in the Chesapeake Bay Watershed, 1650-2010 |
 |
|
Source: USDA Forest Service, Chesapeake Forest Restoration Strategy, 2012, at https://federalleadership.chesapeakebay.net/FINAL%20ChesapeakeForestRestorationStrategy_GPO_130225.pdf. |
Nutrient Pollution
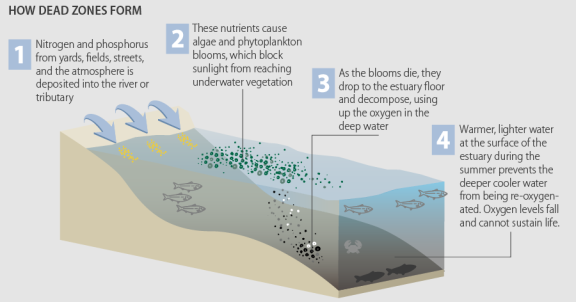
The Chesapeake Bay also is affected by excess nutrient concentrations. Nutrients, such as nitrogen and phosphorus, enter the Bay from sources such as agricultural runoff, urban runoff, and wastewater treatment plant discharges.22 High nutrient amounts can lead to the growth of excess algae or blooms, and potentially harmful algal blooms (HABs) that may produce toxins that can pose a threat to human and aquatic ecosystem health.23 The decomposition of algal blooms, even when nontoxic, can develop into areas of low oxygen or hypoxia known as dead zones, which are harmful to aquatic life that may not be able to survive in low-oxygen waters (Figure 3).24 Changes to the land that remove natural filters, such as forests and wetlands, and that increase impervious surfaces can increase nutrient concentrations. The amounts of nitrogen and phosphorus added to the Bay have varied since EPA began monitoring; high amounts of rain and large river flows have correlated with higher amounts of nitrogen and phosphorus.25 Since 1985, the Bay watershed has hosted an annual dead zone that is, on average, 1.7 cubic miles in volume.26 Ecologists forecast a larger-than-average dead zone of 1.9 cubic miles in 2018 due to high spring rainfall, which can increase nutrient loads into the bay.27
 |
|
Source: CRS, with data from National Science and Technology Council, Subcommittee on Ocean Science and Technology, Harmful Algal Blooms and Hypoxia Comprehensive Research Plan and Action Strategy: An Interagency Report, 2016, at https://cdn.coastalscience.noaa.gov/page-attachments/research/FINAL_HABs Hypoxia Research Plan and Action.pdf. |
Chemical Contaminants
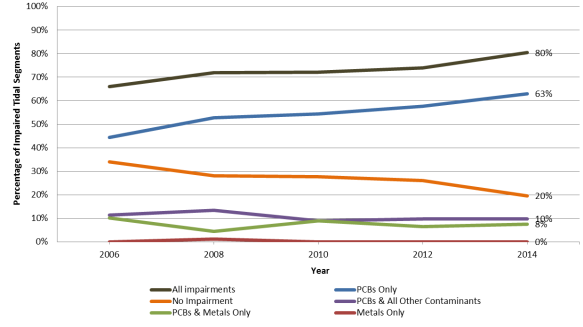
Chesapeake Bay waters and sediments contain a wide array of contaminants, such as potentially toxic metals and organics. Chemical contaminants affect humans and wildlife. In wildlife, contaminants may lead to infectious disease and parasite infestations, endocrine disruption, and impaired reproduction. Chemical contaminants also can build up in fish tissue and may affect humans who consume fish. Mercury and polychlorinated biphenyl's (PCBs) are the most commonly found metal and organic contaminants across the watershed, respectively.28 Chemical contaminants are linked to industry and vehicle air pollution, agricultural and stormwater runoff, and wastewater discharge.29 In 2014, the Chesapeake Bay Program (CBP) reported that approximately 80% of the Bay's tidal-water segments were fully or partially impaired due to the presence of toxic chemical contaminants (Figure 4).30
|
Figure 4. Percentage of Impaired Tidal Segments in DC, DE, MD, and VA by |
 |
|
Source: Chesapeake Bay Program, Chesapeake Progress, "Toxic Contaminants Policy and Prevention," at http://www.chesapeakeprogress.com/clean-water/toxic-contaminants-policy-and-prevention. Notes: The 2014 percentages do not total 100% due to rounding. DC = District of Columbia; DE = Delaware; MD = Maryland; PCBs = polychlorinated biphenyls, a type of organic contaminant; VA = Virginia. |
Fisheries
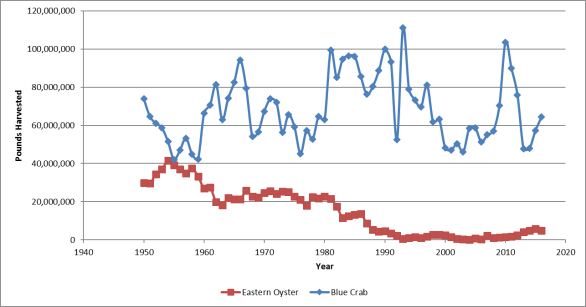
Recreational fishing data is unavailable, but annual commercial harvests of all fisheries species landed in the Chesapeake Bay more than doubled between 1950 and 1990 with harvests decreasing since 1990.31 Several factors, such as changes in gear technology, regulations, and environmental conditions, may have led to the increase and subsequent decrease of commercial harvests. For example, eastern oyster, blue crab, menhaden, Atlantic surf clam, Atlantic croaker, striped bass, and alewife harvests have fluctuated over time but generally have decreased since the mid-1990s due to water quality issues and overharvesting.32
Oysters
Oysters are a popular recreational fishery and an economic resource for Bay fisherman and the region, worth more than $46 million in commercial harvests in 2016.33 Oysters also improve ecological conditions in the Bay by filtering water and providing habitat for other species. Bay commercial oyster landings rose steeply in the late 1800s, reaching more than 120 million pounds, and began to decline in the early 1900s, leading to state and federal regulations on the industry.34 Oyster populations were further affected by diseases such as Dermo and MSX.35 Poor water conditions, disease, habitat loss, and overfishing led to harvests of less than 1 million pounds of landings in the 1990s and 2000s (Figure 5). Since 2007, oyster landings have increased relative to its low point, with almost 5 million pounds landed in 2016.36
Blue Crab
Blue crabs are commercially and recreationally harvested and have been affected by habitat loss and overharvesting in the Bay.37 The Bay blue crab fishery has experienced high and low commercial harvest years (Figure 5). Volume of blue crab landed reached a high point in 1993, with more than 110 million pounds, and a low of approximately 42 million pounds in 1955.38
Plants and Other Wildlife
The Bay and its watershed are home to thousands of species of plants and wildlife, including 46 plants and 113 animals listed as threatened or endangered species as of August 2014.39 Plants and wildlife populations in the Bay are principally affected by loss of habitat and in some cases disease and toxins. For example, the Bay region has one of the highest concentrations of bald eagles and osprey in the country.40 Although the birds are recovering from the effects of DDT pesticide use in the 20th century, they continue to be affected by habitat loss.41
The Bay is also home to more than 300 invasive species,42 which can have negative ecological and economic effects on native plants and wildlife.43 For example, nutria, which are semi-aquatic South American rodents introduced to Maryland in 1943, have destroyed some wetlands with their feeding habits. Efforts by federal, state, and local government, and nongovernmental organizations (NGOs) to remove the invasive rodent began in 2002; the known nutria populations were removed by 2016, and monitoring is ongoing.44
|
Figure 5. Pounds of Eastern Oyster and Blue Crab Commercially Harvested, |
 |
|
Source: CRS, with data from National Oceanic and Atmospheric Administration (NOAA), Office of Science and Technology, "Annual Commercial Landing Statistics," at https://www.st.nmfs.noaa.gov/st1/commercial/landings/annual_landings.html. |
Governance of Chesapeake Bay Restoration: The Chesapeake Bay Program
According to stakeholders, restoring the Bay ecosystem state is a complicated process due to the size of the Bay's watershed, the variety of stakeholders, and the complexity of Chesapeake Bay ecosystems. The Bay transcends geographical and political boundaries and affects numerous jurisdictions. Restoration efforts are challenging because they require cooperation and coordination between multiple federal and state agencies, tribes, local governments, NGOs, and private stakeholders. Planning and implementing complex environmental and ecosystem restoration efforts raises many technical, policy, and organizational issues.
Congress began to concentrate on Bay issues in the 1960s, as public and stakeholder pressure grew for federal government involvement in Bay restoration. Congress ordered a series of reports from the U.S. Army Corps of Engineers (USACE) and the EPA to investigate issues including the decline in fisheries, "control of noxious weeds," water pollution, and water quality control in the Chesapeake Bay.45 Since then, federal restoration activities have expanded across several federal agencies and are primarily coordinated by the Chesapeake Bay Program (CBP).
The CBP was established by the 1983 Chesapeake Bay Agreement.46 In 1987, Congress codified the CBP and directed the EPA Administrator to achieve and maintain water quality and to conduct habitat restoration and conservation for the benefit of Bay living resources in Section 117 of the Clean Water Act (P.L. 100-4). The CBP is a partnership of federal, state, and local agencies; tribes; academic institutions; and NGOs, and restoration activity implementation authority lies within individual agency program authorizations and the states.47 The CBP works with states through a committee structure to develop actions and strategies for restoration. The program's organization has changed over time as partners, agreements, and priorities have shifted. The program's organization may continue to change under the CBP's adaptive management approach.48
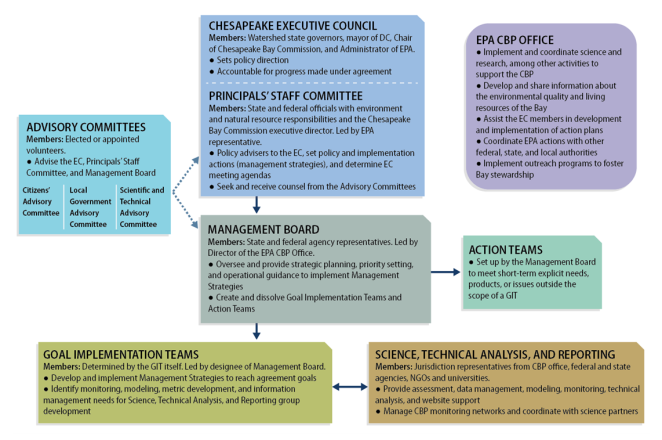
CBP activities have been led by an Executive Council (EC). The EC establishes policy direction for restoring and protecting the Bay and its living resources and is accountable to the public for progress made under the agreement (Figure 6). The EC is supported by the Principals' Staff Committee. Strategic planning, creation of guidance, and implementation of activities toward Agreement goals occur in the five different groups below the Principals' Staff Committee. The entire effort is informed by three Advisory Committees.49
Federal agency representatives are involved at each level of the CBP organization, including membership on the Executive Council; Principals' Staff Committee; Management Board; Goal Implementation Teams; and Science, Technical Analysis, and Reporting group. EPA has been considered the lead federal agency for implementing the program because it was directed by Congress to continue the CBP (33 U.S.C. 1267(b); Figure 6). Congress also directed the EPA to maintain an EPA Chesapeake Bay Program office (33 U.S.C. 1267(b)), which is staffed by employees from a number of federal and state agencies, academic institutions, and NGOs. Federal agencies are also partners through formal memoranda of understanding with EPA. The agencies also coordinate through the Federal Leadership Committee (FLC), which was established through President Obama's 2009 Executive Order 13508. In addition, federal agencies have various authorities to implement restoration programs and activities in the Bay on their own, as discussed in the section titled "What Authorities Are Federal Agencies Working Under to Restore the Chesapeake Bay?"
|
Figure 6. Chesapeake Bay Program Components, Members, and Responsibilities |
 |
|
Source: CRS, adapted from CBP, Governance and Management Framework for the Chesapeake Bay Program Partnership, 2015, at https://www.chesapeakebay.net/channel_files/22179/cbp_governance_document_7-14-15.pdf; 33 U.S.C. 1267. Notes: CBP = Chesapeake Bay Program; EC = Executive Council; EPA = U.S. Environmental Protection Agency; GIT = Goal Implementation Team; NGO = Nongovernmental Organization. |
State Role in Restoring the Bay
Each of the states in the Bay watershed conduct restoration efforts on an independent or joint basis. State restoration activities are formally shared and coordinated through proceedings of the CBP Executive Council. Congress directed EPA to aid states in developing action plans to reach restoration objectives (33 U.S.C. 1267). In addition to information sharing and coordination, federal agencies may award grants to the states to improve water quality and living resources in the Bay. E.O. 13508 sought to strengthen federal coordination with state and local governments.
Issues for Congress
In its oversight role, Congress continues to weigh if and how Chesapeake Bay federal restoration efforts should continue. If there is a federal role, Congress may consider how Bay restoration is coordinated, how much funding is available and may be needed for Bay restoration efforts, and what progress is being made in restoring the Bay.
Coordination and Authority
A large, multi-jurisdictional ecosystem restoration initiative, such as in the Bay, raises several questions for Congress about the federal role in restoration. Congress may consider the mechanisms in place to guide restoration activities, what role the federal government has in Bay restoration, and what federal agency authorities exist or are needed to complete, coordinate, and fund restoration activities in the Bay.
How Is Chesapeake Bay Restoration Guided?
Although various state and federal stakeholders have set forth several frameworks, agreements, and visions for restoring the Chesapeake Bay, which address different jurisdictions, Bay issues and timelines, no single, comprehensive ecosystem restoration plan exists to facilitate coordination of these efforts. There are currently three guiding documents for restoration and one draft plan: the 2010 Strategy for Protecting and Restoring the Chesapeake Bay Watershed (pursuant to President Obama's 2009 E.O. 13508), the EPA's 2010 Chesapeake Bay total maximum daily load (TMDL),50 the 2014 Chesapeake Bay Watershed Agreement, and the draft 2018 USACE Chesapeake Bay Comprehensive Water Resource and Restoration Plan. Table 1 briefly compares these guiding documents.
The extent to which one of these plans guides restoration efforts is unclear. The plans cover different jurisdictions and vary in terms of implementation. The plans also relate to each other in different ways. Select differences include the following:
- Implementation of the 2010 E.O. strategy, 2010 TMDL, and 2014 Chesapeake Bay Watershed Agreement is led by the EPA, with other federal agencies involved in some cases, and each plan contains two-year work plans or milestones. In comparison, the 2018 USACE draft comprehensive plan does not specify a certain timeline, contain specific goals or objectives, or require periodic sub-plans.
- The 2014 Chesapeake Bay Watershed Agreement includes many of the actions outlined in the 2010 E.O. strategy and the 2010 TMDL, and has guided the development of the 2018 USACE draft comprehensive plan.
Stakeholders utilize the plans in different ways. The Trump Administration has left the 2009 E.O. in place, but the 2010 E.O. strategy's use as a guiding mechanism is uncertain. Some federal program managers have argued that the 2010 E.O. strategy is no longer a focus and that the 2018 draft USACE comprehensive plan could serve as an organizing document for federal agencies when considering where to focus restoration efforts geographically.51 Some stakeholders have lauded the 2014 Chesapeake Bay Watershed Agreement's success in obtaining consensus results largely without regulatory or legally required action,52 in contrast to the actions required by the 2010 TMDL (see next section for more information). Others argue that the voluntary nature of the 2014 Chesapeake Bay Watershed Agreement weakens restoration efforts.53 Finally, some may contend that the 2010 TMDL, which is focused on specific water quality factors, is not holistic in terms of addressing the entire ecosystem.
Congress may consider other questions related to the plans, such as whether the current plans successfully integrate efforts across agencies, states, and local governments or whether they overlap and may cause confusion. In addition, Congress may continue to consider if the plans are most effective in their current states or with changes to jurisdictions, leadership, and enforcement, and if state and local stakeholders have been or should be equal partners in the implementation of the plans.54
|
2010 E.O. Strategya |
2010 EPA TMDLb |
2014 Chesapeake Bay Watershed Agreementc |
2018 USACE Draft Comprehensive Pland |
|
|
Jurisdiction |
Federal |
States and DC |
Federal, States, and DC |
Federal |
|
Leadership |
EPA |
EPA |
Chesapeake Executive Council (Chesapeake Bay Commission, watershed states, DC, and EPA) |
USACE |
|
Participants |
Federal Leadership Committee |
Watershed states and DC |
Watershed states, DC, federal agencies (DHS, DOC, DOD, DOI, DOT, EPA, USDA), and other stakeholders |
USACE and voluntary stakeholders |
|
Deadline |
To reach goals, 2025 |
To implement actions, 2025 |
To reach goals, 2025 |
None |
|
Federal Authorization |
President Obama's 2009 E.O. 13508 |
CWA |
None |
WRRDA 2014 |
|
Compliance |
Required by the E.O. |
Required by law (CWA) |
Voluntary |
USACE required by law (WRRDA 2014) to complete the plan. Implementation by USACE and other agencies voluntary. |
|
Main Focus |
Strategy notes four main goals related to water quality, habitat, fish and wildlife, and public access. |
Water quality—specifically nitrogen, phosphorus, and sediment concentrations. |
Agreement covers 10 goals related to fisheries, habitats, water quality, contaminants, watersheds, stewardship, land conservation, public access, environmental literacy, and climate resilience. |
Identify areas for restoration (by USACE or otherwise) that align with 2014 Chesapeake Bay Watershed Agreement goals. |
|
Overarching Plan? |
No |
Yes (state-developed "Watershed Implementation Plans," 2018-2025) |
Yes (Goal Implementation Team developed "Management Strategies," 2015-2025) |
No |
|
Sub-Plans? |
Two-year work plans. As of July 2018, only one goal, "restore clean water," has two-year work plan |
Two-year milestones |
Two-year work plans |
None |
Sources: 2010 E.O. strategy—Federal Leadership Committee, Executive Order 13508 Strategy for Protecting and Restoring the Chesapeake Bay Watershed, May 12, 2010; 2010 EPA TMDL—U.S. Environmental Protection Agency, Chesapeake Bay Total Maximum Daily Load [TMDL] for Nitrogen, Phosphorus, and Sediment, December 29, 2010; 2014 Chesapeake Bay Watershed Agreement—Chesapeake Bay Program, Chesapeake Bay Watershed Agreement, 2014; 2018 USACE draft comprehensive plan—National Fish and Wildlife Foundation and U.S. Army Corps of Engineers (USACE), Chesapeake Bay Draft Comprehensive Water Resources and Restoration Plan, May 2018.
Notes:
CWA = Clean Water Act (33 U.S.C. §§1251 et seq.)
DC = District of Columbia
DHS = U.S. Department of Homeland Security
DOC = U.S. Department of Commerce
DOD = U.S. Department of Defense
DOI = U.S. Department of the Interior
DOT = U.S. Department of Transportation
E.O. = Executive Order
EPA = U.S. Environmental Protection Agency
TMDL = Total maximum daily load
USACE = U.S. Army Corps of Engineers
USDA = U.S. Department of Agriculture
Watershed states = Delaware, Maryland, New York, Pennsylvania, Virginia, and West Virginia
WRRDA 2014 = Water Resources Reform and Development Act of 2014 (P.L. 113-121).
a. President Obama's 2009 Executive Order (E.O.) 13508 instructed the federal government to take a more prescribed role in restoring the Chesapeake Bay through the establishment of the Federal Leadership Committee (FLC). The FLC is composed of representatives from EPA, DHS, DOC, DOD, DOI, DOT, and USDA. Among other actions, the E.O. directed the FLC agencies to prepare an integrated restoration strategy, released in 2010 as the "Strategy for Protecting and Restoring the Chesapeake Bay Watershed."
b. Prompted by EPA consent decrees in Virginia and DC, and monitoring data that continued to show that portions of the Bay were not attaining water quality standards, EPA established a TMDL for pollution sources in December 2010. It is the largest single TMDL in terms of area covered, to date—a compilation of TMDLs for 92 individual Chesapeake Bay and tributary segments. The TMDL, through the required state and DC Watershed Implementation Plans, identifies specific reductions in nutrient and sediment amounts by certain dates from various sources (e.g., stormwater, agriculture, air deposition, wastewater, and septic systems). More information about the TMDL and 2017 Mid-Point Assessment can be found in CRS In Focus IF10627, Ecosystem Restoration of the Chesapeake Bay, by Pervaze A. Sheikh and Laura Gatz; and CRS Report RL30030, Clean Water Act: A Summary of the Law, by Laura Gatz.
c. The Chesapeake Bay Agreement has been renewed four times, with the most recent agreement, the "Chesapeake Bay Watershed Agreement," signed in 2014. The evolution of the four agreements and an amending agreement in 1992 track scientific understanding and political interest in Chesapeake Bay restoration. Each successive agreement has reaffirmed the signatories' commitment to improving water quality and habitat. The agreements have become more specific in terms of their goals, commitments, and suggested actions as monitoring and scientific knowledge about the Bay has increased. For a comparison between the agreements, see Appendix B.
d. USACE was appropriated funding to complete a Chesapeake Bay Comprehensive Water Resource and Restoration Plan watershed assessment. USACE solicited restoration project ideas from stakeholders across the watershed to determine the range of projects with stakeholder interest and identify which projects may be aided by or completed by USACE. The plan is in its final stages and uses data from the CBP and implementation of EPA's TMDL.
What Is the Role of the Federal Government in Restoration?
Congress may examine the federal government's role in restoration efforts. The federal government is authorized to perform restoration activities under several congressional authorizations (see next section). Federal agencies complete restoration activities on their own or in partnership with other agencies. Federal agencies execute these collaborations through memoranda of understanding.55
Congress may also examine the role of state restoration efforts as they are coordinated and integrated with federal work in the Chesapeake Bay. With the exception of the statutory relationship between the federal government and states in protecting water quality under the Clean Water Act, the federal and state roles in Bay restoration are not defined by law. This is in contrast to other restoration initiatives, such as the Comprehensive Everglades Restoration, which considers the State of Florida as a nonfederal partner with formal duties under law (P.L. 106-541, Title VI, §601). In the Chesapeake Bay, coordination of broad restoration activities between state and federal agencies is largely achieved through the voluntary Chesapeake Bay Watershed Agreement and CBP, where decisions are determined by consensus.
Some have challenged the extent of the federal government's role in managing restoration of the Chesapeake Bay. These stakeholders and Members of Congress contend that the federal government has overreached its authority and intruded upon the states' powers to regulate land use, especially in regard to the EPA TMDL.56 For example, a lawsuit challenged the extent of EPA's authority and oversight over state actions, in regard to the TMDL, with the Third Circuit of Appeals finding that the EPA had acted within its authority.57 In the 115th Congress, the FY2019 House Interior, Environment, Financial Services, and General Government appropriations bill (H.R. 6147) was amended to include a provision that would prohibit EPA funding for actions against watershed states and DC in the event the jurisdiction did not meet TMDL goals. The Trump Administration has encouraged "the six Chesapeake Bay states and Washington, D.C. to continue to make progress in restoring the Bay from within [EPA] core water programs" in the proposed FY2018 EPA budget.58 In contrast, other stakeholders—such as some environmental groups, local government officials, and other Members of Congress—support federal government involvement in Bay restoration. These stakeholders argue that the federal government should lead restoration efforts and should provide greater federal funding for restoration activities.59
What Authorities Are Federal Agencies Working Under to Restore the Chesapeake Bay?
Several federal agencies conduct restoration activities in the Chesapeake Bay watershed independently or with other agencies under various authorities. In contrast to restoration efforts in other large estuaries, such as the Great Lakes or Everglades, Congress has not authorized restoration work in the Bay under a single comprehensive law. Some of the restoration work is authorized under a variety of Chesapeake Bay-specific laws and regulations (Appendix C). For example, Congress has directed the EPA to maintain a Chesapeake Bay Program (33 U.S.C. §1267), offer Chesapeake Bay restoration-related grants (33 U.S.C. §1267(d) & (e)), and perform annual Bay grass surveys (33 U.S.C. §2803(d)), among other activities. Congress has also authorized federal agencies to perform more general activities that may be applied in the Chesapeake Bay, such as the Clean Water Act (33 U.S.C. §§1251 et. seq.) and the Aquatic Nuisance Prevention and Control Act (16 U.S.C. §§4701 et seq.) (Appendix C).
Some stakeholders may contend that directing agencies to work together under a specific federal authority and with an organizing structure would encourage more efficient progress toward restoration. Congress has enacted organizing entities for the Great Lakes Task Force, under the Great Lakes Restoration Initiative (P.L. 111-88, Title I),60 and the South Florida Ecosystem Restoration Task Force, under the Comprehensive Everglades Restoration Plan (P.L. 106-541, Title VI, Section 601). Other stakeholders, however, may note that legislation authorizing coordination and collaboration among federal agencies is not necessary, as restoration activities are already authorized for the EPA and several other agencies under more general authorities. Further, these individuals may note that federal agencies are coordinating efforts under the Chesapeake Bay Watershed Agreement and through the CBP.
Funding
Congress continues to consider how much funding has been spent, how much should be allocated to Chesapeake Bay restoration, and the total costs of restoring the Bay. Answering these questions is complicated by the number of federal programs and states involved in restoring the Chesapeake Bay.
How Much Has Congress Appropriated for Bay Restoration?
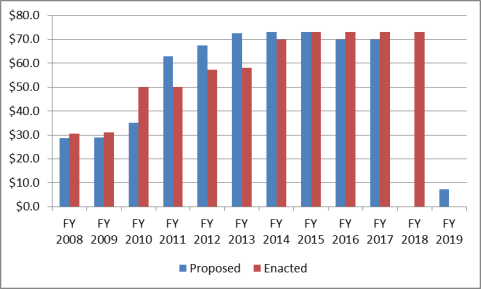
Congress has been interested in how much has been appropriated for Bay restoration, in part, to evaluate the appropriate level of federal spending on restoration activities. Most federal funding to restore the Chesapeake Bay is discretionary, subject to the annual congressional appropriations process. Until recently, tracking the amounts federal agencies have spent on restoration has been difficult, as many nationwide programs support restoration activities in the watershed but do not specify the level of funding for Chesapeake Bay efforts in their budget. Congress has been interested in tracking costs related to Bay restoration and enacted the Chesapeake Bay Accountability and Recovery Act in 2014 (CBARA; P.L. 113-273), which requires the Office of Management and Budget (OMB) to compile Chesapeake Bay restoration funding information from the seven federal departments on the FLC in an annual crosscut report. OMB released crosscut reports in 2016 and 2017 for funding information between FY2014 and FY2016, and estimates for FY2017 (Table 2). The reported amounts have specific limitations and assumptions (see text box below).
|
The Chesapeake Bay Restoration Spending Crosscut Under the Chesapeake Bay Accountability and Recovery Act of 2014 (CBARA; P.L. 113-273), Congress directed the Office of Management and Budget to compile a spending crosscut of agency funding for Chesapeake Bay restoration efforts. A spending crosscut is a compilation of amounts spent by federal agencies on a project or program. Agencies may have several specific restoration activities aimed at restoring the Chesapeake Bay and other national-level programs that partially support restoration in the Bay and its watershed. Under the CBARA guidelines, funding amounts may be extrapolated from past funding or estimated based on the portion of the national-level program focused directly on Chesapeake Bay restoration activities. These national-level programs account for the majority of the total spending reported. The information collected under CBARA also is limited by the act's broad definitions, which allow federal agencies to include or exclude various programs for different reasons, potentially leading to inconsistent reporting. The crosscut provides overall estimates over time and is helpful in understanding the general scope of each agency's investment in restoration. Final FY2017 funding and FY2018 estimates are not currently available. |
According to the Chesapeake Bay crosscut reports, the federal government had between $460 million and $570 million per year in budget authority for restoration activities in the Bay between FY2014 and FY2017 (Table 2). According to the crosscut, EPA and the Department of Agriculture (USDA) provided the most funding to the overall total budget authority. EPA distributed two-thirds through grants to state and local partners.61 The remaining EPA funding supported CBP office and personnel, contracts and interagency agreements, and scientific analysis and decision-support tools.62 USDA distributed most of its restoration funding through the nationwide Natural Resource Conservation Service, which supports conservation easement programs and provides technical and financial assistance to farmers and private landowners.63
Table 2. Federal Agency Operating Level for Watershed Restoration,
FY2014-FY2017
(nominal dollars, in millions)
|
Dept. |
FY2014 |
FY2015 |
FY2016 |
FY2017* |
|
EPA |
$183.5 |
$185.8 |
$196.1 |
$204.4 |
|
USDA |
$154.8 |
$156.3 |
$160.7 |
$163.3 |
|
DOD (non-USACE) |
$57.4 |
$41.8 |
$70.7 |
$79.5 |
|
DOI |
$46.2 |
$41.1 |
$41.1 |
$37.5 |
|
USACE |
$26.0 |
$22.8 |
$55.8 |
$66.3 |
|
DOC |
$16.4 |
$16.1 |
$16.3 |
$17.2 |
|
DHS |
NA |
NA |
NA |
$1.1 |
|
DOT |
NA |
NA |
NA |
NA |
|
TOTAL |
$484.3 |
$464.0 |
$540.7 |
$569.3 |
Sources: Office of Management and Budget (OMB), Chesapeake Bay Restoration Spending Crosscut: Report to Congress, December 2016; OMB, Chesapeake Bay Restoration Spending Crosscut: Report to Congress, October 2017.
Notes: * The FY2017 funding is an estimate and reflects data only through the second quarter of the fiscal year.
According to the Chesapeake Bay Accountability and Recovery Act of 2014 (P.L. 113-273), only programs of at least $300,000 must be reported to OMB in the first three years of the act, therefore smaller programs may not be reflected in the total amounts.
Funding amounts may be extrapolated from past funding or estimated based on the portion of the program focused directly on Chesapeake Bay restoration activities.
NA = Not Applicable. Activities did not meet the definitional limits of the crosscut as determined by OMB.
EPA = U.S. Environmental Protection Agency
USDA = U.S. Department of Agriculture
DOD = U.S. Department of Defense
DOI = U.S. Department of the Interior
USACE = U.S. Army Corps of Engineers
DOC = U.S. Department of Commerce
DHS = U.S. Department of Homeland Security
DOT = U.S. Department of Transportation
Stakeholders have various viewpoints on how much funding should be appropriated to Chesapeake Bay restoration that Congress may consider during the appropriations process. For example, some stakeholders and Members of Congress have emphasized that consistent federal funding for activities is key to successful restoration and that the elimination or significant reductions of restoration funding could halt current progress on restoring the Bay.64 Others contend that the federal government is spending too much on restoration and that financial responsibility for restoring the Bay should fall to the states. For instance, the Trump Administration proposed to eliminate FY2018 funding for the EPA CBP and noted that EPA would "encourage the six Chesapeake Bay states and Washington, D.C. to continue to make progress in restoring the Bay from within core [EPA] water programs" and return "responsibility for funding local environmental efforts and programs to state and local entities."65 In FY2019, the Administration's EPA budget request proposed $7.3 million for the CBP for state and local water quality monitoring and science coordination activities.66
Some stakeholders may contend that the Chesapeake Bay restoration effort would have a higher chance of receiving consistent funding if the authorization for funding for the CBP were current. The CBP authorization for appropriations expired in 2005.67 Similarly, other stakeholders, who believe that federal restoration efforts receive insufficient funding, may argue that if all federal restoration efforts were authorized and organized under one law, the efforts may receive more funding. For example, Great Lakes restoration activities were supported by appropriations of $888 million to $986 million per year between FY2012 and FY2016, the largest component of which supported the Great Lakes Restoration Initiative, a program with dedicated Great Lakes funding, in addition to agency Great Lakes restoration work.68 Some could disagree by arguing that gathering all restoration activities under one authorization could create a large target for funding decreases, implying that having restoration efforts spread across several authorities is more advantageous for receiving appropriations.
|
Chesapeake Bay Program Funding for FY2018 and FY2019 After several years of increased or level appropriations, the Chesapeake Bay Program (CBP) was proposed to be eliminated in the FY2018 U.S. Environmental Protection Agency (EPA) budget request (see Error! Reference source not found.). Congress did not support the Administration's request and provided the CBP with $73 million in FY2018. In FY2019, the Administration's EPA budget request proposed $7.3 million for the CBP, to support state and local water quality monitoring and science coordination activities. Both the House (H.R. 6147) and Senate (S. 3073) have introduced legislation to provide level funding of $73 million for the CBP in FY2019. Additional proposed bills in the 115th Congress would permanently authorize appropriations for the CBP with such sums as are necessary (S. 1429) or would authorize the CBP at $90 million per year for fiscal years 2018 through 2022 (S. 1514). Congress also supported other Chesapeake Bay restoration activities in the FY2018 appropriations omnibus (P.L. 115-141), which provided FY2017-level or increased funding to most of the relevant programs. The Administration's FY2019 agency budget requests proposed reductions for many of these programs. It is unclear what impacts these proposed cuts would have on nationwide programs that perform restoration work in the Bay. Sources: EPA, FY2018 EPA Budget in Brief, 2017, at https://www.epa.gov/sites/production/files/2017-05/documents/fy-2018-budget-in-brief.pdf; and EPA FY2019 EPA Budget in Brief, 2018, at https://www.epa.gov/sites/production/files/2018-02/documents/fy-2019-epa-bib.pdf. |
What Is the Total Cost of Restoring the Chesapeake Bay?
Several groups have attempted to estimate the total cost of restoring the Bay and maintaining a restored Bay, with varying results. Cost estimates have ranged from $7 billion for individual state costs to $28 billion for the entire watershed, with additional annual maintenance costs projected once restoration is complete.69 Costs estimates vary depending on the restoration metrics, assumptions, and measures (e.g., nutrient-reduction technology, agricultural best management practices, etc.) included in the calculations.
Some stakeholders contend that the increase in social and economic benefits to the watershed will justify the final cost. They add that the current cost of restoration is likely to be less than the cost of restoration in the future.70 Other stakeholders argue that the costs have and will result in continual, if slow, improvements to Bay conditions.71 Others, including some Members of Congress, question the justification for funding Bay restoration because a comprehensive cost-benefit analysis of restoration has not been completed.72 Some stakeholders may also contend that the reported improvements in water quality and habitat do not justify the funding already spent nor the expected final cost to restore the Bay.
Restoration Progress
Congress continues to be interested in whether progress is being made in restoring the Bay. The Chesapeake Bay Watershed Agreement contains milestones for achieving its goals, and progress toward meeting those goals by 2025 is evaluated periodically. Even with these evaluations, it is unclear whether progress is being made toward the stated goals.
Is Progress Being Made Toward Restoration?
Since the CBP's inception, stakeholders have considered whether appropriate progress is being made to restore the Chesapeake Bay and its resources. Several Chesapeake Bay evaluations are conducted on an ongoing basis to measure the progress of Bay restoration over time, each with unique methodologies. Chesapeake Bay restoration progress results differ among evaluations. The differences may be due to different priorities, methodologies, data sets, metrics, and timescales of interest.
The CBP has periodically assessed progress in restoring the Bay since the 1983 Chesapeake Bay Watershed Agreement. Goals set in the Bay agreements have been largely missed, such as in the 2000 Chesapeake Bay Agreement, which aspired to restore the Bay to certain conditions by 2010. The 2014 Chesapeake Bay Watershed Agreement set 2025 as its target year to reach certain goals (and underlying outcomes) and tracks biennial progress toward the goals. For 2016-2017, CBP reports that progress was made in five goals, and five goals showed no progress/regress.73 For example, progress was made toward the sustainable fisheries goal due to reported increases in the blue crab and oyster populations.74 In July 2018, the EPA released its midpoint assessment of progress in implementing practices to reach a 60% reduction of nutrients and sediment by 2017, as set in the TMDL. According to the EPA, jurisdictions have implemented practices to achieve the phosphorus and sediment reductions, but did not reach the nitrogen reduction.75
In addition to federal reporting, several NGOs have evaluated restoration progress over time. Non-federal evaluations of restoration progress generally have been critical of the level of progress. The 2016 Chesapeake Bay Foundation (CBF) State of the Bay report assigned the Chesapeake Bay a rating of 34 out of 100, a slight increase from the 2014 rating of 32.76 Since 1998, CBF has rated the Bay between 27 and 34; CBF would consider the Bay restored at a rating of 70. Similar Chesapeake Bay conditions were reported by an evaluation completed by the University of Maryland Center for Environmental Science (UMCES). According to UMCES, in 2017 decreased nutrient levels were "significantly improving" the Bay, but poor to moderate water clarity and nitrogen, among other indicators, persisted.77 UMCES rated the Bay at a C, or 54% overall; since 1986, UMCES has rated the Bay between 36% and 55%.78
Stakeholders have a range of opinions on whether Bay restoration is progressing. Some stakeholders may contend that Bay conditions are improving at an acceptable rate for the resources being spent on restoration. Others argue that restoration efforts are progressing even though restoration ratings remain stable or show minor improvements. These stakeholders note that a stable ecosystem is progress since there has been no further deterioration of conditions despite population growth, increasing impermeable surfaces, and growing nutrient loads in the watershed.79 Others may contend that although the Bay is improving, it could be doing so at a faster pace.80 Finally, some stakeholders may argue that it may not be possible to restore the Bay to a pristine or semi-pristine level due to the persistence of original problems such as excess nutrients and habitat loss, among others. These stakeholders may argue for lower expectations to measure restoration success or concede that a man-made ecosystem should be the goal of restoration.
How Are Federal Restoration Efforts Being Evaluated?
Since 1983, the progress of the Bay's resources and restoration efforts has received oversight from both the public and different levels of government. Congress, GAO, and the EPA Office of Inspector General (OIG) have addressed the CBP's reporting of Bay health and restoration progress.81 GAO recommended the establishment of an independent evaluator or peer review in 2005, again in 2008, with the EPA OIG echoing these concerns in 2008 as well. President Obama's 2009 Executive Order 13508 called for a consistent, periodic evaluation in coordination with the FLC. In response, some CBP stakeholders argued for the creation of an outside review group, an independent entity within the CBP with an enforcement role, or an internal audit committee. Some noted that the use of a one-time National Academy of Science evaluation in 2011, while helpful to evaluate the short-term scientific and technical efforts of restoration, could not hold the CBP accountable in the long term. Others argued that the CBP's adoption of an adaptive management framework, which allows internal program evaluations, removed the need for external evaluation. 82
In 2014, Congress directed EPA to appoint an independent evaluator to report its findings and recommendations to Congress on a biannual basis (Chesapeake Bay Accountability and Recovery Act; CBARA; P.L. 113-273). Under CBARA, EPA must appoint an independent evaluator from a list of nominees provided by the CBP Executive Council. In June 2018, CBP stated that the implementation of an independent evaluator was "on hold pending direction from the [Principle Staff Committee]."83
|
1933 |
Federal and state governments from around the Chesapeake Bay (the Bay) meet to try to address problems in the Bay collaboratively but are not successful in organizing a multi-state committee. |
|
1956 |
Enactment of the Federal Water Pollution Control Act (P.L. 84-660). |
|
1965 |
Congress funds U.S. Army Corps of Engineers (USACE) to complete an analysis of the Bay. USACE focuses on the existing conditions, projected future water resource needs, and recommended solutions (P.L. 89-298). |
|
1972 |
Enactment of Federal Water Pollution Control Act Amendments of 1972 (P.L. 92-500), now known as the Clean Water Act. |
|
1972 |
Enactment of the Coastal Zone Management Act (P.L. 92-583). |
|
1973 |
USACE reports on Chesapeake Bay ecosystem deterioration. The third objective of the original congressional direction (P.L. 89-298), recommending solutions and planning, was not published. |
|
1975 |
Congress directs the EPA to complete an in-depth study of the Chesapeake Bay (S.Rept. 94-326, report to accompany H.R. 8070, which became P.L. 94-116). |
|
1976 |
EPA begins its Chesapeake Bay Research Program study (pursuant to S.Rept. 94-326). |
|
1977 |
Enactment of amendments to the Clean Water Act (P.L. 95-217). |
|
1980 |
Chesapeake Bay Commission is formed. |
|
1983 |
EPA publishes its Chesapeake Bay Research Program study (pursuant to S.Rept. 94-326), which identifies declines around the Bay, cites nutrient pollution as the main source of degradation, and calls for protection of the Bay ecosystem. |
|
1983 |
First Chesapeake Bay Watershed Agreement signed. |
|
1983 |
Chesapeake Bay Program (CBP) established. |
|
1984 |
The CBP initiates a water quality monitoring program in the Chesapeake Bay. |
|
1987 |
Reaffirmation of commitments through an updated Chesapeake Bay Agreement. |
|
1987 |
Enactment of amendments to the Clean Water Act (P.L. 100-4), specifically Section 117, which authorizes the continuation of the CBP and the establishment of an EPA office to coordinate federal and state efforts to restore and protect the Bay and to disseminate information. |
|
1992 |
Amendments to the 1987 Chesapeake Bay Watershed Agreement are signed. The amendments develop a strategy for tributaries and attempt to reduce nutrients at the source. |
|
1995 |
Local Government Partnership Initiative is signed to assist local governments in implementing restoration efforts in the watershed. |
|
1998 |
EPA adds the Bay and many of its tributaries to the agency's list of impaired waters, requiring action under the Clean Water Act. |
|
2000 |
Reaffirmation of commitments with an updated agreement to restore the Bay, including strategic plan to guide restoration and protection through 2010. The intent is to remove the Bay from EPA's impaired water list by 2010. In addition to Maryland, Pennsylvania, and Virginia, the District of Columbia, Delaware, New York, and West Virginia agree to the water quality goals by signing a memorandum of understanding with EPA. |
|
2000 |
Enactment of the Chesapeake Bay Restoration Act (P.L. 106-457), which requires a progress report every five years and authorizes appropriations of $40 million per year for the Chesapeake Bay Program in FY2001-FY2005. |
|
2002 |
Congress creates the Environmental Quality Incentives Program (P.L. 104-127) to promote agricultural productivity and environmental quality as compatible goals. |
|
2005 |
U.S. Government Accountability Office (GAO) calls for improving strategies and measures for assessing progress in 2000 Agreement. |
|
2008 |
EPA Office of Inspector General concludes that under the current plan and conditions the Bay watershed will remain impaired for decades. |
|
2008 |
GAO finds that although positive steps have been taken, additional actions are needed before the CBP has the comprehensive, coordinated implementation strategy GAO had recommend. |
|
2008 |
The Consolidated Appropriations Act (P.L. 110-161) directs EPA to immediately implement all the recommendations in the 2005 GAO report and submit a report to Congress and GAO demonstrating that the recommendations have been implemented. |
|
2008 |
CBP launches the Chesapeake Action Plan to implement the GAO recommendations. |
|
2008 |
Congress authorizes and provides funding for the Chesapeake Bay Watershed Initiative through the 2008 farm bill (P.L. 110-234). |
|
2009 |
President Obama signs Executive Order 13508, which requires federal agencies to coordinate on Chesapeake Bay restoration through the establishment of the Federal Leadership Committee, and through the development and implementation of a federal agency Chesapeake Bay restoration strategy. |
|
2009 |
Chesapeake Bay Foundation files suit against EPA for failure to clean up the impaired waters of the Bay as required under the Clean Water Act. |
|
2010 |
EPA establishes TMDL levels for all segments of the Chesapeake Bay. The TMDL plan requires practices to lower nitrogen, phosphorus, and sediment levels by 60% (in comparison to 2009 levels) to be in place by 2025. |
|
2010 |
The Federal Leadership Committee releases its Strategy for Protecting and Restoring the Chesapeake Bay Watershed pursuant to President Obama's 2009 Executive Order 13508. |
|
2011 |
GAO reports that progress assessment and restoration plans continue to be limited. GAO recommends that federal agencies and state stakeholders develop a process for developing common priorities and potentially a new Chesapeake Bay agreement. |
|
2014 |
Chesapeake Bay Watershed Agreement is signed, with the addition of headwater states (Delaware, New York, and West Virginia) as full signatories. |
|
2014 |
Water Resources Reform and Development Act of 2014 (P.L. 113-121) is enacted, and directs and funds USACE to complete a comprehensive watershed assessment within two years. |
|
2014 |
Enactment of the Chesapeake Bay Accountability and Recovery Act (P.L. 113-273), which requires Office of Management and Budget to develop a federal cross-cut budget to account for federal and state spending for Bay restoration. |
|
2018 |
USACE releases draft Chesapeake Bay Comprehensive Water Resources and Restoration Plan to identify optimal areas for restoration and potential geographic gaps to assist with implementation of the 2014 Chesapeake Bay Watershed Agreement. |
Source: CRS.
Appendix B. Chesapeake Bay Agreement Over Time
|
1983 Chesapeake Bay Agreement |
1987 Chesapeake Bay Agreement |
1992 Amendments to the 1987 Chesapeake Bay Agreement |
Chesapeake 2000 (C2K) |
2014 Chesapeake Bay Watershed Agreement |
|
|
Signatories |
Governors of Maryland, Pennsylvania, and Virginia, Mayor of DC, and EPA Administrator |
Governors of Maryland, Pennsylvania, and Virginia, Mayor of DC, EPA Administrator, and Chairman of the Chesapeake Bay Commission |
Governors of Maryland, Pennsylvania, and Virginia, Mayor of DC, EPA Administrator, and Chairman of the Chesapeake Bay Commission |
Governors of Maryland, Pennsylvania, and Virginia, Mayor of DC, EPA Administrator, and Chairman of the Chesapeake Bay Commission |
Governors of Delaware, Maryland, New York, Pennsylvania, Virginia, and West Virginia, Mayor of DC, EPA Administrator on behalf of the Federal Leadership Committee, and Chairman of the Chesapeake Bay Commission |
|
Priorities |
Not Applicable |
Six priorities: |
Not Applicable |
Five priorities: |
Ten priorities: |
|
Commitments |
Not Applicable |
Set 27 underlying commitments, including 40% reduction in nitrogen and phosphorus by 2000. |
Added several commitments, and reaffirmed 40% reduction in nitrogen and phosphorus by 2000. |
Set 101 underlying commitments, including 40% reduction in nitrogen and phosphorus by 2010. |
Set 31 underlying commitments, including reaching EPA's total maximum daily load nutrient and sediment concentrations by 2025. |
|
Additional Points |
Established the Chesapeake Executive Council (EC) composed of state Cabinet designees of the Governors, the mayor of the District of Columbia (DC), and the U.S. Environmental Protection Agency (EPA) Regional Administrator to implement coordinated plans. Created the Implementation Committee of agency representatives. Founded a liaison office in Annapolis, Maryland, to support the EC and the Committee. |
Altered the EC by replacing the cabinet secretaries with the governors from each signatory state (Maryland, Pennsylvania, and Virginia) and added the EPA Administrator and Chesapeake Bay Commission chair. Required annual evaluation of progress and the potential for additional commitments. |
Added language about the importance of tributaries. |
Chesapeake headwater states (Delaware, New York, and West Virginia) sign a memorandum of understanding to work with EC. |
Added governors of Delaware, New York, and West Virginia to the EC. Included many of the actions required by 2009 Executive Order 13508. Noted the significance of local governments, individual citizens, businesses, watershed groups, and other nongovernmental organizations. |
Source: Chesapeake Bay Agreements in 1983, 1987, 2000, and 2014, and 1992 Amendments to the 1987 Agreement.
Appendix C. Selected Federal Authorities Related to Chesapeake Bay Restoration
|
Agency |
Direct Chesapeake Bay Authority |
General Nationwide Authority |
|
EPA |
Chesapeake Bay Program, 33 U.S.C. §1267(b) |
Clean Water Act, 33 U.S.C. §§1251 et. seq. |
|
Chesapeake Bay Technical Assistance and Assistance Grants, 33 U.S.C. §1267(d) |
||
|
Chesapeake Bay Implementation and Monitoring Grants Program, 33 U.S.C. §1267(e) |
||
|
Chesapeake Bay Grass Survey, 33 U.S.C. §1267(i) |
||
|
Intensive Coastal Water Quality Monitoring Programs- 33 U.S.C. §2803(d) |
||
|
Atmospheric Deposition Monitoring, 42 U.S.C. §7412(m) |
||
|
FWS |
Aquatic Nuisance Prevention and Control, 16 U.S.C. §§4701 et seq. |
|
|
NOAA |
NOAA Chesapeake Bay Office, 15 U.S.C. §1511d |
Aquatic Nuisance Prevention and Control, 16 U.S.C. §§4701 et seq. |
|
Chesapeake Bay Fishery and Habitat Restoration Small Watershed Grants Program, 15 U.S.C. §1511d(c) |
||
|
Intensive Coastal Water Quality Monitoring Programs, 33 U.S.C. §2803(d) |
||
|
Atmospheric Deposition Monitoring, 42 U.S.C. §7412(m) |
||
|
NPS |
Chesapeake Bay Initiative (also known as the Chesapeake Bay Gateways and Watertrails Network), P.L. 105-312; 54 U.S.C. §320101 note |
Captain John Smith Chesapeake National Historic Trail, 16 U.S.C. §1244(a)(25) |
|
Star-Spangled Banner National Historic Trail, 16 U.S.C. §1244(a)(26) |
||
|
U.S. Army |
Estuary Restoration, 33 U.S.C. §§2901 et seq. |
|
|
USACE |
Chesapeake Bay Nutrient Loading Resulting from Dredged Material Disposal, 33 U.S.C. §1267 note |
Aquatic Nuisance Prevention and Control, 16 U.S.C. §§4701 et seq. |
|
Chesapeake Bay Native Oyster Restoration, 33 U.S.C. §2263b |
Protection of Navigable Waters and of Harbor and River Improvements Generally – 33 U.S.C. §§400 et seq. |
|
|
Chesapeake Bay Environmental Restoration and Protection Program, Water Resources Development Act (WRDA) of 1996 (P.L. 104-303; Title V, §510); as amended by WRDA 2007 (P.L. 110-114, Title V, §5020); as amended by the Water Resources Reform and Development Act (WRRDA 2014; P.L. 113-121, Title IV, §4010), including North Beach Wetland Restoration and Sligo Creek Stormwater Management |
Regional Sediment Management, 33 U.S.C. §2326 |
|
|
Mid-Chesapeake Bay Island Ecosystem Restoration, Senate Committee on Environment and Public Works resolution, June 5, 1997; WRRDA 2014 (P.L. 113-121, Title VII, §7002). |
Continuing Authorities Program, Streambank and Shoreline Erosion Protection of Public Works and Non-Profit Public Services, Flood Control Act of 1946 (P.L. 526, §14), as amended. Including Town of Union Bridge, Solomon Creek |
|
|
Paul S. Sarbanes Ecosystem Restoration Project at Poplar Island, WRDA 1996 (P.L. 104-303, Title V, §537); WRDA 2000 (P.L. 106-541, Title III, §318); WRDA 2007 (P.L. 110-114, Title III, §3087), and WRRDA 2014 (P.L. 113-121, Title VII, §7003) |
Continuing Authorities Program, Project Modifications for the Improvement of the Environment, WRDA 1986 (P.L. 99-6, Title I, §1135), including Foster Joseph Sayers Dam |
|
|
Smith Island Environmental Restoration, WRDA 2007 (P.L. 110-114, Title I, §1001) |
North Atlantic Coastal Region Study, WRRDA 2014 (P.L. 113-121, Title IV, §4009) |
|
|
Dyke Marsh Restoration, WRDA 1974 (P.L. 93-251, Title I, §86(a)); WRDA 2007 (P.L. 110-114, Title V, §5147) |
Aquatic Ecosystem Restoration, WRDA 1996 (P.L. 104-303, Title II, §206), including Anacostia Watershed Restoration, Hurst Creek, Northwest Creek, Paint Branch Fish Passage |
|
|
Chesapeake Bay Improvements Environmental Infrastructure, WRDA 2007 (P.L. 110-114, Title V, §5158) |
Environmental Infrastructure, WRDA 1992 (P.L., 102-580, Title II, §219(f)), as amended. Includes Northeast Pennsylvania Environmental Infrastructure Program |
|
|
Chesapeake Bay Region Water Pollution Control, WRDA 2007; P.L. 110-114, Title V, §5158) |
||
|
Baltimore Metropolitan Water Resources, FY2004 Energy and Water Development Appropriations Act (E&WDAA; P.L. 108-137); FY2006 E&WDAA (P.L. 109-103) |
||
|
Chesapeake Bay Shoreline Maryland Coastal Management, Resolution of Senate Committee on Public Works, 1961; Resolution of House Committee on Public Works, 1962; Resolution of the U.S. Senate Committee on Environment and Public Works, June 28,1983; Senate Committee on Environment and Public Works Resolution dated May 23, 2001. |
||
|
Susquehanna River and Upper Chesapeake Bay Waterborne Debris Management, WRDA 1999 (P.L. 106-53, Title IV, §460) |
||
|
Hampton and Poquoson, Virginia Chesapeake Bay Shoreline Improvements, WRDA 1992 (P.L. 102-580, Title I, §114(r)) |
||
|
South Central Pennsylvania Environmental Restoration Infrastructure and Resource Protection Development Pilot Program, WRDA 1992 (P.L. 102-580, Title III, §313) |
||
|
Chesapeake Bay Beneficial Use Site Management, WRDA 1992 (P.L. 102-580, Title III, §334) |
||
|
Chesapeake Bay Low-Cost Projects, WRDA 1986 (P.L. 99-662, Title VI, §606) |
||
|
Chesapeake Bay Drought Management Study, WRDA 1986 (P.L. 99-662, Title VI, §721) |
||
|
U.S. Coast Guard |
Aquatic Nuisance Prevention and Control, 16 U.S.C. §§4701 et seq. |
|
|
USDA |
Regional Conservation Partnership Program, 16 U.S.C. §3871 |
Source: Compiled by CRS using the U.S. Code and public laws cited in the table.
Notes: EPA = U.S. Environmental Protection Agency, FWS = U.S. Fish and Wildlife Service, NOAA = National Oceanic and Atmospheric Administration, NPS = National Park Service, USACE = U.S. Army Corps of Engineers, USDA = U.S. Department of Agriculture.