Background
The Health Center Program, which is administered by the Health Resources and Services Administration within the Department of Health and Human Services, awards grants to outpatient health care facilities that provide care to medically underserved populations.1 The program's annual funding has more than tripled between FY2002 and FY2018, increasing from $1.3 billion to $5.3 billion. This funding increase—a result of both increases in annual discretionary appropriations and supplemental funding2—has resulted in more health centers, more patients seen, and more services available to these patients.3 The program's funding increase is due, in part, to the Community Health Center Fund (CHCF),4 a mandatory multibillion-dollar fund established in the Patient Protection and Affordable Care Act (ACA, P.L. 111-148, as amended) and extended in subsequent laws. The most recent two-year extension was included in the Bipartisan Budget Act of 2018 (BBA 2018, P.L. 115-123). The fund was established in 2011 and is currently available through FY2019. When the fund was established it was intended to increase health center appropriations above the level the program received in FY2008;5 however, the CHCF has partially supplanted annual appropriations since it began. The CHCF also supports the National Health Service Corps, a scholarship and loan repayment program that places providers in underserved areas including at health centers. From FY2012 through FY2018, the CHCF was that program's sole funding source.6
CHCF funds have been used for a range of health center activities including funding new health centers, increasing services provided at existing health centers, and implementing care coordination initiatives.7 CHCF funds have also been used to fund health centers in need of immediate funding, such as those in Flint, MI, which had acute health service needs due to the discovery of lead in its water supply; those in Puerto Rico and other territories, which had additional health service needs related to the Zika virus; and those in areas most affected by the opioid crisis.8
The CHCF represents more than 70% of the Health Center Program's FY2018 funding. Since its inception, the CHCF has been extended twice: first, it was extended for FY2016 and FY2017 in the Medicare Access and CHIP Reauthorization Act of 2015 (MACRA, P.L. 114-10); second, it was extended in the Bipartisan Budget Act of 2018 (BBA 2018, P.L. 115-123), which provided FY2018 and FY2019 funding. MACRA provided $3.6 billion to the CHCF for each of FY2016 and FY2017 ($7.2 billion total), while BBA 2018 provided $3.8 billion for FY2018 and $4.0 billion for FY2019 ($7.8 billion total).
This report provides information on the CHCF. Specifically, it includes information on the types of grants awarded, total funds disbursed, and the amount of CHCF funds that centers in each state and territory received.
CHCF as a Percentage of Health Center Funding
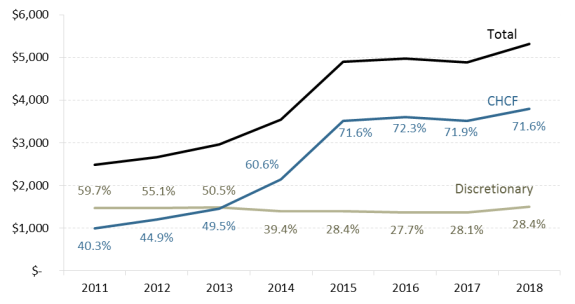
The CHCF as a total percentage of federal funding for health centers has increased from 40% to 72% from FY2011 through F2018 (see Figure 1).
|
Figure 1. The CHCF and Health Center Funding (Dollars in Millions, CHCF and Discretionary labeled with percent of total) |
 |
|
Source: CRS analysis of HRSA's Congressional Budget Justifications and P.L. 115-123. |
CHCF Grants Awarded
ACA's language creating the CHCF specified rather broad purposes—that the fund be used to "provide for expanded and sustained national investment in community health centers."9 CHCF funds have been used to support operating grants at existing health centers, including grants that are awarded competitively to existing health centers at the end of their grant cycle that seek continued funding.10 The CHCF has also been used to support a number of specific initiatives that seek to expand services and to improve the care provided by health centers (see Table 1).11
|
Name |
Description |
Funds Awarded |
|
Beacon Community Supplemental Funding |
Grants to support health center HIT adoption so as to improve health outcomes, improve care quality, and achieve cost efficiencies. |
$8.4 million (FY2011) |
|
Behavioral Health Integration |
Grants to expand behavioral health services by increasing the number of providers and services offered. |
$54.6 million (FY2014); $51.3 million (FY2015) |
|
Expanded Services |
Grants for hiring new staff to extend hours and expand care that a health center provides. |
$295 million (FY2014); $6.4 million (FY2015); $7 million (FY2016); $156 million (FY2016 for oral health) |
|
Facility Improvement |
Grants for construction and renovations to increase the number of patients served. |
$260 million (FY2016) |
|
Health Center Controlled Network-Health Information Technology (HIT) |
Grants to expand the use of advanced HIT. |
$21 million (FY2013); $123 million (FY2016) |
|
Health Center Outreach and Enrollment Assistance |
Grants to hire staff for in-person enrollment and eligibility assistance to uninsured individuals. |
$150 million (FY2013); $58 million (FY2014) |
|
HIV Service Integration |
Grants to support HIV services with primary care service integration. |
$5 million (FY2012); $6.2 million (FY2014) |
|
New Access Points |
Grants to support new health center sites. |
$28.8 million (FY2011); $128.6 million (FY2012); $19 million (FY2013); $150 million (FY2014); $270 million (FY2015); $51 million (FY2017) |
|
Opioid and Heroin Treatment |
Grants to expand substance abuse services at health centers. |
$94 million (FY2016); $350 million (FY2018) |
|
Patient-Centered Medical Homes (PCMH) |
Grants to assist facilities with meeting the requirements (including facility-related requirements) to be certified as a PCMH. |
$32 million (FY2011); $44 million (FY2012); $35.7 million (FY2014); $8.6 million (FY2016) |
|
Planning and Development |
Grants to support organizations to plan and become health centers. |
$10 million (FY2011) |
|
Quality Improvement/ Base Adjustment |
Adjustments to health center base funding for ongoing operations and quality improvement activities. |
$48 million (FY2013); $63 million (FY2015); $100 million (FY2016) |
|
State and Regional Primary Care Association |
Cooperative agreements with state and regional organizations to provide health center training and technical assistance. |
$5.2 million (FY2011); $6.4 million (FY2013) |
|
Training and Technical Assistance |
Cooperative agreements to provide technical assistance to organizations that support health centers. |
$2.8 million (FY2011) |
Sources: CRS analysis of data from the HRSA data warehouse; CRS communication with HRSA's Office of Legislation, January 5, 2015, December 30, 2016, and May 15, 2018; and HRSA and HHS press releases obtained by searching http://www.hrsa.gov and http://www.hhs.gov/news/. FY2016 funds were also used to fund health centers in Flint, MI, and the territories for Zika virus related health services.
CHCF funds were awarded from FY2011 through FY2017 to facilities and organizations in each of the 50 states, the District of Columbia, and the territories (see Table 2).
|
State |
FY2011 |
FY2012 |
FY2013 |
FY2014 |
FY2015 |
FY2016 |
FY2017 |
Totala |
|
Alaska |
$15,176 |
$17,176 |
$21,855 |
$31,370 |
$45,789 |
$48,670 |
$53,611 |
$233,648 |
|
Alabama |
$19,803 |
$23,584 |
$29,280 |
$39,000 |
$58,662 |
$55,617 |
$58,600 |
$284,546 |
|
Arkansas |
$11,634 |
$13,671 |
$16,951 |
$23,823 |
$37,286 |
$34,559 |
$39,961 |
$177,885 |
|
American Samoa |
$1,089 |
$901 |
$1,146 |
$1,899 |
$1,348 |
$2,360 |
$2,384 |
$11,127 |
|
Arizona |
$19,016 |
$20,195 |
$24,729 |
$37,004 |
$52,156 |
$63,647 |
$64,899 |
$281,647 |
|
California |
$120,943 |
$140,459 |
$178,975 |
$275,331 |
$445,460 |
$494,221 |
$493,092 |
$2,148,482 |
|
Colorado |
$25,431 |
$29,535 |
$37,523 |
$45,921 |
$62,087 |
$72,845 |
$75,681 |
$349,023 |
|
Connecticut |
$12,973 |
$15,168 |
$18,923 |
$22,080 |
$35,906 |
$45,680 |
$42,957 |
$193,687 |
|
District of Columbia |
$5,211 |
$5,852 |
$6,465 |
$9,744 |
$18,315 |
$20,258 |
$21,357 |
$87,202 |
|
Delaware |
$3,290 |
$4,372 |
$6,164 |
$6,280 |
$7,459 |
$10,225 |
$10,283 |
$48,073 |
|
Florida |
$48,992 |
$59,567 |
$73,398 |
$117,934 |
$165,216 |
$170,243 |
$169,526 |
$804,876 |
|
Federated States of Micronesia |
$423 |
$438 |
$476 |
$1,123 |
$1,836 |
$2,136 |
$2,934 |
$9,367 |
|
Georgia |
$21,338 |
$26,182 |
$37,181 |
$47,576 |
$73,665 |
$83,684 |
$86,411 |
$376,037 |
|
Guam |
$501 |
$519 |
$683 |
$1,059 |
$1,460 |
$1,361 |
$1,350 |
$6,934 |
|
Hawaii |
$6,880 |
$6,795 |
$8,606 |
$13,448 |
$21,135 |
$23,212 |
$22,050 |
$102,126 |
|
Iowa |
$8,507 |
$9,537 |
$12,555 |
$16,899 |
$27,913 |
$28,002 |
$28,604 |
$132,017 |
|
Idaho |
$9,029 |
$10,223 |
$13,255 |
$18,743 |
$32,664 |
$33,182 |
$33,898 |
$150,994 |
|
Illinois |
$41,748 |
$50,739 |
$64,450 |
$88,207 |
$132,420 |
$144,843 |
$145,608 |
$668,016 |
|
Indiana |
$12,420 |
$13,746 |
$17,216 |
$28,441 |
$48,338 |
$58,643 |
$59,062 |
$237,867 |
|
Kansas |
$7,414 |
$9,633 |
$13,030 |
$18,278 |
$28,237 |
$34,513 |
$34,203 |
$145,308 |
|
Kentucky |
$13,705 |
$17,800 |
$21,803 |
$31,162 |
$49,267 |
$54,770 |
$58,258 |
$246,765 |
|
Louisiana |
$17,792 |
$19,320 |
$24,680 |
$43,095 |
$66,806 |
$74,742 |
$77,796 |
$324,231 |
|
Massachusetts |
$24,757 |
$26,155 |
$32,222 |
$54,646 |
$81,352 |
$95,352 |
$90,527 |
$405,011 |
|
Maryland |
$13,066 |
$12,880 |
$15,336 |
$26,574 |
$34,035 |
$40,760 |
$40,902 |
$183,552 |
|
Maine |
$8,751 |
$9,965 |
$11,100 |
$17,724 |
$30,805 |
$32,886 |
$31,988 |
$143,219 |
|
Marshall Islands |
$295 |
$306 |
$338 |
$704 |
$785 |
$808 |
$756 |
$3,992 |
|
Michigan |
$23,770 |
$27,289 |
$33,868 |
$55,030 |
$89,391 |
$97,298 |
$92,650 |
$419,296 |
|
Minnesota |
$8,829 |
$10,938 |
$13,775 |
$18,646 |
$28,149 |
$29,128 |
$30,680 |
$140,145 |
|
Missouri |
$20,096 |
$22,840 |
$28,811 |
$45,233 |
$68,839 |
$83,065 |
$79,128 |
$348,012 |
|
Mississippi |
$18,939 |
$19,205 |
$23,681 |
$34,055 |
$49,672 |
$49,916 |
$52,336 |
$247,804 |
|
Montana |
$8,669 |
$10,250 |
$13,772 |
$18,292 |
$27,698 |
$29,685 |
$31,574 |
$139,940 |
|
North Carolina |
$26,443 |
$31,974 |
$42,027 |
$57,132 |
$95,453 |
$91,974 |
$102,757 |
$447,760 |
|
North Dakota |
$1,989 |
$1,818 |
$2,447 |
$4,211 |
$7,262 |
$7,445 |
$8,393 |
$33,566 |
|
Nebraska |
$3,830 |
$4,891 |
$6,211 |
$9,385 |
$12,291 |
$16,670 |
$15,322 |
$68,600 |
|
New Hampshire |
$4,280 |
$4,927 |
$7,340 |
$10,909 |
$16,817 |
$18,452 |
$20,493 |
$83,218 |
|
New Jersey |
$18,036 |
$18,534 |
$25,263 |
$37,524 |
$53,364 |
$62,578 |
$59,840 |
$275,139 |
|
New Mexico |
$17,132 |
$19,064 |
$25,423 |
$32,981 |
$43,138 |
$55,949 |
$54,541 |
$248,229 |
|
Nevada |
$3,963 |
$3,802 |
$7,030 |
$6,265 |
$11,065 |
$15,349 |
$16,079 |
$63,553 |
|
New York |
$54,434 |
$69,550 |
$84,597 |
$114,257 |
$177,512 |
$194,513 |
$196,883 |
$891,746 |
|
Northern Mariana Islands |
|
$608 |
$732 |
$738 |
$906 |
$1,041 |
$1,166 |
$5,191 |
|
Ohio |
$27,236 |
$32,877 |
$37,969 |
$60,811 |
$100,662 |
$108,040 |
$114,226 |
$481,821 |
|
Oklahoma |
$12,270 |
$15,626 |
$19,901 |
$22,992 |
$39,075 |
$43,577 |
$42,123 |
$195,564 |
|
Oregon |
$18,770 |
$23,679 |
$29,405 |
$41,563 |
$62,124 |
$67,299 |
$68,314 |
$311,154 |
|
Palau |
$358 |
$31,807 |
$40,399 |
$55,918 |
$811 |
780.218 |
732.931 |
$130,807 |
|
Pennsylvania |
$27,426 |
$24,701 |
$30,063 |
$38,782 |
$86,292 |
$89,813 |
$88,928 |
$386,005 |
|
Puerto Rico |
$19,894 |
$371 |
$292 |
$577 |
$56,486 |
$67,430 |
$62,928 |
$207,978 |
|
Rhode Island |
$7,259 |
$6,713 |
$7,671 |
$11,673 |
$20,470 |
$20,970 |
$21,034 |
$95,790 |
|
South Carolina |
$20,082 |
$23,988 |
$31,938 |
$37,320 |
$49,574 |
$60,102 |
$60,766 |
$283,770 |
|
South Dakota |
$4,150 |
$4,523 |
$5,597 |
$8,434 |
$12,625 |
$12,131 |
$13,339 |
$60,798 |
|
Tennessee |
$17,968 |
$21,473 |
$26,400 |
$36,560 |
$59,695 |
$62,397 |
$60,329 |
$284,822 |
|
Texas |
$60,674 |
$68,428 |
$86,323 |
$121,729 |
$184,926 |
$179,902 |
$186,745 |
$888,727 |
|
Utah |
$6,805 |
$6,834 |
$10,814 |
$16,712 |
$25,117 |
$29,516 |
$30,641 |
$126,440 |
|
Virginia |
$19,223 |
$22,149 |
$27,601 |
$38,361 |
$56,120 |
$64,809 |
$65,272 |
$293,535 |
|
Virgin Islands |
$673 |
$789 |
$959 |
$1,339 |
$2,368 |
$2,351 |
$2,280 |
$10,759 |
|
Vermont |
$3,791 |
$4,126 |
$5,439 |
$10,222 |
$12,865 |
$22,564 |
$18,788 |
$77,794 |
|
Washington |
$27,932 |
$30,811 |
$40,902 |
$57,496 |
$94,593 |
$95,990 |
$95,116 |
$442,840 |
|
Wisconsin |
$8,327 |
$11,069 |
$13,051 |
$18,617 |
$32,303 |
$35,536 |
$33,162 |
$152,064 |
|
West Virginia |
$13,499 |
$15,001 |
$20,198 |
$29,218 |
$46,687 |
$52,842 |
$51,149 |
$228,595 |
|
Wyoming |
$1,730 |
$1,921 |
$2,386 |
$3,999 |
$6,319 |
$6,038 |
$6,188 |
$28,581 |
|
Totalb |
$978,659 |
$1,137,296 |
$1,440,620 |
$2,075,045 |
$3,191,077 |
$3,502,371 |
$3,530,603 |
$15,855,677 |
|
CHCF Allocationc |
$1,000,000 |
$1,200,000 |
$1,465,000c |
$2,145,000c |
$3,510,000c |
$3,600,000 |
$3,516,000c |
$16,436,000 |
Source: CRS analysis of HRSA's Datawarehouse (at http://www.hrsa.gov/data-statistics/index.html) and of data obtained from HRSA, personal communication, February 8, 2018.
Notes: Blank cells indicate that no funds were received by that state or territory in that year.
a. Total indicates the cumulative amount a state has received from the CHCF since the fund began in FY2011.
b. Total indicates amount of grants awarded; it is lower than the amount appropriated to the CHCF as some funds are used by HRSA to administer these grant programs.
c. The FY2013, FY2014, FY2015, and FY2017 amounts were reduced by the sequester required under the Budget Control Act (P.L. 112-25). For more information, see CRS Report R43937, Federal Health Centers: An Overview.