Introduction
Cumulative Funding History
This report provides a cumulative history of Department of Energy (DOE) funding for renewable energy compared with funding for the other energy technologies—nuclear energy, fossil energy, energy efficiency, and electric systems. Specifically, it provides a comparison that covers cumulative funding over the past 10 years (FY2009-FY2018), a second comparison that covers the 41-year period since DOE was established at the beginning of FY1978 through FY2018, and a third comparison that covers a 71-year funding history (FY1948-FY2018) for DOE and predecessor agencies.
FY2017 and FY2018 Appropriations
The final amount of FY2017 Energy and Water Development appropriations for DOE energy technologies was established by the Consolidated Appropriations Act, 2017 (P.L. 115-31), which was signed by the President on May 5, 2017. The act contained appropriations for all FY2017 appropriations bills, including Energy and Water Development programs (Division D).1
Final funding for FY2018 was set by the Consolidated and Further Continuing Appropriations Act, 2018 (P.L. 115-141), which was signed by the President on May 23, 2018. Funding levels for DOE are included in Energy and Water Development programs (Division D).2
Guide to Tables and Charts
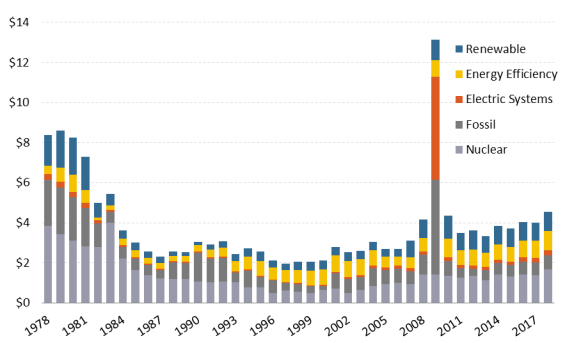
Figure 1 presents the fiscal year funding totals for DOE in real terms (2016 dollars) since 1978 for each technology or energy source.
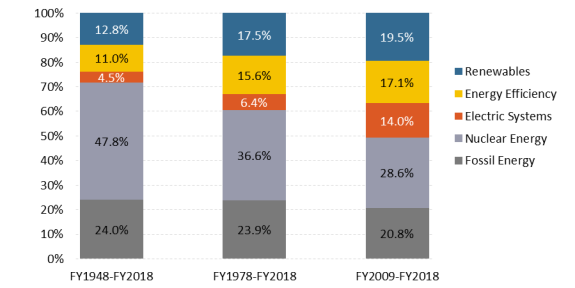
Table 1 shows the cumulative funding totals in real terms (2016 dollars) for the past 10 years (first column), 41 years (second column), and 71 years (third column). Table 2 converts the data from Table 1 into relative shares of spending for each technology or energy source, expressed as a percentage of total spending for each period.
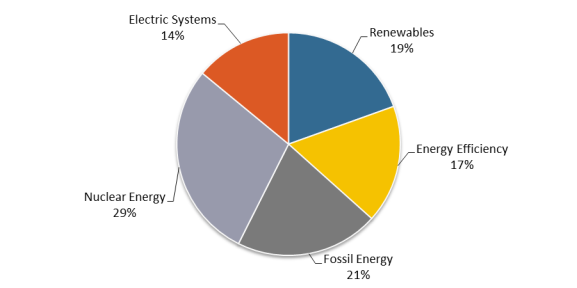
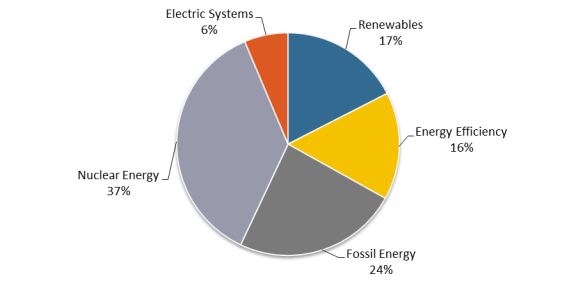
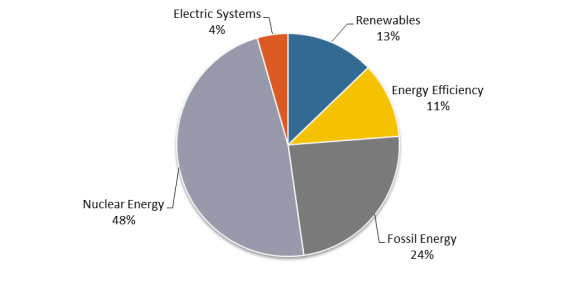
Figure 2 displays the data from the first column of Table 2 as a pie chart. That chart shows the relative shares of cumulative DOE spending for each technology or energy source over the 10 years from FY2009 through FY2018. Figure 3 provides a similar chart for the period from FY1978 through FY2018. Figure 4 shows a chart for FY1948 through FY2018.
Background
Evolution of the Department of Energy
The availability of energy—especially gasoline and other liquid fuels—played a critical role in World War II.3 Another energy-related factor was the application of research and development (R&D) to the atomic bomb (Manhattan Project) and other military technologies. During the post-World War II era, the federal government began to apply R&D to the peacetime development of energy sources to support economic growth. At that time, the primary R&D focus was on fossil fuels and new forms of energy derived from nuclear fission and nuclear fusion.
The Atomic Energy Act of 1946 established the Atomic Energy Commission (AEC), which inherited all of the Manhattan Project's R&D activities and placed nuclear weapon development and nuclear power management under civilian control.4 A major focus of the AEC was research on "atoms for peace," the use of nuclear energy for civilian electric power production.5 Prompted by the oil embargo declared by the Organization of Arab Petroleum Exporting Countries in 1973, the Federal Energy Administration was established in mid-1974.6 In early 1975, the Energy Research and Development Administration (ERDA) was established, incorporating the AEC and several energy programs that had been operating under the Department of the Interior and other federal agencies.7
The Department of Energy (DOE) was established by law in 1977,8 incorporating activities of the FEA and ERDA. All of the energy R&D programs—fossil, nuclear, renewable, and energy efficiency—were brought under its administration. DOE also undertook a small program in energy storage and electricity system R&D that supports the four main energy technology programs.9
Evolution of Energy Technology R&D Funding
From FY1948 through FY1977, the majority of federal government support for energy R&D focused on fossil energy and nuclear power technologies.10 Total spending on fossil energy technologies over that period amounted to about $17.1 billion, in constant FY2016 dollars. The federal government spent about $51.6 billion (in constant FY2016 dollars) during that period for nuclear energy R&D (in all the tables and figures in this report, the "nuclear" category includes both fission and fusion).11
The energy crises of the 1970s spurred the federal government to expand its R&D programs to include renewable (wind, solar, biomass, geothermal, hydro) energy and energy efficiency technologies. Comparatively modest efforts to support renewable energy and energy efficiency began during the early 1970s.12 Since FY1978, DOE has been the main supplier of energy R&D funding compared to other federal agencies.13
In real (constant dollar) terms, funding support for all four of the main energy technologies skyrocketed during the 1970s to a combined peak in FY1979 at about $8.6 billion (2016 constant dollars). Funding then dropped steadily, to about $2.0 billion (2016 dollars) per year during the late 1990s. Since then, funding has increased gradually—except that the American Recovery and Reinvestment Act of 2009 (P.L. 111-5) provided a one-year spike of $13 billion (2016 dollars) in FY2009. For FY2018, DOE energy R&D funding stood at nearly $4.5 billion (2016 dollars).
|
Figure 1. Fiscal Year R&D Funding of DOE Energy Technologies (billions of 2016 dollars) |
 |
|
Source: DOE Budget Authority History Table by Appropriation, May 2007; DOE Congressional Budget Requests (several years); Deflator Source: The Budget for Fiscal Year 2019. Historical Tables. Table 10.1. Gross Domestic Product and Deflators Used in the Historical Tables, 1940-2023. Notes: Column for FY2009 includes funding provided in the American Recovery and Reinvestment Act of 2009 (P.L. 111-5). |
|
Technology |
Period |
||||||||
|
FY2009-FY2018 |
FY1978-FY2018 |
FY1948-FY2018 |
|||||||
|
Renewable Energy |
|
|
|
||||||
|
Energy Efficiency |
|
|
|
||||||
|
Fossil Energy |
|
|
|
||||||
|
Nuclear Energy |
|
|
|
||||||
|
Electric Systems |
|
|
|
||||||
|
Total |
|
|
|
||||||
Sources: DOE Budget Authority History Table by Appropriation, May 2007; DOE Congressional Budget Requests (several years); DOE (Pacific Northwest Laboratory), An Analysis of Federal Incentives Used to Stimulate Energy Production, 1980. Deflator Source: The Budget for Fiscal Year 2019. Historical Tables. Table 10.1. Gross Domestic Product and Deflators Used in the Historical Tables, 1940-2023.
Table 2. DOE Energy Technology Share of Funding
(percentage; derived from Table 1)
|
Technology |
Period |
||||||||
|
FY2009-FY2018 |
FY1978-FY2018 |
FY1948-FY2018 |
|||||||
|
Renewable Energy |
|
|
|
||||||
|
Energy Efficiency |
|
|
|
||||||
|
Fossil Energy |
|
|
|
||||||
|
Nuclear Energy |
|
|
|
||||||
|
Electric Systems |
|
|
|
||||||
|
Total |
|
|
|
||||||
Sources: DOE Budget Authority History Table by Appropriation, May 2007; DOE Congressional Budget Requests (several years); DOE (Pacific Northwest Laboratory), An Analysis of Federal Incentives Used to Stimulate Energy Production, 1980; DOE Conservation and Renewable Energy Base Table. February 1990. Deflator Source: The Budget for Fiscal Year 2019. Historical Tables. Table 10.1. Gross Domestic Product and Deflators Used in the Historical Tables, 1940-2023.