Introduction
After rebounding from recession between 2009 and 2014, U.S. manufacturing output has grown little since the second half of 2014. Over the same period, employment in the U.S. manufacturing sector has increased slightly. These trends defy expectations that forces such as higher labor costs in the emerging economies of Asia, heightened concern about the risk of disruptions to long, complex supply chains, and the development of inexpensive domestic supplies of natural gas would bring a surge of factory production and manufacturing jobs in the United States.1
Changes in technology, business organization, and employment practices make it increasingly difficult to evaluate the state of the manufacturing sector. It appears that government statistics attribute a growing share of manufacturing-related jobs and output to other sectors of the economy, notably information, professional and business services, and wholesale trade. The extent to which output and employment in these sectors are related to manufacturing is difficult to quantify. However, evidence suggests that even strong growth in manufacturing is likely to have a modest impact on overall job creation, particularly for workers with lower levels of education.
Employment in the Manufacturing Sector
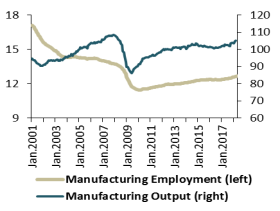
At the start of the 21st century, 17.1 million Americans worked in manufacturing. This number declined during the recession that began in March 2001, in line with the historic pattern. In a departure from past patterns, however, manufacturing employment failed to recover after that recession ended in November 2001 (see Figure 1). By the time the most recent recession began, in December 2007, the number of manufacturing jobs in the United States had fallen to 13.7 million. Currently, 12.6 million workers are employed in the manufacturing sector.
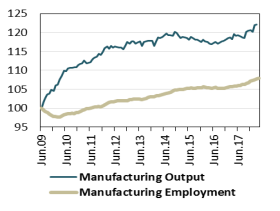
The output of U.S. manufacturers hit a cyclical bottom in June 2009. Since that time, a 22% increase in manufacturing output has been accompanied by only an 8% increase in manufacturing employment (see Figure 2). The low point in manufacturing employment was reached in February 2010. Since that time the manufacturing job count has risen 10%.2
There is no single cause of the weakness in manufacturing employment. A sharp increase in the bilateral U.S. trade deficit with China following that country's accession to the World Trade Organization in 2001 contributed importantly to manufacturing job loss in the first half of the last decade, but changes in the bilateral balance in goods trade since 2006 are not associated with changes in employment of factory workers in the United States.3 Cyclical forces aside, at least three distinct factors limit the prospects for job creation in the manufacturing sector, even if domestic production gains market share from imports.
- Some manufacturing industries, notably apparel and footwear, are tied to labor-intensive production methods that have proven difficult to automate. With labor costs accounting for a much higher share of value added in these industries than in manufacturing as a whole, declining import barriers allowed imports from low-wage countries, particularly in East Asia, to displace domestic production. From 1.3 million workers in 1980, U.S. employment in apparel manufacturing has fallen to 117,000. Leather manufacturing has seen a similar employment decline. Over the same period, U.S. output of apparel fell by 86%, and output of leather products fell by 81%.
- In other industries, technological improvements have enabled manufacturers to expand output without adding workers.4 Steelmaking offers such an example: the 83,000 people working in the industry in 2017 produced 8% more steel than nearly 399,000 workers did in 1980.5
- Secular shifts in demand have dimmed employment prospects in some industries despite the general recovery in manufacturing output. Paper consumption, for example, was once closely associated with economic growth, but no longer; paper output has stabilized at a level about 20% lower than in the late 1990s, contributing to a 40% drop in industry employment over the same period. As cigarette consumption has waned, output in tobacco products manufacturing is down 57% since the most recent peak in 1996, and employment has fallen 55%.6
These changes have resulted in a significant shift in the composition of manufacturing employment even as most manufacturing industries have experienced declining employment. Food manufacturing, which two decades ago accounted for 1 in 11 manufacturing jobs, now accounts for 1 in 8; it is one of the few manufacturing sectors in which employment has grown. Transportation equipment, fabricated metal products, food manufacturing, and plastics and rubber manufacturing have added workers since the end of the last recession in 2009, and account for larger shares of manufacturing employment. Apparel, textiles, printing, and computers and electronic products now account for substantially smaller shares of manufacturing employment than was formerly the case (see Table 1).
|
Industry |
2001 Share |
2009 Share |
2018 Share |
||
|
Transportation Equipment |
|
11.22% |
13.07% |
||
|
Food |
|
11.68% |
12.91% |
||
|
Fabricated Metal Products |
|
11.36% |
11.61% |
||
|
Machinery |
|
9.02% |
8.77% |
||
|
Computers and Electronic Products |
|
9.58% |
8.40% |
||
|
Chemicals |
|
6.56% |
6.59% |
||
|
Plastics and Rubber |
|
5.30% |
5.76% |
||
|
Misc. Durables Manufacturing |
|
4.82% |
4.71% |
||
|
Printing |
|
4.45% |
3.47% |
||
|
Nonmetallic Mineral Products |
|
3.38% |
3.32% |
||
|
Electrical Equipment |
|
3.22% |
3.15% |
||
|
Furniture |
|
3.38% |
3.12% |
||
|
Primary Metals |
|
3.23% |
3.01% |
||
|
Paper |
|
3.38% |
2.94% |
||
|
Apparel |
|
1.41% |
0.93% |
||
|
Textiles |
|
1.07% |
0.88% |
Source: Bureau of Labor Statistics, Current Employment Statistics for January of respective year.
Note: Not all manufacturing industries are included.
The Changing Character of Manufacturing Work
In the public mind, the word "factory" is associated with the concept of mass production, in which large numbers of workers perform repetitive tasks. While mass production is still an important aspect of manufacturing, routine production functions, from welding joints in truck bodies to removing plastic parts from a molding machine, have proven susceptible to automation. This has had important consequences for the nature of work in manufacturing establishments and for the skill requirements of manufacturing workers.
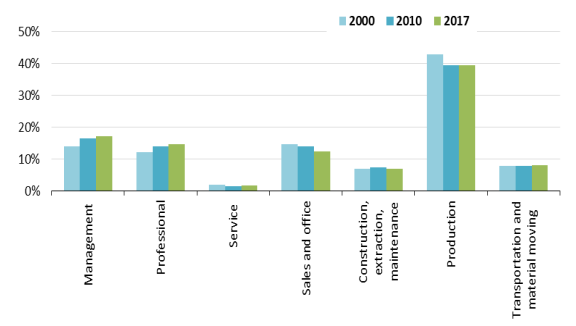
Goods production is no longer the principal occupation of workers in the manufacturing sector. Only two in five manufacturing employees are directly involved in making things. That proportion fell 3.4 percentage points between 2000 and 2017. Employment in other occupations within the manufacturing sector, notably office clerical work, has also declined (see Figure 3). As of 2017, 32% of all manufacturing workers held management and professional jobs.7
|
Figure 3. Manufacturing Employment by Occupation Percentage of manufacturing workforce |
 |
|
Source: Bureau of Labor Statistics, Current Population Survey, Table 17, http://www.bls.gov/cps/cpsaat17.htm. |
In many manufacturing industries, the shift to higher skill requirements is even more pronounced. Total employment in the U.S. computer and electronic product manufacturing industries has declined due to automation, sharp falls in demand for certain products once produced in the United States (notably television tubes and audio equipment), and changed production economies that cause manufacturers to concentrate worldwide production in a small number of locations. Of the 1.04 million people employed in this industry in 2017, 28% were engaged in production occupations, for which a high school education may be sufficient and for which workers received median annual pay of $35,010. Some 21% of the industry's workers were in architecture and engineering occupations paying a median annual wage of $87,010, and another 13% were in computer and mathematical occupations with a median annual wage of $104,120; the latter two occupational categories require much higher education levels than production work. Similarly, some 32% of the workers in the pharmaceutical manufacturing industry are involved with production. Many of the rest have scientific skills associated with higher education levels.8
The increasing demand for skills in manufacturing is most visible in the diminished use of "team assemblers"—essentially, line workers in factories and warehouses. In May 2016, employment in this occupation, which typically requires little training and no academic qualifications, was 1.3 million, down 15% since 2000. Some 862,300 team assemblers worked in manufacturing in 2016, representing less than 7% of manufacturing jobs. This type of job was once the core of manufacturing. Now, 19% of all team assemblers work for employment agencies, which furnish workers to other companies on an as-needed basis. Team assemblers working for employment agencies earned an average of $12.43 per hour, some 21% less than those employed directly by manufacturing companies.9
The changing occupational mix within the manufacturing sector is mirrored by changing educational requirements. In 2000, 53% of all workers in manufacturing had no education beyond high school. Between 2000 and 2017, that share dropped by 11 percentage points, even as the proportion of manufacturing workers with bachelor's degrees or graduate degrees rose by 9 percentage points, to 31%. Given that college-educated workers generally command significantly higher pay in the labor market than high-school dropouts and high-school graduates, it is unlikely that manufacturers would willingly hire more-educated workers unless there is a payoff in terms of greater productivity.
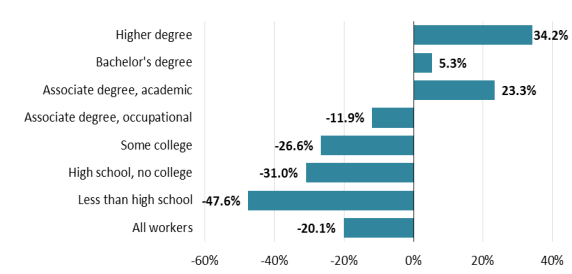
Despite the significant loss of manufacturing jobs between 2000 and 2017, the number of manufacturing workers with graduate degrees increased by approximately 343,000, or 34% (see Figure 4). Employment of workers with associate (community college or proprietary school) degrees in academic fields rose 23%, or approximately 150,000 jobs, over that period, while workers with associate degrees in occupational fields, which prepare students for immediate vocational entry and typically require less coursework in English, mathematics, and science, declined by 95,000.10
|
Figure 4. Manufacturing Employment by Worker Education Percentage change, 2000-2017 |
 |
|
Source: Bureau of Labor Statistics, Current Population Survey. |
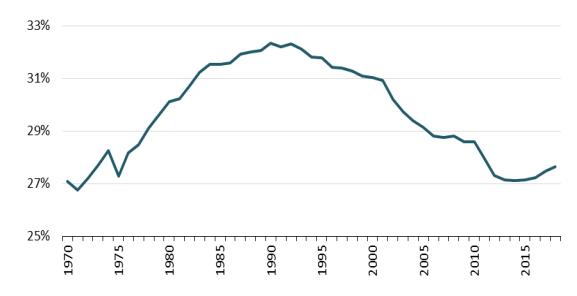
The proportion of manufacturing workers who are female has fallen from 32% as recently as 1993 to 28% currently (see Figure 5). Women have long accounted for a large share of employment in some of the industries that have experienced the steepest drops in employment, notably apparel, textiles, and electrical manufacturing. The female workforce was significantly less educated than the male workforce in manufacturing: in 2000, only 41% of female manufacturing workers had any education beyond high school, compared with 61% of their male counterparts.
This gender gap in education has closed since 2000, due largely to the departure of these less educated women from the manufacturing workforce. The number of female manufacturing workers with no education beyond high school fell 46% from 2000 to 2016. As a result, the number of years of schooling of female manufacturing workers is now very similar to that of males in manufacturing. Some 32% of women workers in manufacturing in 2017 held four-year college degrees or higher degrees, almost identical to the proportion for men. Some 11% of female manufacturing workers had not completed high school; the corresponding share of male manufacturing workers was around three percentage points less.
The female share of the manufacturing workforce has increased since reaching a low of 27.11% in 2014. Since then, manufacturers have added 200,000 workers along with 300,000 male workers.
|
Figure 5. Manufacturing Employment by Gender Percentage of manufacturing workforce that is female |
 |
|
Source: Bureau of Labor Statistics, Current Employment Statistics. Note: Data are for January of each year and are not seasonally adjusted. |
The Shrinking Wage Premium
Policymakers traditionally have attached special importance to manufacturing because manufacturers appear to pay a wage premium, compared to employers in other industries. Based on pay, a 2012 U.S. Department of Commerce publication asserted, "manufacturing jobs are good jobs." According to that source, manufacturing jobs offered average hourly pay of $29.75 in 2010, compared to $27.47 for nonmanufacturing jobs. Including employer-provided benefits, the Commerce Department reported, manufacturing workers earned 17% more per hour than workers in other industries.11 Those other industries, it should be noted, include the low-paying retailing and leisure and hospitality industries, which jointly account for 22% of nonfarm employment, as well as higher-paying industries such as construction and utilities.
Such comparisons, however, are not as straightforward as they may appear. At least some of the purported manufacturing wage premium exists because manufacturers employ far fewer young workers than industries with lower pay. In the lowest-paid sectors of the economy, a large share of the workforce—14% in leisure and hospitality, 7% in retailing—is under age 20, compared with only 1% of manufacturing workers.12 Also, large numbers of workers in those two lower-paying industries are employed part time; the average work week is around 25 hours in leisure and hospitality and 30 hours in retailing, versus 42 hours in manufacturing.13 Full-time workers in any industry are more likely to receive benefits than part-time workers.
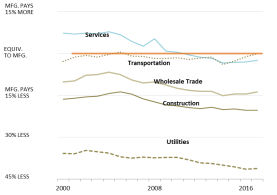
Contrary to the popular perception, production and nonsupervisory workers in manufacturing, on average, earn significantly less per hour than nonsupervisory workers in industries that do not employ large numbers of teenagers, that have average workweeks of similar length, and that have similar levels of worker education. For example, nonsupervisory workers in manufacturing earned an average hourly wage of $21.29 in 2017, compared with $26.73 for nonsupervisory construction workers and $36.21 for nonsupervisory workers in the electric utility industry. Moreover, average wages for production and nonsupervisory workers in manufacturing have declined over time, compared to those in other industries, with the exceptions of retailing and transportation (see Figure 6). In 2000, for example, nonsupervisory workers in manufacturing earned 5.1% more, on an hourly basis, than nonsupervisory workers in the services sector; in 2017, they earned 2.4% less than services workers, on average.14
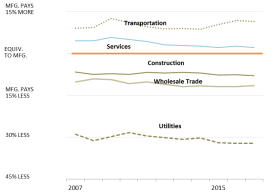
One criticism of this analysis is that the Bureau of Labor Statistics (BLS) considers a smaller proportion of employees to be production and nonsupervisory workers in manufacturing than in other sectors of the economy, so that comparing the wages of this subset of workers may lead to misleading conclusions about relative pay in manufacturing.15 One alternative is to look at relative earnings of all workers rather than just nonsupervisory workers. These data, which are available only since 2007, show more modest relative declines in manufacturing wages than appear in the figures for production and nonsupervisory workers (see Figure 7). However, the wages of highly paid workers, including managers and executives, are included in these data, so the averages may not be reflective of the relative pay of factory-floor workers.
|
|
|
A recent econometric analysis16 draws on data from a different BLS survey to estimate that workers without college educations earn average hourly wages 7.8% higher in manufacturing than elsewhere in the private sector. It concludes that "there remains a manufacturing wage premium, but that it has substantially fallen since the 1980s."17 The study adjusts the data for gender, experience, education, race, ethnicity, and region of the country, so it provides an answer to the question, "Is an individual who works in manufacturing likely to earn a higher hourly wage than an individual with similar characteristics who works in another private-sector industry?" However, adjusting for individual characteristics may obscure broader trends in relative wages of manufacturing workers. For example, the share of manufacturing workers identifying themselves as "Black or African American" and "Hispanic or Latino" has been increasing. On average across all industries, black and Hispanic workers earn less than non-Hispanic white workers. Hence, it is arithmetically possible that a growing proportion of manufacturing workers earns a wage premium relative to what those individuals could earn in other industries, even as the wage premium for manufacturing workers overall has disappeared.18
Whether manufacturing pays higher wages than other types of work attracting a similar workforce depends in part on the location and type of industry. In 2010, according to BLS, the average hourly wage for all workers in manufacturing was higher than the average for all private-sector workers in 29 of the 46 states for which data were available. By 2017, the average manufacturing wage exceeded the private-sector average in 25 of 46 states.19 The national average hourly wage for production workers in durable-goods manufacturing, including such industries as transportation equipment and computers and electronic products, $22.25, is well above the $19.80 average in non-durables manufacturing, which includes such low-paying industries as food, textiles, and apparel.
Traditionally, manufacturing employers have tended to offer more generous employee benefits than those in other industries. This was due mainly to the comparatively large union presence in the manufacturing sector; in 2000, for example, employers of blue-collar union workers in manufacturing spent nearly twice as much per hour worked on benefits as employers of blue-collar non-union workers in manufacturing.20 While manufacturing employers, on average, still spend more on benefits than private-sector employers in general, the differential has diminished in recent years, according to BLS data (see Table 2).21
|
Year |
Manufacturing |
All Private Sector |
Manufacturing Premium |
|
2000 |
$7.53 |
$6.37 |
18.2% |
|
2005 |
$10.69 |
$8.54 |
25.2% |
|
2010 |
$11.15 |
$9.75 |
14.4% |
|
2017 |
$13.73 |
$12.41 |
10.6% |
Source: Bureau of Labor Statistics, Employer Costs for Employee Compensation, various years.
Note: Benefits include paid leave, supplemental pay, insurance, retirement and savings benefits, and legally required benefits.
On balance, modest job creation in manufacturing has not been accompanied by an improvement in the average position of manufacturing workers, relative to those in other sectors. Some manufacturing workers appear to have done well: the average hourly wage of workers in petroleum refining rose 46% between 2008 and 2017. On the other hand, average hourly wages in motor vehicle, auto parts, and rubber products manufacturing were lower in 2017 than in 2008.22 Although workers in some manufacturing industries earn relatively high wages, the assertion that the manufacturing sector as a whole provides better wages and benefits than the rest of the economy is increasingly difficult to defend. However, a considerable share of manufacturing-related work is performed in other sectors of the economy, some of which have much higher average wages than the manufacturing sector itself.
Manufacturing-Related Work in Other Sectors
Under current statistical practices, whether an activity is classified as manufacturing depends largely on where it is conducted. Government statistical agencies track most types of economic activity at the level of the establishment—that is, a single facility or business location—rather than at the level of a firm that may own multiple establishments or an enterprise that may own many firms. As a general rule, if an establishment is "primarily engaged" in transforming or assembling goods, then all output from that establishment is considered output of the manufacturing sector, and all workers (except those employed by outside contractors) are considered manufacturing workers.
Thus, if a firm locates its product design employees at a U.S. facility that is primarily engaged in producing goods, those designers will likely be counted as working in a manufacturing establishment, and their work will add to the total value added created in U.S. manufacturing. If, however, the product designers work at a separately located design center, they will probably be considered to work in an industrial design establishment, not a manufacturing establishment. In that case, they will be counted as industrial design workers, and their value added will be attributed to the professional, scientific, and technical services sector, not to the manufacturing sector.23 The same will be true if the product designers at a manufacturing establishment are employed by a separate firm rather than by the manufacturer.
One might identify four separate groups of U.S. workers whose jobs are related to manufacturing:
- Production employees of manufacturing establishments: approximately 8.6 million workers at the end of 2016.
- Nonproduction employees of manufacturing establishments: approximately 3.7 million workers.
- Workers producing manufactured goods but employed by nonmanufacturing establishments: number unknown.
- Workers producing services and software used in manufacturing but employed by nonmanufacturing establishments: number unknown.
Data related to the first two groups are generally captured by government statistics depicting the manufacturing sector. Data related to the roles of workers in the last two groups are far more tenuous.
Information Technology
Establishments in the computer systems design and related services industry employed a total of 1.9 million Americans in 2015. Rough calculations suggest that perhaps 23% of the work hours in this industry, equivalent to 447,000 jobs, might have been considered manufacturing work if the workers were employed by manufacturing establishments (Table 3).24
Table 3. Manufacturing Employment Potentially Attributable to the Computer Systems Design and Related Services (CSD) Industry, 2015
|
Line |
Statistic |
Output ($bn) |
Employment |
|
A |
CSD direct employment in 2015 |
1,911,400 |
|
|
B |
CSD total output in 2015 |
$462.7 |
|
|
C |
CSD sales to manufacturers |
$16.6 |
|
|
D |
CSD sales to manufacturers as share of CSD output (C/B) |
3.6% |
|
|
E |
CSD employment attributable manufacturing inputs (D*A) |
68,424 |
|
|
F |
CSD sales for private nonresidential investment in IP |
$236.5 |
|
|
G |
Total private nonresidential investment in IP |
$717.9 |
|
|
H |
Investment by manufacturers in IP |
$278.0 |
|
|
I |
Manufacturers' investment in IP as share of total (H/G) |
38.7% |
|
|
J |
CSD output possibly attributable to manufacturers' investment in IP (F*I) |
$91.6 |
|
|
K |
CSD sales of IP to manufacturers as share of output (J/B) |
19.8% |
|
|
L |
CSD employment possibly attributable to manufacturers' investment in CSD IP (K*A) |
378,260 |
|
|
M |
Manufacturing-like employment in CSD (E+L) |
446,684 |
Source: CRS. See note 23.
Note: IP=intellectual property. Figures subject to rounding.
Another 378,000 U.S. workers are employed in software publishing, an industry in which employment has been rising approximately 6% annually. An unknown number of these workers are involved in writing and testing computer software that is eventually embedded in manufactured goods. However, in government statistics these workers are allocated to the information sector, and they are not counted as part of the manufacturing workforce.
Bundled Services
Anecdotal evidence suggests that a growing proportion of manufactured goods are sold in conjunction with after-sale services. For example, Boeing Corp., an aircraft manufacturer, recently set a goal of $50 billion of annual revenue from services such as supplying spare parts, modifying and repairing aircraft, training pilots, and monitoring aircraft systems during flights.25 Many other manufacturers are reshaping themselves to be service providers as well, attracted by the prospect of continuing revenue streams from customers rather than one-time payments.26
It is possible that a manufacturer might demand a different price for a good sold as a stand-alone product than for the same good when bundled with a service contract. In such a case, the amount of the product's value to attribute to the manufacturing sector rather than the "other services" sector, which includes machinery and equipment repair and maintenance, may be arbitrary.27 Government data collectors may not be able to capture the value of the good separately from the value of the bundled services, and may not be able to distinguish the workers involved in the original production process from those providing related services.
Factoryless Goods Production/Contract Manufacturing
Factoryless goods producers are firms that design products to be manufactured and own the finished goods but do not engage directly in physical transformation. The transformation or assembly of the goods they sell is done by external suppliers, known as contract manufacturers, in the United States or abroad, although the factoryless goods producer may be closely involved in its contract manufacturers' operations. Examples might include a U.S.-based footwear company that engages other firms to produce the shoes it designs and markets,28 and a "fabless" semiconductor company that contracts with an unrelated "foundry" to manufacture its chips.29
It is impossible to identify factoryless goods producers with certainty; responses to related questions on government surveys are confidential, and companies' annual reports filed with the Securities and Exchange Commission may not provide sufficient detail to determine whether they own manufacturing establishments. Alphabet Inc., parent of Google Inc., appears to meet the definition. Alphabet generated 86% of its revenue in 2017 from delivering online advertising. The company also sells computers, telephones, and security systems to consumers; designs and oversees production of computer servers used in its data centers; and designs semiconductors used in computers and smartphones.30 In 2012 a company official referred to Google as "probably ... one of the largest hardware manufacturers in the world." However, according to Alphabet's 2017 annual financial report, "We rely on third parties to manufacture many of our assemblies and finished products," leaving the question of whether Alphabet owns and operates its own manufacturing facilities unanswered.31 It is unclear whether any Alphabet employees are categorized as manufacturing workers and whether any of the company's sales are registered as manufacturing output.
According to Census Bureau estimates, at least 54,000 nonmanufacturing firms employing 3.4 million workers purchased contract manufacturing services in 2012.32 Many of the tasks performed by the employees of the purchaser firms may be identical to those performed by employees of manufacturing establishments in management, professional, sales, office, and transportation occupations. However, as the facilities owned by factoryless goods producers are usually classified as wholesale, retail, or professional, scientific, and technical service establishments rather than manufacturing establishments, it is likely that few if any of their workers are counted as manufacturing workers.
Most contract manufacturing services are provided by establishments in the manufacturing sector, either in the United States or abroad. At the same time, however, more than 20,000 U.S. enterprises whose primary business is not manufacturing reported providing contract manufacturing services in 2012. These enterprises—an "enterprise" may own one or many establishments or firms—collectively employed 1.5 million workers (Table 4). The number of those 1.5 million workers who were engaged in manufacturing-related work cannot be determined from published data. Nor is it known how many of those workers were captured as manufacturing-sector workers in government data.33
Table 4. Characteristics of U.S. Enterprises Providing Contract Manufacturing
Ranked by number of contract manufacturers
|
Sector |
Number of Contract Manufacturers in Sector |
Total Employment of Contract Manufacturers in Sector |
||
|
Manufacturing |
14,683 |
2,372,674 |
||
|
Professional, scientific, and technical services |
5,042 |
230,648 |
||
|
Wholesale trade |
4,699 |
156,276 |
||
|
Construction |
2,244 |
67,355 |
||
|
Retail trade |
2,130 |
659,501 |
||
|
Accommodation and food services |
1,686 |
73,965 |
||
|
Other |
4,332 |
347,253 |
||
Source: U.S. Census Bureau, Enterprise Statistics: 2012 Enterprise Tables, Table 7.
Note: An enterprise may have establishments in multiple sectors and may control more than one firm.
The definitional questions associated with factoryless goods producers have proven controversial. In 2010, U.S. statistical agencies proposed to categorize factoryless goods producers as manufacturers starting in 2017.34 This change would have increased both the number of individuals counted as manufacturing workers and the reported value added of the manufacturing sector.35 The proposal met with strong objections. In 2014, the Office of Management and Budget ordered the change postponed, citing the poor quality of statistical data about factoryless producers.36 As a result, a significant amount of manufacturing-like work and value added is not attributed to manufacturing in government statistics.
Employment Services Firms
Manufacturers make significant use of workers employed by temporary help agencies and other employment services firms in addition to their own employees. According to estimates based on Bureau of Labor Statistics data, 983,904 people in typical manufacturing production occupations worked for employment services firms in May 2017. They typically earn $2-$3 less per hour than workers in the same occupation who are employed directly by manufacturers (Table 5).37 The overwhelming majority of employment service firms' employees who work in manufacturing are engaged on a temporary basis.38
|
Occupation |
Number of Workers |
Hourly Mean Wage |
Corresponding Mean Wage of Manufacturing Workers |
|
First-line supervisors of production and operating workers |
4,565 |
$28.29 |
NA |
|
Assemblers and fabricators |
202.793 |
$13.56 |
$17.26 |
|
Food processing workers |
17,816 |
$11.89 |
$13.96 |
|
Metal and plastic workers |
79,348 |
$16.08 |
$19.35 |
|
Printing workers |
4,964 |
$14.82 |
$17.92 |
|
Textile, apparel, and furnishing workers |
8,670 |
$11.68 |
$13.87 |
|
Woodworkers |
4,352 |
$13.17 |
$15.67 |
|
Plant and system operators |
1,335 |
$25.35 |
$30.37 |
|
Other production occupations |
305,499 |
$13.43 |
$17.84 |
|
Hand laborers and material movers |
354,444 |
$12.28 |
$14.48 |
|
Total |
983,904 |
Source: CRS calculations based on Bureau of Labor Statistics, Occupational Employment Statistics Query System, http://data.bls.gov/oes. See also note 37.
It is likely that many nonproduction workers in manufacturing establishments are employed by employment services as well. This includes workers in office, maintenance, and food service occupations. The lack of comparable data makes it difficult to ascertain how the number of workers employed within manufacturing establishments as employees of employment services has changed over time. One recent study finds that the number of temporary-help workers in manufacturing came to 9.7% of the number of workers employed directly by manufacturers in 2015, up from 6.9% in 2005.39
The Decline of the Large Factory
The stereotypic U.S. manufacturing plant has thousands of employees filling a cavernous factory hall. This stereotype is outdated. Of more than 291,000 manufacturing establishments40 counted by the Census Bureau in March 2016, only 886 employed more than 1,000 workers (see Table 6). This is up from the modern low of 795 in 2010, but remains far below the level of the 1990s. Those very large factories, the ones most prominent in public discussion of manufacturing, collectively employ 1.8 million workers, 16% of the manufacturing workforce and slightly more than 1% of the U.S. labor force.41
As the number of factories in all size classes declined, mean employment in U.S. manufacturing establishments fell from 46.3 workers in 1998 to 36.2 in 2010. Since then, the number of factories in all size classes above 100 employees has edged higher, and mean employment size has risen to 39.6 workers.
|
99 or fewer |
100-249 |
250-499 |
500-999 |
1,000 or more |
|
|
1998 |
330,956 |
22,499 |
7,968 |
3,322 |
1,504 |
|
2004 |
309,909 |
19,227 |
6,349 |
2,486 |
1,112 |
|
2010 |
277,148 |
15,428 |
4,764 |
1,847 |
795 |
|
2016 |
266,745 |
16,421 |
5,397 |
2,094 |
886 |
|
Change, 1998-2016 |
-19% |
-27% |
-32% |
-37% |
-41% |
Source: Census Bureau, County Business Patterns by Employment Size Class, various years.
The decline in the number of large factories was widespread across the manufacturing sector, with the exception of the food processing industry. Four industries—chemicals, computers and electronic products, machinery, and transportation equipment—accounted for more than half the decline in the number of factories with more than 1,000 workers between 1998 and 2010. More recently, however, the number of such large factories has increased in several industries, notably food, chemicals, and transportation equipment manufacturing (see Table 7),42 suggesting that existing plants have added workers as business conditions have improved.
|
Industry |
1998 |
2004 |
2010 |
2016 |
|
Food |
169 |
182 |
167 |
178 |
|
Chemicals |
107 |
75 |
60 |
63 |
|
Primary Metals |
71 |
47 |
31 |
33 |
|
Computers and Electronic Products |
269 |
155 |
122 |
99 |
|
Electrical Equipment |
66 |
41 |
24 |
31 |
|
Machinery |
122 |
77 |
63 |
77 |
|
Transportation Equipment |
298 |
266 |
163 |
225 |
Source: CRS, computed from Census Bureau, County Business Patterns by Employment Size Class, various years.
Among the factories with more than 1,000 workers, average employment size has held steady around 2,050 workers since 2004 after several years of decline. Approximately 16% of manufacturing workers were employed in plants with more than 1,000 workers in 2016, down from 19% in 1998 but up from the low of 14.9% in 2012 (Table 8).
Table 8. Manufacturing Employment by Establishment Size
Percentage of manufacturing employment in employment size category in given year
|
99 or Fewer |
100-249 |
250-499 |
500-999 |
1,000 and Over |
|
|
1998 |
30.9% |
20.5% |
16.2% |
13.3% |
19.2% |
|
2002 |
32.3% |
21.3% |
16.0% |
12.5% |
17.9% |
|
2008 |
34.7% |
21.9% |
15.7% |
12.1% |
15.6% |
|
2012 |
35.9% |
21.9% |
15.7% |
11.6% |
14.9% |
|
2016 |
34.4% |
21.7% |
16.0% |
12.1% |
15.7% |
Source: CRS, computed from Census Bureau, County Business Patterns by Employment Size Class, various years.
Start-Ups and Shutdowns
The employment dynamics of the factory sector differ importantly from those in the rest of the economy. In other economic sectors, notably services, business start-ups and shutdowns account for a large proportion of job creation and job destruction. In manufacturing, by contrast, employment change appears to be driven largely by the expansion and contraction of existing firms, with entrepreneurship and failure playing lesser roles. This may be due to obvious financial factors: the large amounts of capital needed for manufacturing equipment may serve as a deterrent to opening a factory, and the highly specialized nature of manufacturing capital may make it difficult for owners to recover their investment if an establishment shuts down entirely rather than reducing the scope of its production activities.
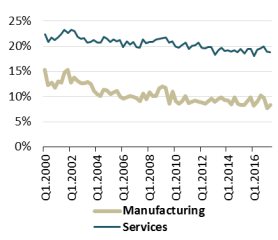
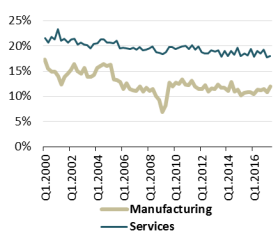
The dynamics of employment change in manufacturing can be seen in two different government databases. The Bureau of Labor Statistics' Business Employment Dynamics database, which is based on firms' unemployment insurance filings, offers a quarterly estimate of gross employment gains attributable to the opening of new establishments and to the expansion of existing ones, and of the gross job losses attributable to the contraction or closure of establishments.43 In manufacturing, BLS finds, less than 10% of gross job creation in recent years is attributable to new establishments, and more than 90% to the expansion of existing establishments. This is quite a different picture from that offered by the service sector, in which openings routinely account for around 20% of all new jobs (see Figure 8).
|
|
|
Similarly, while plant closings are frequently in the headlines, closings are responsible for less than 12% of the manufacturing jobs lost over the past decade. This represents a change from the early years of the 21st century, when plant closings routinely accounted for 15% or 16% of lost manufacturing jobs. Closure is far less likely to be the cause of job loss in the manufacturing sector than in the service sector, where 19% of job losses are due to establishments closing (see Figure 9).44
The other source of data on the connection between new factories and manufacturing job creation is the longitudinal business database maintained by the Census Bureau's Center for Economic Studies. This database covers some establishments (notably certain public sector employers) not included in the BLS database and links individual firms' records from year to year in an attempt to filter out spurious firm openings and closings.45 The Census database has different figures than the BLS database, but identifies similar trends, in particular that establishments open and close at far lower rates in the manufacturing sector than in other sectors of the economy.
The Census Bureau data make clear that the rate at which new business establishments of all sorts were created fell significantly during the 2007-2009 recession.46 As of 2015, the business creation rate had not recovered to prerecession levels. The data also show that 16,365 manufacturing establishments employing 241,643 workers opened their doors in the year to May 2015. This represents an increase in the number of new plants over 2013 and 2014, but fewer than in any other year since 1977, the year for which the data were first collected. The average number of new manufacturing establishments opened each year from 2010 through 2014 was less than half the average during the 1980s and 1990s.47
These two data sources on business dynamics thus support similar conclusions about the role of plant openings and closings in manufacturing employment. Only a small share of the jobs that are created in the manufacturing sector comes from new establishments, largely because factories typically expand slowly in their early years.48 The average manufacturing establishment that opened in 2015 provided 16 jobs during its first year. Conversely, a minority of the jobs lost come from the closure of existing factories, perhaps because factories shrink over a period of years before closing. These facts indicate that marginal employment change in manufacturing depends more heavily on staffing decisions at existing factories than on the creation of new factories.
Selected Policy Issues for Congress
In recent years, Congress has considered a large amount of legislation intended to strengthen the manufacturing sector. Bills introduced in the 115th Congress take diverse approaches, ranging from providing financial and technical assistance to designated manufacturing communities (H.R. 2264, Make It In America Manufacturing Communities Act, and the substantially similar S. 701) to requiring that construction and repairs funded by the drinking water treatment revolving loan program use only iron and steel products made in the United States (H.R. 939; Buy America for Drinking Water Extension Act of 2017) to directing the President to appoint a Chief Manufacturing Officer (S. 399 and H.R. 1092, Chief Manufacturing Officer Act) to providing a tax credit for 25% of the cost of new manufacturing facility built by a U.S.-based start-up company (H.R. 340; Next Generation American Manufacturing Act of 2017).
These proposals, and many others, are typically advanced with the stated goal of job creation, and often with the subsidiary goals of improving employment opportunities for less educated workers or reversing employment decline in communities particularly affected by the loss of manufacturing jobs. The available data suggest, however, that these goals may be difficult to achieve. In particular
- Even large increases in manufacturing activity are likely to translate into relatively modest gains in manufacturing employment due to firms' preference to use U.S. facilities for highly capital-intensive production. After adjusting for inflation, U.S. manufacturers' fixed assets per full-time-equivalent employee rose 55% from 2006 to 2016.49 With the average manufacturing worker making use of more than $300,000 of fixed assets, even large investments are likely to lead to relatively little manufacturing employment, although they may create demand for workers in other sectors, such as construction or information services.
- The decline in energy costs due to the development of shale gas, strongly encouraged by federal policy, is having only relatively modest effects on manufacturing employment in the United States. The three sectors that jointly account for about 65% of natural gas consumption in manufacturing—chemicals, petroleum refining, and primary metals—are the most capital-intensive sectors of U.S. manufacturing. Collectively, they have added fewer than 20,000 employees over the past five years. To the extent that expansion in these industries creates jobs, these are more likely to be in supplier industries than in their own facilities.
- Changes in methods, products, and materials may transform some manufacturing industries over the next few years. Some of these changes have been supported by the federal government. Such improvements may lead to greater manufacturing output, but technological advances in manufacturing are likely to further reduce the need for factory production workers.
- Increases in manufacturing employment are unlikely to result in significant employment opportunities for workers who have not continued their educations beyond high school, as the sorts of tasks performed by manufacturing workers increasingly require higher levels of education and training.
- Policies that promote construction of new facilities for manufacturing may be less effective ways of preserving or creating jobs than policies aimed at existing facilities, as new establishments appear to be relatively limited drivers of employment in manufacturing.
It is important to note that increased manufacturing activity may lead to job creation in economic sectors other than manufacturing. For example, the professional services, information, and finance industries provide about 8% of all inputs into manufacturing, and the transportation and warehousing industry furnishes about 5%, so expansion of manufacturing is likely to stimulate employment in those sectors.50
