The rapid rise of China as a major economic power within a time span of about three decades is often described by analysts as one of the greatest economic success stories in modern times. From 1979 (when economic reforms began) to 2016, China's real gross domestic product (GDP) grew at an average annual rate of nearly 10%.1 The World Bank estimates that from 1981 to 2010, 679 million people in China were raised out of extreme poverty.2 China has emerged as a major global economic power. It is now the world's largest economy (on a purchasing power parity basis) manufacturer, merchandise exporter and importer, and holder of foreign exchange reserves.
China's rapid economic growth has led to a substantial increase in bilateral commercial ties with the United States. According to U.S. trade data, total trade between the two countries grew from $5 billion in 1980 to $599 billion in 2015. China is currently the United States' second-largest trading partner, its third-largest export market, and its largest source of imports. Many U.S. companies have extensive operations in China in order to sell their products in the booming Chinese market and to take advantage of lower-cost labor for export-oriented manufacturing.3 These operations have helped some U.S. firms to remain internationally competitive and have supplied U.S. consumers with a variety of low-cost goods. China's large-scale purchases of U.S. Treasury securities (which totaled $1.1 trillion as of May 2017) have enabled the federal government to fund its budget deficits, which help keep U.S. interest rates relatively low.4
However, the emergence of China as a major economic power has raised concern among many U.S. policymakers. Some claim that China uses unfair trade practices (such as an undervalued currency and subsidies given to domestic producers) to flood U.S. markets with low-cost goods, and that such practices threaten American jobs, wages, and living standards. Others contend that China's growing use of industrial policies to promote and protect certain domestic Chinese industries or firms favored by the government, and its failure to take effective action against widespread infringement and theft of U.S. intellectual property rights (IPR) in China, threaten to undermine the competitiveness of U.S. IP-intensive industries. In addition, while China has become a large and growing market for U.S. exports, critics contend that numerous trade and investment barriers limit opportunities for U.S. firms to sell in China, or force them to set up production facilities in China as the price of doing business there.
The Chinese government views a growing economy as vital to maintaining social stability. However, China faces a number of major economic challenges which could dampen future growth, including distortive economic policies that have resulted in over-reliance on fixed investment and exports for economic growth (rather than on consumer demand), government support for state-owned firms, a weak banking system, widening income gaps, growing pollution, and the relative lack of the rule of law in China. The Chinese government has acknowledged these problems and has pledged to address them by implementing policies to increase the role of the market in the economy, boost innovation, make consumer spending the driving force of the economy, expand social safety net coverage, encourage the development of less-polluting industries (such as services), and crack down on official government corruption. The ability of the Chinese government to implement such reforms will likely determine whether China can continue to maintain relatively rapid economic growth rates, or will instead begin to experience significantly lower growth rates.
China's growing economic power has led it to become increasingly involved in global economic policies and projects, especially in regards to infrastructure development. Such policies include the One-Belt, One Road initiative and the creation of two investment banks: the Asian Infrastructure Investment Bank (AIIB) and the New Development Bank (NDB). China is projected to spend over $1 trillion on these initiatives. If successful, China's economic initiatives could significantly expand export and investment markets for China and increase its "soft power."
China's growing economic influence globally has raised a number of questions, and in some cases, concerns, as to how China's rise will affect U.S. economic interests and influence on global economic policies. China's economic rise has become a factor in congressional debate over various aspects of U.S. trade policy (even those that are not directly related to China), such as the renewal of trade promotion authority (TPA), which was reauthorized through legislation in June 2015, and the Trans-Pacific Partnership (TPP), which was signed by the United States and 11 other countries in February 2016. In January 2017, President Trump announced that the United States would withdraw from TPP,5 which, many contend, may diminish U.S. economic influence in Asia while expanding China's.
This report provides background on China's economic rise; describes its current economic structure; identifies the challenges China faces to maintain economic growth; and discusses the challenges, opportunities, and implications of China's economic rise for the United States.
The History of China's Economic Development
China's Economy Prior to Reforms
Prior to 1979, China, under the leadership of Chairman Mao Zedong, maintained a centrally planned, or command, economy. A large share of the country's economic output was directed and controlled by the state, which set production goals, controlled prices, and allocated resources throughout most of the economy. During the 1950s, all of China's individual household farms were collectivized into large communes. To support rapid industrialization, the central government undertook large-scale investments in physical and human capital during the 1960s and 1970s. As a result, by 1978 nearly three-fourths of industrial production was produced by centrally controlled, state-owned enterprises (SOEs), according to centrally planned output targets. Private enterprises and foreign-invested firms were generally barred. A central goal of the Chinese government was to make China's economy relatively self-sufficient. Foreign trade was generally limited to obtaining those goods that could not be made or obtained in China. Such policies created distortions in the economy. Since most aspects of the economy were managed and run by the central government, there were no market mechanisms to efficiently allocate resources, and thus there were few incentives for firms, workers, and farmers to become more productive or be concerned with the quality of what they produced (since they were mainly focused on production goals set by the government).
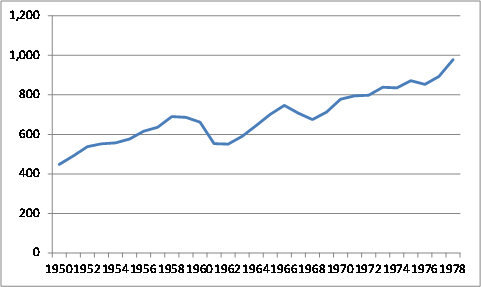
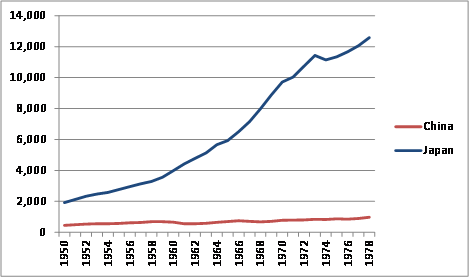
According to Chinese government statistics, China's real GDP grew at an average annual rate of 6.7% from 1953 to 1978, although the accuracy of these data has been questioned by many analysts, some of whom contend that during this period, Chinese government officials (especially at the sub-national levels) often exaggerated production levels for a variety of political reasons. Economist Angus Maddison puts Chinas actual average annual real GDP during this period at about 4.4%.6 In addition, China's economy suffered significant economic downturns during the leadership of Chairman Mao Zedong, including during the Great Leap Forward from 1958 to 1962 (which led to a massive famine and reportedly the deaths of up to 45 million people)7 and the Cultural Revolution from 1966 to 1976 (which caused widespread political chaos and greatly disrupted the economy). From 1950 to 1978, China's per capita GDP on a purchasing power parity (PPP) basis,8 a common measurement of a country's living standards, doubled. However, from 1958-1962, Chinese livings standards fell by 20.3%, and from 1966-1968, they dropped by 9.6% (see Figure 1). In addition, the growth in Chinese living standards paled in comparison to those in the West, such as Japan, as indicated in Figure 2.
|
Figure 1. Chinese Per Capita GDP: 1950-1978 ($ billions, PPP basis) |
 |
|
Source: Angus Maddison, Historical, Statistics of the World Economy: 1-2008 AD. |
|
Figure 2. Comparison of Chinese and Japanese Per Capita GDP: 1950-1978 ($ billions, PPP basis) |
 |
|
Source: Angus Maddison, Historical, Statistics of the World Economy: 1-2008 AD. |
The Chinese government in 1978 (shortly after the death of Chairman Mao in 1976) decided to break with its Soviet-style economic policies by gradually reforming the economy according to free market principles and opening up trade and investment with the West, in the hope that this would significantly increase economic growth and raise living standards. As Chinese leader Deng Xiaoping, the architect of China's economic reforms, put it: "Black cat, white cat, what does it matter what color the cat is as long as it catches mice?"9
The Introduction of Economic Reforms
Beginning in 1979, China launched several economic reforms. The central government initiated price and ownership incentives for farmers, which enabled them to sell a portion of their crops on the free market. In addition, the government established four special economic zones along the coast for the purpose of attracting foreign investment, boosting exports, and importing high technology products into China. Additional reforms, which followed in stages, sought to decentralize economic policymaking in several sectors, especially trade. Economic control of various enterprises was given to provincial and local governments, which were generally allowed to operate and compete on free market principles, rather than under the direction and guidance of state planning. In addition, citizens were encouraged to start their own businesses. Additional coastal regions and cities were designated as open cities and development zones, which allowed them to experiment with free market reforms and to offer tax and trade incentives to attract foreign investment. In addition, state price controls on a wide range of products were gradually eliminated. Trade liberalization was also a major key to China's economic success. Removing trade barriers encouraged greater competition and attracted FDI inflows. China's gradual implementation of economic reforms sought to identify which policies produced favorable economic outcomes (and which did not) so that they could be implemented in other parts of the country, a process Deng Xiaoping reportedly referred to as "crossing the river by touching the stones."10
China's Economic Growth and Reforms: 1979-the Present
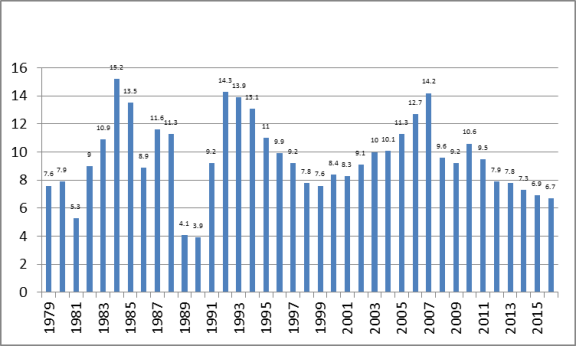
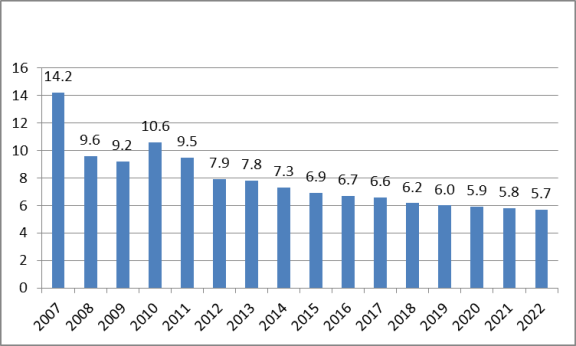
Since the introduction of economic reforms, China's economy has grown substantially faster than during the pre-reform period, and, for the most part, has avoided major economic disruptions.11 From 1979 to 2016, China's annual real GDP averaged 9.6% (see Figure 3).This has meant that on average China has been able to more than double the size of its economy in real terms every eight years. The global economic slowdown, which began in 2008, had a significant impact on the Chinese economy. China's media reported in early 2009 that 20 million migrant workers had returned home after losing their jobs because of the financial crisis and that real GDP growth in the fourth quarter of 2008 had fallen to 6.8% year-on-year. The Chinese government responded by implementing a $586 billion economic stimulus package (approved in November 2008), aimed largely a funding infrastructure, and loosening monetary policies to increase bank lending.12 Such policies enabled China to effectively weather the effects of the sharp global fall in demand for Chinese products. From 2008 to 2010, China's real GDP growth averaged 9.7%. However, the rate of GDP has since slowed for the past six consecutive years, declining from 10.6% in 2010 to 6.7% in 2016. The IMF projects that China's real GDP will continue to slow, falling to 5.7% by 2022 (Figure 4).13
|
Figure 3. Chinese Real GDP Growth: 1979-2016 (percent) |
 |
|
Figure 4. China's Real GDP Growth 2007-2016 and Projections through 2022 (percent) |
 |
|
Source: IMF, WEO, April 2017. |
Causes of China's Economic Growth
Economists generally attribute much of China's rapid economic growth to two main factors: large-scale capital investment (financed by large domestic savings and foreign investment) and rapid productivity growth. These two factors appear to have gone together hand in hand. Economic reforms led to higher efficiency in the economy, which boosted output and increased resources for additional investment in the economy.
China has historically maintained a high rate of savings. When reforms were initiated in 1979, domestic savings as a percentage of GDP stood at 32%. However, most Chinese savings during this period were generated by the profits of SOEs, which were used by the central government for domestic investment. Economic reforms, which included the decentralization of economic production, led to substantial growth in Chinese household savings as well as corporate savings. As a result, China's gross savings as a percentage of GDP is the highest among major economies. The large level of savings has enabled China to substantially boost domestic investment. In fact, China's gross domestic savings levels far exceed its domestic investment levels, which have made China a large net global lender.
Several economists have concluded that productivity gains (i.e., increases in efficiency) have been another major factor in China's rapid economic growth. The improvements to productivity were caused largely by a reallocation of resources to more productive uses, especially in sectors that were formerly heavily controlled by the central government, such as agriculture, trade, and services. For example, agricultural reforms boosted production, freeing workers to pursue employment in the more productive manufacturing sector. China's decentralization of the economy led to the rise of non-state enterprises (such as private firms), which tended to pursue more productive activities than the centrally controlled SOEs and were more market-oriented and more efficient. Additionally, a greater share of the economy (mainly the export sector) was exposed to competitive forces. Local and provincial governments were allowed to establish and operate various enterprises without interference from the government. In addition, FDI in China brought with it new technology and processes that boosted efficiency.
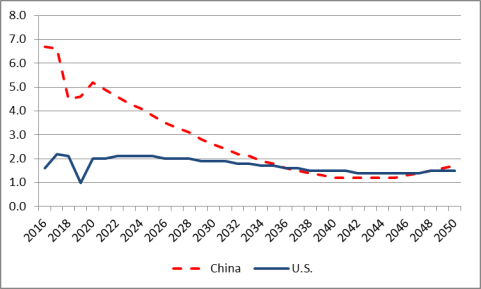
However, as China's technological development begins to approach that of major developed countries (i.e., through its adoption of foreign technology), its level of productivity gains, and thus, real GDP growth, could slow significantly from its historic levels unless China becomes a major center for new technology and innovation and/or implements new comprehensive economic reforms. Several developing economies (notably several in Asia and Latin America) experienced rapid economic development and growth during the 1960s and 1970s by implementing some of the same policies that China has utilized to date to develop its economy, such as measures to boost exports and to promote and protect certain industries. However, at some point in their development, some of these countries began to experience economic stagnation (or much slower growth compared to previous levels) over a sustained period of time, a phenomenon described by economists as the "middle-income trap."14 This means that several developing (low-income) economies were able to transition to a middle income economy, but because they were unable to sustain high levels of productivity gains (in part because they could not address structural inefficiencies in the economy), they were unable to transition to a high-income economy.15 China may be at a similar crossroads now.16 The Economist Intelligence Unit (EIU) projects that China's real GDP growth will slow considerably in the years ahead, and eventually converging on U.S. growth rates around 2036 (U.S. and Chinese real GDP are both projected at 1.6%) and for some years thereafter, U.S. GDP growth is projected to be greater than China's (Figure 5).
The Chinese government has indicated its desire to move away from its current economic model of fast growth at any cost to more "smart" economic growth, which seeks to reduce reliance on energy-intensive and high-polluting industries and rely more on high technology, green energy, and services. China also has indicated it wants to obtain more balanced economic growth. (These issues are discussed in more detail later in the report.)
|
Figure 5. U.S. and Chinese Real GDP Growth Rates in 2016 and Projections through 2050 (percent) |
 |
|
Source: Economist Intelligence Unit Database (accessed on April 19, 2017). Notes: Long-range economic projections should be viewed with caution. EIU's projections differ from those of the IMF in Figure 4. |
Measuring the Size of China's Economy
The rapid growth of the Chinese economy has led many analysts to speculate if and when China will overtake the United States as the "world's largest economic power." The "actual" size of China's economy has been a subject of extensive debate among economists. Measured in U.S. dollars using nominal exchange rates, China's GDP in 2016 in nominal dollars was $11.2 trillion, about 60% the size of the U.S. economy, according to estimates made by the IMF. China's per capita GDP in 2016 was $8,113, which was 14.1% of the U.S. level.
Many economists contend that using nominal exchange rates to convert Chinese data (or that of other countries) into U.S. dollars fails to reflect the true size of China's economy and living standards relative to the United States. Nominal exchange rates simply reflect the prices of foreign currencies vis-à-vis the U.S. dollar and such measurements exclude differences in the prices for goods and services across countries. To illustrate, one U.S. dollar exchanged for local currency in China would buy more goods and services there than it would in the United States. This is because prices for goods and services in China are generally lower than they are in the United States. Conversely, prices for goods and services in Japan are generally higher than they are in the United States (and China). Thus, one dollar exchanged for local Japanese currency would buy fewer goods and services there than it would in the United States. Economists attempt to develop estimates of exchange rates based on their actual purchasing power relative to the dollar in order to make more accurate comparisons of economic data across countries, usually referred to as purchasing power parity (PPP).
The PPP exchange rate increases the (estimated) measurement of China's economy and its per capita GDP. According to the IMF (which uses price surveys conducted by the World Bank), prices for goods and services in China are about 53% the level they are in the United States. Adjusting for this price differential raises the value of China's 2016 GDP from $11.2 trillion (nominal dollars) to $21.3 trillion (on a PPP basis) (see Table 1).17 IMF data indicate that China overtook the United States as the world's largest economy in 2014 on a PPP basis.18
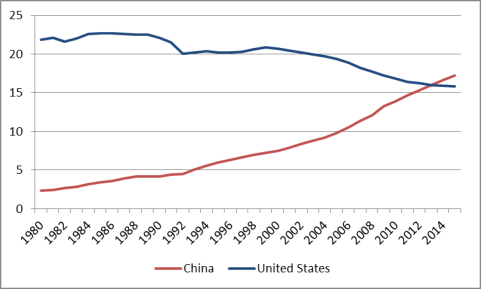
China's share of global GDP on a PPP basis rose from 2.3% in 1980 to 17.8% in 2016, while the U.S. share of global GDP on a PPP basis fell from 24.3% to 15.5%. This would not be the first time in history that China was the world's largest economy (see text box). China's economic ascendency has been impressive, especially considering that in 1980, China's GDP on a PPP basis was only one-tenth that of the United States (see Figure 6). The IMF predicts that by 2021, China's economy will be 44.1% larger than the U.S. economy on a PPP basis.
Table 1. Comparisons of Chinese, Japanese, and U.S. GDP and Per Capita GDP in Nominal U.S. Dollars and a Purchasing Power Parity Basis: 2016
|
China |
United States |
|||
|
Nominal GDP ($ billions) |
|
|
||
|
GDP in PPP ($ billions) |
|
|
||
|
Nominal Per Capita GDP ($) |
|
|
||
|
Per Capita GDP in PPP ($) |
|
|
Source: IMF, World Economic Forum.
|
The Decline and Rise of China's Economy According to a study by economist Angus Maddison, China was the world's largest economy in 1820, accounting for an estimated 32.9% of global GDP. However, foreign and civil wars, internal strife, weak and ineffective governments, natural disasters (some of which were man-made), and distortive economic policies caused China's share of global GDP on a PPP basis to shrink significantly. By 1952, China's share of global GDP had fallen to 5.2%, and by 1978, it slid to 4.9%.19 The adoption of economic reforms by China in the late 1970s led to a surge in China's economic growth and has helped restore China as a major global economic power. Source: The Organization for Economic Cooperation and Development, Chinese Economic Performance in the Long Run, 960-2030, by Angus Maddison, 2007. |
|
Figure 6. Chinese and U.S. GDP (PPP Basis) as a Percent of Global Total: 1980-2016 (percent) |
 |
|
Source: IMF, World Economic Outlook, April 2017. |
The PPP measurement also raises China's 2016 nominal per capita GDP (from $8,113) to $15,399, which was 26.8% of the U.S. level. Even with continued rapid economic growth it would likely take many years for Chinese living standards to approach U.S. levels. For example, the EIU projects that, even by the year 2050, Chinese living standards will be less than half of U.S. levels.20
China as the World's Largest Manufacturer
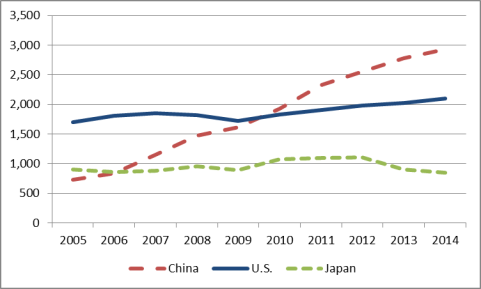
China has emerged as the world's largest manufacturer according to the United Nations. Figure 7 lists estimates of the gross value added of manufacturing in China, the United States, and Japan expressed in U.S. dollars from 2005 to 2014. Gross value added data reflect the actual value of manufacturing that occurred in the country (i.e., they subtract the value of intermediate inputs and raw materials used in production). These data indicate that China overtook Japan as the world's second-largest manufacturer on a gross value added basis in 2006 and the United States in 2010. In 2014, the value of China's manufacturing on a gross value added basis was 39.6% higher than the U.S. level. Manufacturing plays a considerably more important role in the Chinese economy than it does for the United States. In 2014, China's gross valued added manufacturing was equal to 27.7% of its GDP, compared to 12.1% for the United States.21
|
Figure 7. Gross Value Added Manufacturing in China, the United States, and Japan: 2005-2014 ($ billions) |
 |
|
Source: United Nations, UNdata. |
In its 2016 Global Manufacturing Competitiveness Index, Deloitte (an international consulting firm) ranked China as the world's most competitive manufacturer (out of 40 countries), based on a survey of global manufacturing executives, while the United States ranked second (it ranked fourth in 2010). The index found that global executives predicted that the United States would overtake China by 2020 to become the world's most competitive economy, largely because of its heavy investment in talent and technology (e.g., high levels of R&D spending and activities, the presence of top-notch universities, and large amounts of venture capital being invested in advanced technologies). On the other hand, while China was expected to remain a major manufacturing power because of its large R&D spending levels, movement toward higher-valued, advanced manufacturing, government policies to promote innovation, and a large pool of graduates in science, technology, engineering and mathematics, it was viewed as facing several challenges, including a slowing economy, a decline in value-added manufacturing and overcapacity in several industries, rising labor costs, and a rapidly aging population. As a result, China was projected to fall to the second most competitive manufacturer by 2020.22
More broadly, the World Economic Forum produces an annual Global Competitive Report, which assesses and ranks (based on an index) the global competitiveness of a country's entire economy, based on factors that determine the level of productivity of an economy, which in turn sets the level of prosperity that the country can achieve. The World Economic Forum's 2016-2017 Global Competitive Index ranked China as the world's 28th most competitive economy (out of 138 countries), while the United States ranked third.23
Changes in China's Wage and Labor Cost Advantages
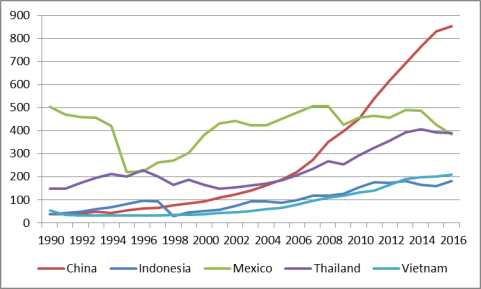
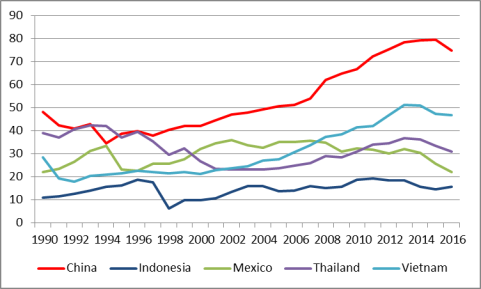
China's huge population and relatively low wage rates gave it a significant competitive advantage when economic reforms and trade liberalization were first begun by the government in the late 1970s. However, this advantage appears to be eroding as wages in China have risen in recent years. As indicated in Figure 8, China's average monthly wages (converted into U.S. dollars) in 1990 were $37, compared with $54 for Vietnam and $505 for Mexico.24 However, in 2016, China's average monthly wages (at $854) were 306.7% higher than Vietnam's wages ($210) and 122.3% higher than Mexico's ($384). From 2007 to 2016, China's average monthly wages rose by 213%. The American Chamber of Commerce in China (AmCham China) 2016 Business Climate survey listed rising labor costs as the second biggest challenge facing U.S. firms in China (it was the largest concern in the 2015 AmCham China survey).25 Figure 9 shows a comparison of labor costs per unit of production for the countries listed in the previous figure, indexed relative to U.S levels. In 1990, China's unit labor production costs were 47% of U.S. levels and by 2016 they were 75% of U.S. levels.
Foreign Direct Investment (FDI) in China
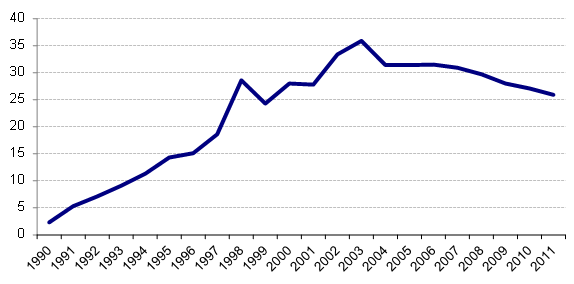
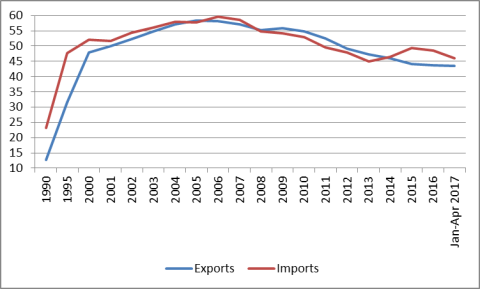
China's trade and investment reforms and incentives led to a surge in FDI beginning in the early 1990s. Such flows have been a major source of China's productivity gains and rapid economic and trade growth. There were reportedly 445,244 foreign-invested enterprises (FIEs) registered in China in 2010, employing 55.2 million workers or 15.9% of the urban workforce.26 As indicated in Figure 10, FIEs account for a significant share of China's industrial output. That level rose from 2.3% in 1990 to a high of 35.9% in 2003, but fell to 25.9% in 2011.27 In addition, FIEs are responsible for a significant level of China's foreign trade. At their peak, FIEs accounted for 58.3% of Chinese exports in 2005 and 59.7% of imports, but these levels have subsequently fell, reaching 43.4% and 45.9%, respectively in January-April 2017 (see Figure 11).
|
Figure 10. Industrial Output by Foreign-Invested Firms in China as a Share of National Output Total: 1990-2011 (percent) |
 |
|
Source: Invest in China (http://www.fdi.gov.cn) and China's 2012 Statistical Yearbook. |
|
Figure 11. Share of Chinese Merchandise Exports and Imports by Foreign-Invested Enterprises in China: 1990-2017 (percent) |
 |
|
Source: Invest in China (http://www.fdi.gov.cn). Note: Data for 2017 are January-April 2017. |
According to the United Nations Conference on Trade and Development (UNCTAD), from 1990 to 2015, global annual FDI flows grew from $205 billion to $1,746 billion (up 752%), while the stock of FDI rose from $2,197 billion to $26,729 billion (up 1,116%).28 The United States has been among the largest sources and destinations of FDI flows over the past several years.29 According to UNCTAD, in 2016, U.S. FDI inflows and outflows were $391 billion and $299 billion, respectively, ranking the United States first in both categories. The United States has been both the largest source of FDI stock and destination for every year since 1980 when UNCTAD FDI data began. UNCTAD puts the stock of U.S. FDI inflows outflows and outflows through 2016 at $6.0 trillion and $6.3 trillion, respectively.30 China's global FDI inflows grew rapidly after it began to liberalize its trade regime in 1979 and joined the WTO in 2001. In 2016, China's FDI inflows were estimated by UNCTAD at $134 billion. China's FDI outflows have risen rapidly over the past 10 years. According to UNCTAD, from 2007 to 2016, China's FDI outflows rose from $27 billion to $183 billion in 2016, a 578% increase (while inflows over this period grew by 60%). China's FDI outflows exceeded inflows for the first time in 2016. According to the UN, in 2016, China was the second largest source of global FDI and the third largest FDI recipient.31
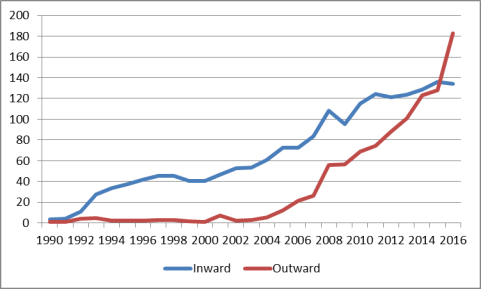
The sharp increase in China's global FDI outflows in recent years (see Figure 12) appears to be largely driven by a number of factors, including Chinese government policies and initiatives to encourage firms to "go global." The government wants to use FDI to gain access to IPR, technology, know-how, famous brands, etc., in order to move Chinese firms up the value-added chain in manufacturing and services, boost domestic innovation and development of Chinese brands, and to help Chinese firms (especially SOEs) to become major global competitors.32 China's slowing economy and rising labor costs have also encouraged greater Chinese overseas FDI in order to help firms diversify risk and expand business opportunities beyond the China market, and, in some cases, to relocate less competitive firms from China to low-cost countries. China's "One Belt, One Road" imitative (also known as the Belt and Road initiative), which was launched in 2013 to boost economic integration (such as infrastructure, trade, and investment) with its neighbors and various trading partners is a third major factor.33 China's Ministry of Foreign Trade (MOFCOM) reports that in 2016, Chinese non-financial FDI in Belt and Road countries totaled $14.5 billion, and that new contracts totaling $126 billion (or 52% of total new contracted Chinese overseas FDI in 2016) were signed with such countries.34 Additionally, increased FDI outflows may be the result of the Chinese government attempting to diversify its foreign exchange reserve holdings (which totaled $3.1 trillion as of May 2017—by far the world's largest holder). Until recently, it appears that a large share of China's reserves have gone to portfolio investments, especially U.S. Treasury securities, which are relatively safe and liquid, but earn relatively small returns.
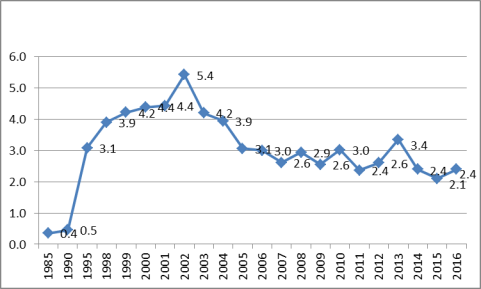
According to Chinese government data on non-financial FDI inflows, the largest sources of cumulative FDI in China for 1979-2016 were Hong Kong and Macau (by far the largest at 52.6% of total),35 the British Virgin Islands (BVI), Japan, Singapore, and the United States (see Table 2). The largest sources of non-financial FDI inflows into China in 2016 were Hong Kong/Macau (65.3% of total), BVI, Singapore, South Korea, the United States, and Taiwan. According to Chinese data, annual U.S. non-financial FDI flows to China peaked at $5.4 billion in 2002 (10.2% of total FDI in China). In 2016, they were $2.4 billion or 1.9% of total FDI flows to China (see Figure 13).36 China estimates the stock of U.S. non-financial FDI in China at $80 billion through 2016.37
Table 2. Chinese Data on Top Ten Sources of FDI Flows to China: 1979-2016
($ billions and percent of total)
|
Country |
Estimated Cumulative Utilized |
Utilized FDI in 2016 |
||||||||||
|
Amount |
% of Total |
Amount |
% of Total |
|||||||||
|
Total |
|
|
|
|
||||||||
|
Hong Kong and Macau |
|
|
|
|
||||||||
|
British Virgin Islands |
|
|
|
|
||||||||
|
Japan |
|
|
|
|
||||||||
|
Singapore |
|
|
|
|
||||||||
|
United States |
|
|
|
|
||||||||
|
S. Korea |
|
|
|
|
||||||||
|
Taiwan |
|
|
|
|
||||||||
|
Cayman Islands |
|
|
|
|
||||||||
|
Germany |
|
|
|
|
||||||||
|
United Kingdom |
|
|
|
|
||||||||
Source: Cumulative data are from the IMF Coordinated Direct Investment Survey. Annual data are from the Chinese Ministry of Commerce.
|
Figure 13. Chinese Data on Annual U.S. FDI Inflows into China: 1985-2016 ($ billions) |
 |
Factors Driving China's Growing FDI Outflows
A key aspect of China's economic modernization and growth strategy during the 1980s and 1990s was to attract FDI into China to help boost the development of domestic firms. Investment by Chinese firms abroad was sharply restricted. However, in 2000, China's leaders initiated a new "go global" strategy, which sought to encourage Chinese firms (primarily SOEs) to invest overseas. One key factor driving this investment is China's massive accumulation of foreign exchange reserves. Traditionally, a significant level of those reserves has been invested in relatively safe, but low-yielding, assets, such as U.S. Treasury securities. On September 29, 2007, the Chinese government officially launched the China Investment Corporation (CIC) in an effort to seek more profitable returns on its foreign exchange reserves and diversify away from its U.S. dollar holdings.38The CIC was originally funded at $200 billion, making it one of the world's largest sovereign wealth funds.39 Another factor behind the government's drive to encourage more outward FDI flows has been to obtain natural resources, such as oil and minerals, deemed by the government as necessary to sustain China's rapid economic growth.40 Finally, the Chinese government has indicated its goal of developing globally competitive Chinese firms with their own brands. Investing in foreign firms, or acquiring them, is viewed as a method for Chinese firms to obtain technology, management skills, and often, internationally recognized brands, needed to help Chinese firms become more globally competitive. For example, in April 2005, Lenovo Group Limited, a Chinese computer company, purchased IBM Corporation's personal computer division for $1.75 billion.41 Similarly, overseas FDI in new plants and businesses is viewed as developing multinational Chinese firms with production facilities and R&D operations around the world.
China's FDI outflows by destination for 2015 (as reported by the Chinese government) are listed in Table 3.42 The largest destinations of cumulative Chinese FDI through 2015 were Hong Kong (59.8% of total), the Cayman Islands (5.7%), the BVI (4.7%) and the United States (3.7%). In terms of annual Chinese FDI outflows, the largest recipients of FDI flows in 2015 were Hong Kong (61.6%), Singapore (7.2%), the Cayman Islands (7.0%), and the United States (5.5%).
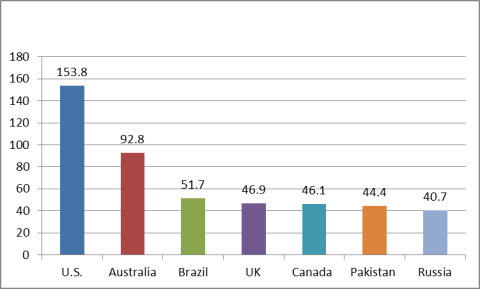
A significant level of Chinese FDI that goes to Hong Kong, the BVI, and the Cayman Islands likely is redirected elsewhere. The American Enterprise Institute (AEI) and the Heritage Foundation jointly maintain the China Global Investment Tracker (CGIT), a database that has been developed to track the actual flows (from the parent company to the final destination) of Chinese investment globally. The CGIT database tracks FDI valued at $100 million or more (which it refers to as "China's outward non-bond investment").43 These data differ significantly from official Chinese FDI outflow data. The CGIT data on the top destinations of total Chinese outward non-bond outward investment from 2005 to 2016 included the United States ($153.4 billion), Australia ($98.2 billion), Brazil ($51.7 billion), and the United Kingdom ($46.9 billion) (see Figure 14). The CGIT also puts Chinese FDI in the United in 2016 at $54.6 billion (or 32.3% of total Chinese FDI outflows), making the United States by far the largest destination of Chinese outward FDI. Some of China's largest acquisitions in 2016 involved U.S. firms, including HNA's $6.5 billion in Hilton from Blackstone, HNA's $6 billion purchase of technology firm Ingram Micro, Anbang's $5.7 billion acquisition of hotel properties from Blackstone, and Haier's $5.4 billion purchase of GE Appliances.
Table 3. Major Destinations of Chinese Non-Financial FDI Outflows in 2015: Flows and Stock
($ billions and percentage)
|
Destination |
FDI Flows in 2015 |
Stock of FDI through 2015 |
Share of FDI Stock through 2015 (%) |
||||||
|
Total |
|
|
|
||||||
|
Hong Kong |
|
|
|
||||||
|
Cayman Islands |
|
|
|
||||||
|
British Virgin Islands |
|
|
|
||||||
|
United States |
|
|
|
||||||
|
Singapore |
|
|
|
||||||
|
Australia |
|
|
|
||||||
|
United Kingdom |
|
|
|
Source: Chinese Ministry of Commerce.
Note: Ranked according to the top seven destinations of the stock of Chinese FDI outflows through 2015.
China's Merchandise Trade Patterns
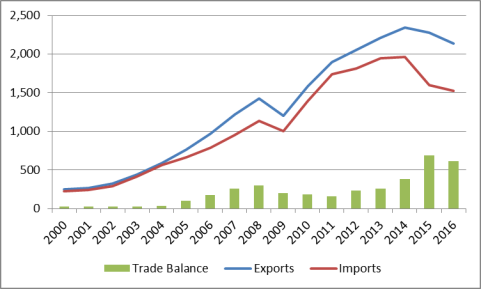
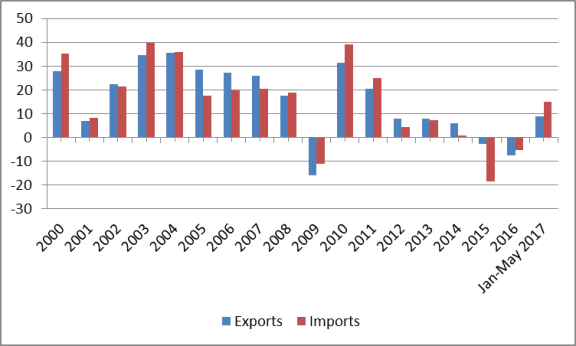
Economic reforms and trade and investment liberalization have helped transform China into a major trading power. Chinese merchandise exports rose from $14 billion in 1979 to $2.1 trillion in 2016, while merchandise imports grew from $18 billion to $1.6 trillion (see Table 4 and Figure 15). China's rapidly growing trade flows have made it an increasingly important (and often the largest) trading partner for many countries. According to China, it was the largest trading partner for 130 countries in 2013.44 From 2000 to 2008, the annual growth of China's merchandise exports and imports averaged 25.1% and 24.2%, respectively. However, China's exports and imports fell by 15.9% and 11.2%, respectively, due to the impact of the global financial crisis. China's trade recovered in 2010 and 2011, with export growth averaging 25.8% and import growth averaging 31.9%. However, since that time, China's trade flows have slowed sharply. From 2012 to 2014, China's exports and imports grew at an average annual rate of 7.2% and 4.1%, respectively. From 2015 to 2016 exports and imports fell by an average rate of 4.7% and 11.6%, respectively (see Figure 16), reflecting a sluggish global economy and a decline in commodity prices (such as oil and ores). China's merchandise trade surplus grew sharply from 2004 to 2008, rising from $32 billion to $297 billion. That surplus fell each year over the next three years, dropping to $158 billion in 2011. However, it rose in each of the next four years, reaching a record $679 billion in 2015 before falling to $611 billion in 2016.
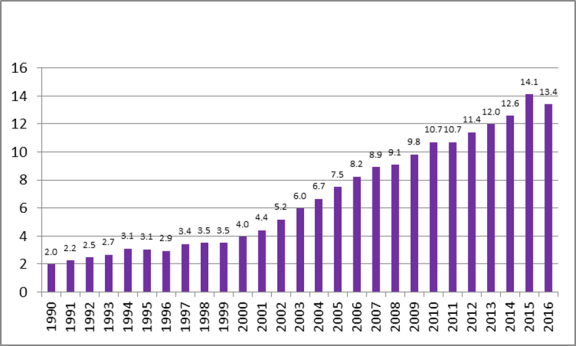
In 2009, China overtook Germany to become both the world's largest merchandise exporter and the second-largest merchandise importer (after the United States). In 2012, China overtook the United States as the world's largest merchandise trading economy (exports plus imports).45 As indicated in Figure 17, China's share of global merchandise exports grew from 2.0% in 1990 to 14.1% in 2015, but fell to 13.4% in 2016.46 The World Bank projects that this figure could increase to 20% by 2030.47
|
Year |
Exports |
Imports |
Trade Balance |
|
1979 |
13.7 |
15.7 |
-2.0 |
|
1980 |
18.1 |
19.5 |
-1.4 |
|
1985 |
27.3 |
42.5 |
-15.3 |
|
1990 |
62.9 |
53.9 |
9.0 |
|
1995 |
148.8 |
132.1 |
16.7 |
|
2000 |
249.2 |
225.1 |
24.1 |
|
2001 |
266.2 |
243.6 |
22.6 |
|
2002 |
325.6 |
295.2 |
30.4 |
|
2003 |
438.4 |
412.8 |
25.6 |
|
2004 |
593.4 |
561.4 |
32.0 |
|
2005 |
762.0 |
660.1 |
101.9 |
|
2006 |
969.1 |
791.5 |
177.6 |
|
2007 |
1,218.0 |
955.8 |
262.2 |
|
2008 |
1,428.9 |
1,131.5 |
297.4 |
|
2009 |
1,202.0 |
1,003.9 |
198.2 |
|
2010 |
1,578.4 |
1,393.9 |
184.5 |
|
2011 |
1,899.3 |
1,741.4 |
157.9 |
|
2012 |
2,050.1 |
1,817.3 |
232.8 |
|
2013 |
2,210.7 |
1,949.3 |
261.4 |
|
2014 |
2,343.2 |
1,963.1 |
380.1 |
|
2015 |
2,280.5 |
1,601.8 |
678.8 |
|
2016 |
2,135.3 |
1,524.7 |
610.6 |
Source: Global Trade Atlas and China's Customs Administration.
|
Figure 15. China's Merchandise Trade: 2000-2016 ($ billions) |
 |
|
Figure 17. China's Share of Global Merchandise Exports: 1990-2016 (percent) |
 |
|
Source: Economist Intelligence Unit. |
China's Major Trading Partners
Table 5 lists official Chinese trade data on its seven largest trading partners in 2016 (based on total trade). These include the 28 countries that make up the European Union (EU28), the United States, the 10 nations that constitute the Association of Southeast Asian Nations (ASEAN), Hong Kong, Japan, South Korea, and Taiwan.48 China's top three export markets were the United States, the EU28, and Hong Kong,49 while its top sources for imports were the EU28, ASEAN, and South Korea. According to Chinese data, it maintained large trade surpluses with Hong Kong ($272 billion), the United States ($251 billion), and the EU28 ($131 billion), and reported large trade imbalances with Taiwan ($99 billion) and South Korea ($65 billion). China's trade data differ significantly from those of many of its trading partners. These differences appear to be largely caused by how China's trade via Hong Kong is counted in official Chinese trade data. China treats a large share of its exports through Hong Kong as Chinese exports to Hong Kong for statistical purposes, while many countries that import Chinese products through Hong Kong generally attribute their origin to China for statistical purposes, including the United States.50
|
Country |
Total Trade |
Chinese Exports |
Chinese Imports |
China's Trade Balance |
||||||||
|
European Union |
|
|
|
|
||||||||
|
United States |
|
|
|
|
||||||||
|
ASEAN |
|
|
|
|
||||||||
|
Hong Kong |
|
|
|
|
||||||||
|
Japan |
|
|
|
|
||||||||
|
South Korea |
|
|
|
|
||||||||
|
Taiwan |
|
|
|
|
Source: China's Customs Administration.
Notes: Rankings according to China's total trade in 2016. China's bilateral trade data often differ from that of its trading partners.
Major Chinese Trade Commodities
China's abundance of low-cost labor has made it internationally competitive in many low-cost, labor-intensive manufactures. As a result, manufactured products constitute a significant share of China's trade. A substantial amount of China's imports is comprised of parts and components that are assembled into finished products, such as consumer electronic products and computers, and then exported. Often, the value-added to such products in China by Chinese workers is relatively small compared to the total value of the product when it is shipped abroad.
China's top 10 imports and exports in 2016 are listed in Table 6 and Table 7, respectively, using the harmonized tariff system (HTS) on a two-digit level. Major imports included electrical machinery and equipment;51 mineral fuels; nuclear reactors, boilers, and machinery (such as automatic data process machines and machines to make semiconductors); optical, photographic, medical or surgical instruments; and ores. China's biggest exports were electrical machinery and equipment; nuclear reactors, boilers, and machinery; furniture and bedding; and apparel.
|
HS Code |
Description |
$ Billions |
Percent of |
2016/2015 |
|
|
|
Total Commodities |
1,525 |
100.0 |
-4.8 |
|
|
|
Electrical machinery and equipment |
416 |
27.3 |
-3.7 |
|
|
|
Mineral fuel, oil etc. |
175 |
11.5 |
-11.9 |
|
|
|
Nuclear reactors, boilers, and machinery |
148 |
9.7 |
-6.0 |
|
|
|
Optical, photographic, cinematographic, measuring |
93 |
6.1 |
-6.8 |
|
|
|
Ores, slag, and ash |
93 |
6.1 |
-2.5 |
|
|
|
Vehicles, except railway, and parts |
71 |
4.7 |
2.6 |
|
|
|
Plastics and articles thereof |
61 |
4.0 |
-7.0 |
|
|
|
Organic chemicals |
44 |
2.9 |
-8.3 |
|
|
|
Oil seeds, misc. grain, fruit, plant, etc. |
38 |
2.5 |
-3.8 |
|
|
|
Copper and articles thereof |
33 |
2.2 |
-13.4 |
Source: World Trade Atlas, using official Chinese statistics.
Note: Top 10 imports in 2016, two-digit level, harmonized tariff system.
|
HS Code |
Description |
$ Billions |
Percent of |
2016/2015 |
|||
|
|
Total Commodities |
2,135 |
100.0 |
|
|||
|
|
Electrical machinery |
560 |
26.2 |
|
|||
|
|
Nuclear reactors, boilers, and machinery |
346 |
16.2 |
|
|||
|
|
Furniture and bedding |
91 |
4.3 |
|
|||
|
|
Apparel articles and accessories, knit or crochet |
76 |
3.6 |
|
|||
|
|
Apparel articles and accessories, not knit etc. |
74 |
3.5 |
|
|||
|
|
Optical, photographic, cinematographic, measuring checking, precision, medical or surgical instruments and apparatus; parts and accessories thereof |
68 |
3.2 |
|
|||
|
|
Plastics and articles thereof |
65 |
3.1 |
|
|||
|
|
Vehicles, except railway, and parts |
61 |
2.8 |
|
|||
|
|
Articles of iron or steel |
54 |
2.5 |
|
|||
|
|
Footwear |
49 |
2.3 |
|
Source: World Trade Atlas, using official Chinese statistics.
Note: Top 10 exports in 2016, two-digit level, harmonized tariff system.
China's Regional and Bilateral Free Trade Agreements
The Chinese government has maintained an active policy of boosting trade and investment ties around the world, especially with countries in Asia. To that end, China has entered into a number of regional and bilateral trade agreements, or is in the process of doing so. China currently has free trade agreements (FTAs) with 23 partners, including with the 10 countries that make up the ASEAN, Australia, Chile, Costa Rica, Hong Kong, Macau, Iceland, New Zealand, Pakistan, Peru, Singapore, Switzerland, Australia, South Korea, and Georgia. China also has an "economic cooperation framework agreement" (ECFA) with Taiwan, which is the equivalent to an FTA.
The combined GDP on a PPP basis of the countries China had an FTA through 2015 totaled $13.8 trillion, the combined population was 1.5 trillion, and total merchandise trade (exports plus imports) with China was $1.5 trillion. In comparison, the United States had FTAs in effect with 20 countries through 2015, which had combined: GDP on a PPP basis of $10.0 trillion, population of 451 million, and total trade at $1.5 trillion, respectively in 2015 (See Table 8).
|
Partner |
GDP in PPP |
Population (millions) |
China's Total Trade ($ billions) |
|
Hong Kong |
414.1 |
7.3 |
340.9 |
|
South Korea* |
1,748.8 |
50.3 |
275.7 |
|
Taiwan |
1,099.0 |
23.5 |
189.5 |
|
Australia* |
1,082.4 |
24.0 |
105.5 |
|
Malaysia** |
815.6 |
30.3 |
97.4 |
|
Vietnam** |
552.3 |
93.5 |
90.2 |
|
Singapore** |
471.6 |
5.5 |
79.2 |
|
Thailand** |
1,108.1 |
67.4 |
75.5 |
|
Indonesia** |
2,842.2 |
255.8 |
54.2 |
|
Philippines** |
741.0 |
100.7 |
45.7 |
|
Switzerland |
501.7 |
8.2 |
43.6 |
|
Chile |
400.5 |
17.9 |
32.0 |
|
Pakistan |
952.5 |
188.9 |
19.0 |
|
Myanmar** |
260.0 |
53.9 |
14.6 |
|
Peru |
389.1 |
31.2 |
14.6 |
|
New Zealand |
170.0 |
4.6 |
11.5 |
|
Macau |
65.4 |
0.6 |
4.8 |
|
Cambodia** |
54.3 |
15.6 |
4.4 |
|
Laos** |
38.6 |
6.8 |
2.6 |
|
Costa Rica |
73.9 |
4.8 |
2.2 |
|
Brunei** |
30.0 |
0.4 |
1.5 |
|
Iceland |
15.4 |
0.3 |
0.2 |
|
Total |
13,826.8 |
991.5 |
1,504.8 |
Source: Economist Intelligence Unit.
Notes:
* FTAs entered into force in 2015.
**ASEAN countries. Data ranked by total Chinese trade with FTA partners in 2015.
|
Partner |
GDP in PPP |
Population (million) |
Total U.S. Trade ($ billions) |
|
Canada |
1,588.6 |
35.9 |
576.8 |
|
Mexico |
2,194.4 |
125.4 |
532.2 |
|
South Korea |
1,748.8 |
50.3 |
115.2 |
|
Singapore |
471.6 |
5.5 |
46.7 |
|
Colombia |
665.6 |
48.2 |
30.4 |
|
Israel |
296.9 |
8.4 |
38.0 |
|
Australia |
1,082.4 |
24 |
35.9 |
|
Chile |
400.5 |
17.9 |
24.2 |
|
Peru |
389.1 |
31.2 |
13.8 |
|
Dom. Republic |
149.6 |
10.5 |
11.8 |
|
Costa Rica |
73.9 |
4.8 |
10.6 |
|
Honduras |
41.1 |
8.1 |
10.0 |
|
Guatemala |
126.1 |
16.3 |
9.9 |
|
Panama |
87.2 |
3.9 |
8.1 |
|
El Salvador |
52.7 |
6.4 |
5.8 |
|
Nicaragua |
31.6 |
6.1 |
4.5 |
|
Oman |
171.7 |
4.3 |
3.3 |
|
Jordan |
82.6 |
8.1 |
2.9 |
|
Morocco |
273.4 |
34.4 |
2.6 |
|
Bahrain |
64.7 |
1.4 |
2.2 |
|
Total |
9,992.5 |
451.1 |
1,484.6 |
Sources: Economist Intelligence Unit and Global Trade Atlas.
Note: Data ranked by total U.S. trade with FTA partners in 2015.
China is currently in the process of negotiating FTAs with the Cooperation Council for the Arab States of the Gulf (which includes Saudi Arabia, Kuwait, the United Arab Emirates, Qatar, and Bahrain), Norway, and the Southern African Customs Union (which includes South Africa, Botswana, Lesotho, Namibia, and Swaziland), Sri Lanka, Israel, Maldives, Japan. China has also sought a trilateral FTA with Japan and South Korea. China has also considered negotiating FTAs with a number of other countries as well, including Canada, Colombia, Moldova, Mongolia, Fiji, Nepal, and Mauritius.
In December 2012, China joined with the 10 members of ASEAN, Japan, South Korea, Australia, India, and New Zealand to begin negotiations toward a Regional Comprehensive Economic Partnership (RCEP), which, if concluded, could constitute the world's largest free trade bloc (in terms of combined population and GDP).52 In November 2014, during the Asia-Pacific Economic Cooperation (APEC) summit in Beijing, Chinese President Xi called for renewed efforts to achieve a Free Trade Area of the Asia-Pacific (FTAAP) agreement, an idea that was first proposed by the United States over a decade ago.
China's economic rise and its growing impact on global trade have made it a key factor in debates among U.S. policymakers over various U.S. trade policy issues. U.S. commercial relations with China were an integral part of the congressional debate over the renewal of Trade Promotion Authority (TPA) and the Trans-Pacific Partnership (TPP), an FTA that was signed the United States and 11 other Pacific Rim nations. Although not currently participating in TPP, China's trade policies underpinned some U.S. motivation for the agreement. While some supporters of TPP viewed it as a vehicle to counteract China's growing economic power and political power in the Asia-Pacific region,53 others saw it was a strategy to move China toward a more liberalized economy because, it was argued, that not being part of the TPP could be costly to the Chinese economy, and thus it would give an upper hand to economic reformers in China. It has been further argued, that getting China into the TPP would have helped address a number of long-standing issues between the United States and China, such as China's preferences for SOE's, lack of IPR protection and cyber-theft of U.S. trade secrets, and localization requirements for digital data storage, among others. Finally, many argued that because the TPP is a "high standard" agreement, it would become the blueprint or model for broader FTAs in the future.
The Trump Administration's decision to terminate U.S. participation in the current TPP and instead pursue bilateral FTAs54 has raised questions over how this will impact the ability of the United States to continues to play a leading economic and political role in the Asia-Pacific region (and globally as well). Many analysts contend that pulling out of the TPP has damaged U.S. credibility with its major trading partners and has weakened the ability of the United States to pressure China to further liberalize its economy. For example, in January 2017, then USTR Michael Froman stated
We heard a lot about the importance of being tough on China during this recent campaign. I agree. It's important to be tough with China on trade.... But here, I have to admit to being a little perplexed. There simply is no way to reconcile a get-tough-on-China policy with withdrawing from TPP. That would be the biggest gift any U.S. President could give China, one with broad and deep consequences, economic and strategic. It would be huge for China... From our friends and allies in the region to our own military commanders, we have heard clearly that failure by the U.S. to move forward would be a debilitating blow to U.S. leadership and credibility in the region, one that would create a void that China is all too happy to fill, and one that would leave our closest military allies and partners no choice but to line up behind China.55
Some analysts contend that China has already begun to assert itself as a main advocate of the current global trading system and free trade. They note, for example, that Chinese President Xi Jinping attended the annual World Economic Forum in Davos, Switzerland in January 2017, the first Chinese head of state to do so. In a keynote speech delivered to the forum, Xi stated
We must remain committed to developing global free trade and investment, promote trade and investment liberalization and facilitation through opening-up and say no to protectionism ... We will advance the building of the Free Trade Area of the Asia Pacific and negotiations of the Regional Comprehensive Economic Partnership to form a global network of free trade arrangements. China stands for concluding open, transparent and win-win regional free trade arrangements and opposes forming exclusive groups that are fragmented in nature.56
The remaining TPP members have indicated that they intend to continue to try to conclude the TPP without the United States, although several members have indicated that they hope the United States will rejoin the agreement at some point.
Major Long-Term Challenges Facing the Chinese Economy
China is currently undergoing a major restructuring of its economic model. Policies that were employed in the past to essentially produce rapid economic growth at any cost were very successful. However, such policies have entailed a number of costs (such as heavy pollution, widening income inequality, overcapacity in many industries, an inefficient financial system, rising corporate debt, and numerous imbalances in the economy) and therefore the old growth model is viewed by many economists as no longer sustainable. China has sought to develop a new growth model ("the new normal") that promotes more sustainable (and less costly) economic growth that puts greater emphasis on private consumption and innovation as the new drivers of the Chinese economy. Implementing a new growth model that sustains healthy economic growth could prove challenging unless China is able to effectively implement new economic reforms. Many analysts warn that without such reforms, China could face a period of stagnant economic growth and living standards, a condition referred to by economists as the "middle-income trap" (See text box). Several of these challenges are discussed below.
|
Avoiding the Middle Income Trade Several developing economies (notably some in Asia and Latin America) experienced rapid economic development and growth during the 1960s and 1970s by implementing some of the same policies that China has utilized to date to develop their economies, such as measures to boost exports and to promote and protect certain industries. However, at some point in their development, several of these countries began to experience economic stagnation (or much slower growth compared to previous levels) over a sustained period of time, a phenomenon economists described as the "middle-income trap." While several developing economies transitioned to a middle-income economy, defined by the World Bank as per capita gross national income (GNI) in 2015 of $1,026-$12,475 (using average exchange rates, adjusted for inflation), only a handful of economies (such as Japan, Taiwan, and South Korea) have maintained rapid economic growth long enough to become "high-income" countries (per capita GNI of $12,476 or more). Most other countries that reached middle-income levels and saw their GDP growth rates begin to decline were unable to address structural inefficiencies in their economy or could not sustain productivity growth. China, currently a "high middle-income country" (with a per capita GNI of $7,930) may be at a similar crossroads.57 For example, China may be losing its advantage in low-cost labor. Its working population has reportedly fallen for four straight years (according to the Chinese government, it fell by 4.97 million people in 2015 and 3.53 million people in 2016). A continued decline in China's workforce could drive up wages faster than productivity gains, thus potentially slowing the growth rate of real GDP. China already has experienced a slowdown in total factor productivity (TFP) growth in recent years. TFP grew at an average annual rate of 3.4% from 2012 to 2016, compared with 6.0% average growth over the previous five years. If China is unable to boost TFP in the future, it may begin to experience a sharp decline in economic growth and hence be caught in the middle-income trap. In January 2017 the IMF warned that for China, "a sharp or disruptive slowdown in the future remains a risk given continuing rapid credit expansion, impaired corporate debts, and persistent government support for inefficient state-owned firms."58 |
China's Incomplete Transition to a Market Economy
Despite China's three-decade history of widespread economic reforms, Chinese officials contend that China is a "socialist-market economy." This appears to indicate that the government accepts and allows the use of free market forces in a number of areas to help grow the economy, but the government still plays a major role in the country's economic development.
Industrial Policies and SOEs
According to the World Bank, "China has become one of the world's most active users of industrial policies and administrations."59 China's State Council has said that there are currently 150,000 SOEs at the central and local government level.60 China's SOEs may account for up of 50% of non-agriculture GDP.61 In addition, although the number of SOEs has declined sharply, they continue to dominate a number of sectors (such as petroleum and mining, telecommunications, utilities, transportation, and various industrial sectors); are shielded from competition; are the main sectors encouraged to invest overseas; and dominate the listings on China's stock indexes.62 One study found that SOEs constituted 50% of the 500 largest manufacturing companies in China and 61% of the top 500 service sector enterprises.63 Not only are SOEs dominant players in China's economy, many are quite large by global standards. Fortune's 2016 list of the world's 500 largest companies includes 103 Chinese firms (compared to 29 listed firms in 2007).64 Of the 103 Chinese firms listed, Fortune identified 75 companies (73% of total) where the government owned 50% or more of the company. Together, these 75 firms in 2016 generated $7.2 trillion in revenues, had assets valued at $20.7 trillion, and employed 16.2 million workers. Of the 28 other Chinese firms on the Fortune 500 list, several appear to have financial links to the Chinese government.
|
China and Global Steel Overcapacity China has become a major global producer of steel. From 2001to 2016, China's production of raw steel rose from 152 million metric tons to 805 million metric tons, an increase of 459.9%. During this period, China's share of global production rose from 17.9% to 50.3% and China accounted for 87.1% of the increase in global steel production.65 While much of China's increased steel capacity has been in response to domestic demand (resulting from China's large scale fixed investment), it is also a major exporter. In 2015, China was the second largest exporter of semi-finished and steel products (after the EU) at 111.6 million metric tons, or 24.1% of global total. Concerns have been raised over the past few years over the effects of increased global steel production despite falling global steel demand. Following an EU Symposium on Excess Capacity and Structural Adjustment in the Steel Sector in April 2016, then U.S. Secretary of Commerce Penny Pritzker and then USTR Michael Froman issued a joint statement that said that the "U.S. steel industry is in a crisis driven in large part by global excess capacity.... led by unsustainable expansion in steelmaking capacity by China," and noted that global steel overcapacity had impacted the U.S. industry through price declines, decreased profitability, and over 13,000 jobs lost.66 Many analysts contend that China's steel industry is heavily supported by government entities at the central and local government level through low-cost credit and subsidies. These enable many Chinese steel firms to operate, even when they are unprofitable and heavily in debt—these are termed by some as "zombies." The government is reluctant to allow such firms to go bankrupt due to concerns over effects layoffs could have on social stability. One study by Renmin University estimated that half of Chinese steel firms were "zombie enterprises."67 In April 2016, the USTR released a list of 86 government subsidies from 2011 to 2014 given to Hebei Iron & Steel Company, one of the largest steel companies in China, which was obtained from the company's annual reports.68 In February 2016, the Chinese government announced plans to shut 100 million to 150 million metric tons of crude steel capacity over the next five years and cut 500,000 jobs.69 The USTR's 2016 report on China's WTO compliance stated that China had committed to "ensure that no central government plans, policies, directives, guidelines, lending or subsidization targets the net expansion of steel capacity," and to take steps to reduce existing capacity, including "actively and appropriately dispose of "zombie enterprises" through bankruptcies and other means."70 |
A State-Dominated Banking Sector, Excess Credit, and Growing Debt
China's banking system is largely dominated by state-owned or state-controlled banks. According to one analyst, the mangers of China's state banks are drawn from the ranks of the Chinese Communist Party cadre system, which "enables the party and government leaderships to exert and influence over bank lending."71 In 2015, the top five largest banks in China in terms of assets were state-owned entities.72 The percentage share of assets held by state-owned commercial banks (including the five large state-own banks), the three government policy banks,73 and joint-stock commercial banks (where government entities are a major stock holder), together accounted for 68.5% of total bank assets in China.74 Foreign participation in China's banking system is relatively small, accounting for 1.6% of total bank assets.75 SOEs are believed to receive preferential credit treatment by government banks, while private firms must often pay higher interest rates or obtain credit elsewhere. According to one estimate, SOEs accounted for 85% ($1.4 trillion) of all bank loans in 2009.76 It is believed that oftentimes SOEs do not repay their loans, which may have saddled the banks with an ever increasing amount of nonperforming loans.77 Many analysts contend that one of the biggest weaknesses of the banking system is that it lacks the ability to ration and allocate credit according to market principles, such as risk assessment.
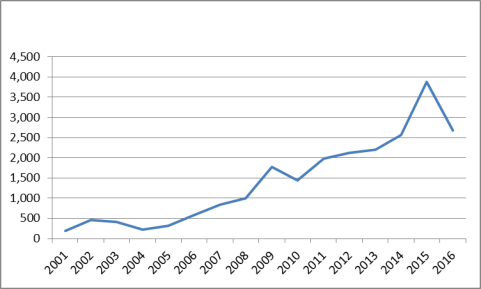
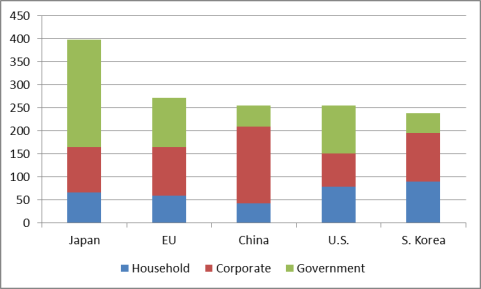
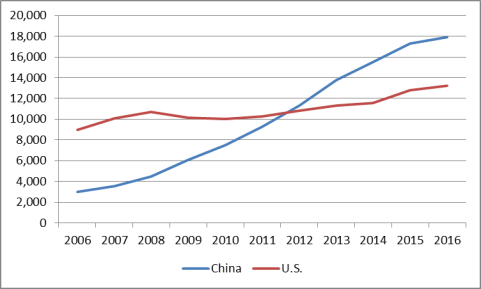
The Chinese central government uses the banking system to boost credit in order to help meet its GDP growth objectives and to, when needed, offset the impact of global economic downturns, such as after the 9/11 terrorist attacks and the global financial crisis. From 2007 to 2016, China's domestic credit increased in dollar terms by 218% (see Figure 18), and as a share of GDP, the level rose from 125% to 212%. As indicated in Figure 19, China's combined household, corporate, and government debt levels as a percent of GDP as of mid-2016 are comparable to those of the United States and South Korea and lower than those of Japan and the European Union. However, China's debt levels (in both dollars and as a percent of GDP) have risen sharply within a relatively short time, which, some have speculated, could spark an economic crisis in China in the future. From 2006 year-end to mid-2016, China's total non-financial sector debt as a percent of GDP increased from 143% to 254% (up 111 percentage points). Much of the rise in that debt came from the corporate sector, which, as a percent of GDP rose from 107% in 2006 to 171% in mid-2016 (up 64 percentage points). In dollar terms, China's corporate debt rose from $3 trillion to $17.8 trillion (up $14.8 trillion) and currently great exceeds U.S. corporate debt levels (see Figure 20). Several observers have warned that China's credit growth may be too extensive and could undermine future growth by sharply boosting debt levels, causing overcapacity in many industrials (especially extending credit to firms that are unprofitable to keep them operating), and contributing to bubbles (such as in real estate), and reducing productivity by proving preferential treatment to SOEs and other government-supported entities.
|
Figure 18. Annual Change in the Stock of China's Domestic Credit 2000-2016 ($ billions) |
 |
|
Source: Economist Intelligence Unit. |
|
Figure 19. Core Debt of Non-Financial Sectors in 2016* as a Percent of GDP (percent) |
 |
|
Source: Bank for International Settlements. Note: * As of second quarter 2016. |
|
Figure 20. U.S. and Chinese Corporate Debt: 2006-2016* ($ billions) |
 |
|
Source: Bank for International Settlements. Notes: *As of second quarter 2016. |
Local government debt is viewed as a big problem in China, largely because of the potential impact it could have on the Chinese banking system. During the beginning of the global financial slowdown, many Chinese subnational government entities borrowed extensively to help stimulate local economies, especially by supporting infrastructure projects. In December 2013, the Chinese National Audit Office reported that from the end of 2010 to mid-year 2013, local government debt had increased by 67% to nearly $3 trillion.78 The Chinese government reported that local government debt rose to $4.3 trillion as of 2015. Efforts have been made over the past few years by the central government to restructure local government debt and restrict local government borrowing, with mixed success, according to some press reports, because of pressures on local governments to maintain rapid economic growth.79
Many economists blame China's closed capital account for a much of China's debt problems. The Chinese government has maintained restrictions on capital inflows and outflows for many years, in part to control the exchange of its currency, the renminbi (RMB), against the dollar and other currencies in order to boost exports. Many argue the Chinese government's restrictions on capital flows has greatly distorted financial markets in China, preventing the most efficient use of capital, such as over-investment in some sectors (such as real estate) and under-investment in others (such as services).
Large Internal Imbalances of Savings, Fixed Investment, and Consumption
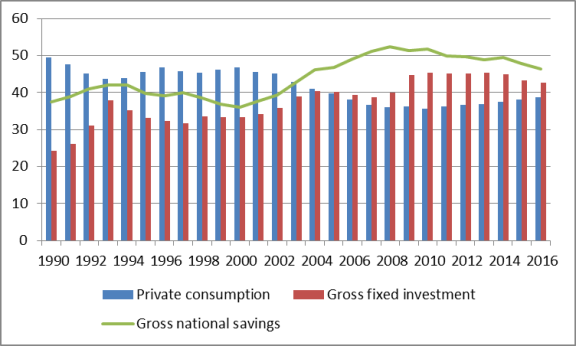
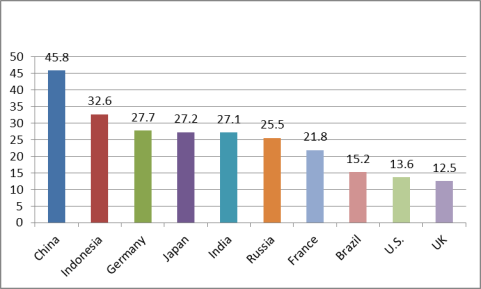
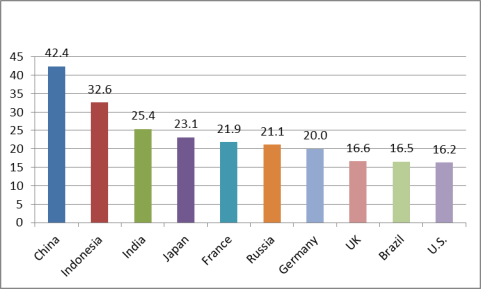
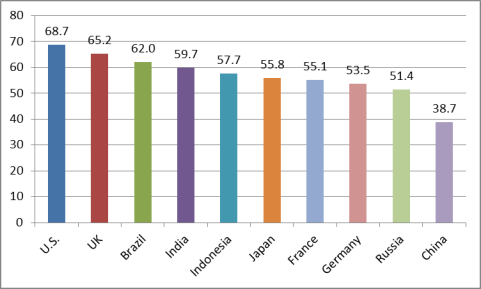
Many economists contend that China's economic model has produced large internal imbalances, characterized by high savings and fixed investment and relatively low private consumption, which may no longer sustainable. As indicated in Figure 21, from 1990 to 2014, Chinese gross savings as a percent of GDP and gross fixed investment as a percent of GDP both increased significantly, while private consumption as a percent of GDP declined sharply.80 China's gross savings as a percent of GDP and gross fixed investment as a percent of GDP are the highest among any of the world's largest economies (see Figures Figure 22 and Figure 23), while China's private consumption as a share of GDP is among the lowest. These data would imply that Chinese households have not benefited as much from China's economic growth as other sectors of the economy.
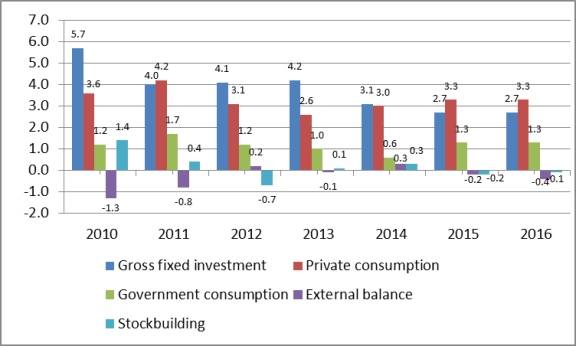
Many economists contend that the falling share of private consumption and disposable income relative to GDP is largely caused by two main factors: China's banking policies and the lack of an adequate social safety net. The Chinese government places restrictions on the export of capital. As a result, Chinese households put a large share of their savings in domestic banks. The Chinese government sets the interest rate on deposits. Often this rate is below the rate of inflation, which lowers household income. Some economists consider this policy to constitute a transfer of wealth from Chinese households to Chinese firms which benefit from low interest rates. This "tax" on household income negatively affects household consumption. Secondly, China's lack of an adequate social safety net (such as pensions, health care, unemployment insurance, and education) induces households to save a large portion of their income. According to one estimate, between 1982 and 2012, the average urban household saving rate rose from 12% to 32%.81 Corporations are also a major contributor to the high savings rate in China. Many Chinese firms, especially SOEs, do not pay out dividends and thus are able to retain most of their earnings. Many economists contend that requiring the SOEs to pay dividends could boost private consumption in China if the money was then used to help fund social welfare programs. Chinese economic policies have resulted in gross fixed investment being the main engine of the country's economic growth for every year from 2000 to 2014. (In 2011 gross fixed investment and private consumptions each accounted for 3.0 percentage points; see Figure 21.82)
A 2009 IMF report estimated that fixed investment related to tradable goods plus net exports together accounted for over 60% of China's GDP growth from 2001 to 2008 (up from 40% from 1990 to 2000), which was significantly higher than in the G-7 countries (16%), the euro area (30%), and the rest of Asia (35%).83 The global financial crisis led to a sharp fall in demand for Chinese exports, which helped sharply reduce China's trade surpluses. The Chinese government responded in part by sharply increasing spending on fixed investment. As a result, fixed investment as a share of GDP rose from 40.5% in 2008 to 45.9% in 2013.
|
Figure 21. Chinese Gross Savings, Gross Fixed Investment, and Private Consumption as a Percent of GDP: 1990-2016 (percent) |
 |
|
Source: Economist Intelligence Unit. |
|
Figure 22. Comparison of Gross Savings Rates for Major Global Economies in 2016 (percent of GDP) |
 |
|
Source: Economist Intelligence Unit. |
|
Figure 23. Comparison of Gross Fixed Investment for Major Global Economies in 2016 (percent of GDP) |
 |
|
Source: Economist Intelligence Unit. |
|
Figure 24. Comparison of Private Consumption of Major Global Economies in 2016 (percent of GDP) |
 |
|
Source: Economist Intelligence Unit. |
Some Indicators of Rebalancing
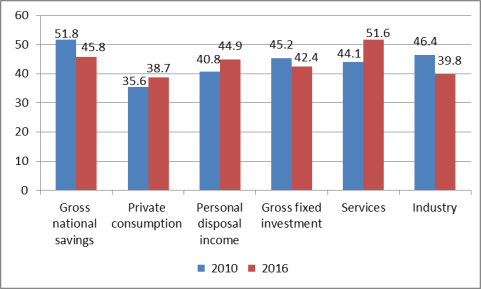
Some rebalancing of China's economy may have occurred in recent years. For the past several years, gross fixed investment (some of which is linked to tradable sectors) has generally been the largest contributor to China's real GDP growth. For example, from 2000 to 2014, fixed investment was the largest source of China's GDP growth 11 out of 14 years. However, in both 2015 and 2016, private consumption was the largest contributor to GDP growth (see Figure 25). In addition, from 2010 to 2016: China's gross savings as a percent of rate fell from 51.8% to 45.8%, private consumption84 as a share of GDP increased from 35.6% to 38.7%, and gross fixed investment as a percent of GDP dropped from 45.2% to 42.4%. Another useful indicator is the broad sector composition of China's GDP (i.e., agriculture, industry, and services), referred to as gross value added at factor cost. The output of industry has surpassed that of services for many years.85 In 2012, services output overtook industrial output for the first time and have grown in importance through 2016. From 2010 to 2016, the output of services as a percent of GDP grew from 44.1% to 51.6%, while the output of industry to GDP dropped from 46.4% to 39.8% (see Figure 26).
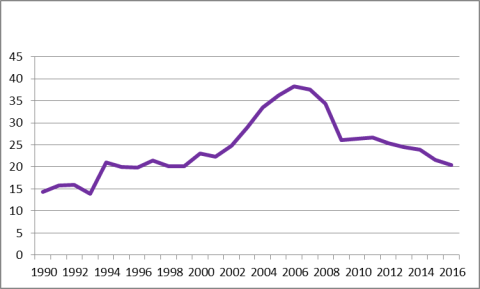
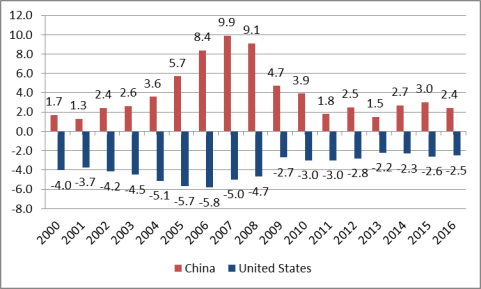
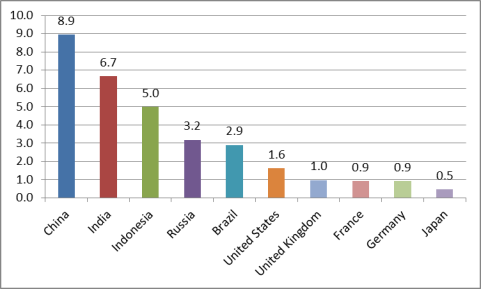
In terms of trade, China has become much less reliant on exports than in the past. Its exports of goods and services as a percent of GDP dropped from a peak of 38.3% in 2006 to 20.5% in 2016 (see Figure 27). In addition, China's trade surpluses as a percent of GDP have fallen sharply in recent years. China has run current account (CA) surpluses every year since 1994. From 2001 to 2007, China's CA surpluses as a percent of GDP rose from 1.3% to a historical high of 9.9%. Since then, China's CA surplus as a percent of GDP has fallen sharply, reaching and estimated 2.4% in 2016 (see Figure 28). Much of that decline was likely caused by the effects of the global economic slowdown that began in 2008, which sharply reduced foreign demand for Chinese exports. However, some of the decline may also have been the result of increased Chinese private consumption. As indicated in Figure 29, the growth of Chinese private consumption over the past 10 years has among the fastest of any major economy, averaging 8.9% annually compared with 1.6% for the United States.
|
Figure 25. Sources of Chinese GDP Growth: 2010-2016: Percentage Points |
 |
|
Source: Economist Intelligence Unit. |
|
Figure 26. Summary of Chinese Economic Rebalancing: 2010 Versus 2016 (percent of GDP) |
 |
|
Source: Economist Intelligence Unit. |
|
Figure 27. Chinese Exports of Goods and Services: 1990-2016 Percent of GDP |
 |
|
Source: Economist Intelligence Unit. |
|
Figure 29. Average Annual Growth in Private Consumption: 2007-2016 (percent) |
 |
|
Source: Economist Intelligence Unit. |
Environmental Challenges
China's economic growth model has emphasized the growth of heavy industry in China, much of which is energy-intensive and high polluting. The level of pollution in China continues to worsen, posing serious health risks to the population. The Chinese government often disregards its own environmental laws in order to promote rapid economic growth. China's environmental challenges are illustrated by the following incidents and reports.
- A 2015 study by the Rand Corporation estimated that the costs (in terms of health impact and lost productivity) from China's air pollution were equal to 6.5% of GDP each year from 2000 to 2010. It further estimated the costs as a percent of GDP of water pollution and soil degradation at an additional 2.1% and 1.1%, respectively.86
- A 2014 OECD report estimated the health costs of China's air pollution in 2010 at $1.4 trillion.87
- The U.S. Embassy in Beijing, which monitors and reports air quality in China based on an air quality index of particle matter (developed by the U.S. Environmental Protection Agency) considered to pose a health concern, reported that the air quality in Beijing for a majority of the days in January 2013 ranged from "unhealthy" to "hazardous" (based on 24-hour exposure) and, on a few days, it recorded high readings that were "beyond index."88 The level of poor air quality in Beijing was termed by some in China as "Airpocalypse," and reportedly forced the government to shut down some factories and reduce the level of official cars on the road.89 On December 9, 2013, China's media reported that half of China was blanketed by smog.90 The U.S. Consulate General in Shanghai reported that were a number of days in December 2013 where its measurement of the air quality in Shanghai was hazardous or very unhealthy, and during some time periods on December 5, 2013, its readings were "beyond index." According to the U.S. Embassy in Beijing, from 2008 to 2015, nearly two-thirds of the days in Beijing had air pollution considered to be unhealthy.91
- In February 2013, China's Geological Survey reportedly estimated that 90% of all Chinese cities had polluted groundwater, with two-thirds having "severely polluted" water.92
- According to a 2012 report by the Asian Development Bank, less than 1% of the 500 largest cities in China meet the air quality standards recommended by the World Health Organization, and 7 of these are ranked among the 10 most polluted cities in the world.93
- The U.S. Energy Information Administration (EIA) projected in 2011 that by 2035, China's carbon dioxide emissions (CO2) could be nearly double its current levels.94 A study by ExxonMobil projects that, by 2030, China's CO2 emissions could equal the level in the United States and EU combined.95
- The World Health Organization estimated that air pollution in China caused the death of 470,649 people in 2008.96
The Chinese government has sharply criticized foreign governments for reporting air quality in China, calling their readings inaccurate and complaining that releasing such data violates international conventions and Chinese laws.97 At the same time, China's media has boosted its reporting of China's environmental problems in response to public anger, prompting central government officials to promise new steps to reduce emissions. However, the central government has often found it difficult to induce SOEs and local governments to comply with environmental laws, especially when such officials feel doing so will come at the expense of economic growth.
On August 12, 2015, a series of large explosions in several warehouses containing chemicals occurred in the Chinese port city of Tianjin, which has claimed the lives of at least 163 people. Some press reports have blamed poor government enforcement of environmental regulations for the disaster. For example, some in China have questioned why dangerous chemicals were warehoused so close to residential areas and have raised concerns over the extent of chemical contamination in the area that may have resulted from the explosions.98
Corruption and the Relative Lack of the Rule of Law
The relative lack of the rule of law in China has led to widespread government corruption, financial speculation, and misallocation of investment funds. In many cases, government "connections," not market forces, are the main determinant of successful firms in China. Many U.S. firms find it difficult to do business in China because rules and regulations are generally not consistent or transparent, contracts are not easily enforced, and intellectual property rights are not protected (due to the lack of an independent judicial system). The relative lack of the rule of law and widespread government corruption in China limit competition and undermine the efficient allocation of goods and services in the economy. A New York Times article reported that (former) Chinese Premier Wen Jiabao's family controlled assets worth at least $2.7 billion.99 One study estimates that between 2001 and 2010, China was the world's largest source of illicit capital outflows at $3.8 trillion.100 A 2012 survey by the Pew Research Center's Global Attitudes Project reported that 50% of respondents said that corrupt officials are a very big problem (up from 39% in 2008).101 Chinese officials often identify government corruption as the greatest threat to the Chinese Communist Party and the state. The Chinese government's anti-corruption watchdog reported that 106,000 officials were found guilty of corruption in 2009.102 Since assuming power in 2012, Chinese Xi Jinping has carried out an extensive ant-corruption drive. China has reportedly sought cooperation with the United States to obtain extradition of 150 alleged corrupt officials who have fled to the United States.103 However, many analysts contend that government anti-corruption campaigns are mainly used to settle political scores with out-of-favor officials. Some analysts contend that President's Xi anti-corruption drive is more about consolidating his own political than instituting reforms.104 In addition, there are some indicators that the current ant-corruption campaign may be having a negative impact on the Chinese economy, due to hesitancy by some local officials to pursue projects they feel will lead to scrutiny from the central government.105 Many observers and argue that meaningful progress against government corruption cannot occur without greater government transparency, a system of checks and balances, a free press, Internet freedom, and an independent judiciary.106 In October 2014, China held its fourth Plenum of the 18th Party Conference. The meeting focused on the need to enhance the rule of law in China, but emphasized the leading role of the Communist Party in the legal system.107
China maintains a weak and relatively decentralized government structure to regulate economic activity in China. Laws and regulations often go unenforced or are ignored by local government officials. As a result, many firms cut corners in order to maximize profits. This has led to a proliferation of unsafe food and consumer products being sold in China or exported abroad. Lack of government enforcement of food safety laws led to a massive recall of melamine-tainted infant milk formula that reportedly killed at least four children and sickened 53,000 others in 2008.
Demographic Challenges
Many economists contend that China's demographic policies, particularly its one-child policy (first implemented in 1979), are beginning to have a significant impact on the Chinese economy. For example, according to a McKinsey Global Institute study, China's fertility rate fell from about 5.8 births per woman in 1964 to 1.6 in 2012.108 This is now affecting the size of the Chinese workforce.
The existence of a large and underemployed labor force was a significant factor in China's rapid economic growth when economic reforms were first introduced. Such a large labor force meant that firms in China had access to a nearly endless supply of low-cost labor, which helped enable many firms to become more profitable, which in turn led them to boost investment and production. Some economists contend that China is beginning to lose this labor advantage. China's working population has reportedly fallen for three straight years (in 2014, it reportedly dropped by 3.7 million people).109 McKinsey Global Institute predicts that over the next 50 years, China's labor force could shrink by one-fifth. Some economists contend such factors will lead to much smaller rates of future economic growth. As the labor force shrinks, Chinese wages could begin to rise faster than productivity and profits growth, which could make Chinese firms less competitive, and result in a shift of labor-intensive manufacturing overseas.110
The one-child policy has also resulted in a rapidly aging society in China.111 According to the Brooking's Institute, China already has 180 million people aged over 60, and this could reach 240 million by 2020 and 360 million by 2030. The population share of people aged over 60 could reach 20% by 2020, and 27% by 2030.112 With a declining working population and a rising elderly population, the Chinese government will face challenges trying to boost worker productivity (such as enhancing innovation and high-end technology development) and to expand spending on health care and elderly services. China's Hukou (household registration) system also poses challenges to the government.
|
China's Hukou System113 First introduced in 1951, the Chinese Hukou (household registration) system is a categorization of its citizens based on both their place of residence and eligibility of certain socioeconomic benefits. Hukou is issued through a registration process administered by local authorities and solidified into inheritable social identities.114 The classification of the system is composed by two related parts: socioeconomic eligibility (agriculture/non-agriculture); and residential location (living in urban/rural areas). The Chinese government imposed the system with the purpose regulating population distribution, especially in regards to cities. Since economic reforms were begun in 1979, hundreds of millions of people have been allowed to leave their home towns to work in urban areas, such as Shanghai. The number of rural laborers working in China's cities was 274 million in 2014, over one-third (36%) of the total workforce.115 Although such workers are allowed to reside in the cities where they work, they are generally denied access to social entitlements, such as pensions, medical insurance, and basic education for children. This forces such workers to save a very high level of their income to pay for these services. Due to China's desire to increase the urbanization of its population, combat demographic disparities, and to boost domestic consumption, the Chinese government is currently considering implementing new reforms to the Hukou system. |
Challenges to U.S. Policy of China's Economic Rise
China's rapid economic growth and emergence as a major economic power have given China's leadership increased confidence in its economic model. Many believe the key challenges for the United States are to convince China that (1) it has a stake in maintaining the international trading system, which is largely responsible for its economic rise, and to take a more active leadership role in maintaining that system; and (2) that further economic and trade reforms are the surest way for China to grow and modernize its economy. Lowering trade and investment barriers would boost competition in China, lower costs for consumers, increase economic efficiency, and spur innovation. However, many U.S. stakeholders are concerned that China's efforts to boost the development of indigenous innovation and technology could result in greater intervention by the state (such as subsidies, trade and investment barriers, and discriminatory policies), which could negatively affect U.S. IP-intensive firms.
Opinions differ as to the most effective way of dealing with China on major economic issues. Some support a policy of engagement with China using various forums, such as the newly-created U.S.-China Comprehensive Economic Dialogue. Others support a somewhat mixed policy of using engagement when possible, coupled with a more aggressive use of the World Trade Organization (WTO) dispute settlement procedures to address China's unfair trade policies. Still others, who see China as a growing threat to the U.S. economy and the global trading system, advocate a policy of trying to contain China's economic power and using punitive measures when needed to force China to "play by the rules."
China's growing economic power has made it a critical and influential player on the global stage on a number of issues important to U.S. interests, such as global economic cooperation, climate change, nuclear proliferation, and North Korean nuclear missile program.116 China is in a position to help advance U.S. interests or to frustrate them. China's rising economy has also enabled it to boost its military capabilities.
U.S. policymakers face a number of complex challenges on how to deal with these issues. Can the United States compel better behavior from China via quiet diplomacy or public confrontation? Has U.S. leverage over Beijing lessened in the wake of China's economic rise, and has China's leverage over Washington increased? Are China's new leaders serious about undertaking comprehensive reforms as outlined in the Third Plenum?117 Does Chinese President Xi Jinping have the power to implement new economic reforms if they are opposed by other factions of the government that have a stake in maintaining the status quo? To what extent will the Chinese government be willing to reduce or eliminate preferential policies (such as subsidies and preferential bank loans) given to SOEs? Will the reforms result in a significant reduction in trade and investment barriers against U.S. firms? China has become increasingly active in boosting its economic ties with other countries, such as by negotiating FTAs and pledging to help finance large-scale infrastructure projects in numerous countries under its One Belt, One Road initiative. What implications could these initiatives have on U.S. economic interests? How does the U.S. withdrawal from the TPP affect its economic leadership role in the Asia-Pacific region in terms of promoting more liberalized trade? Did the TPP withdrawal diminish U.S. leverage with China in terms of implementing economic reforms (since China had expressed interest in TPP membership)? Will the Trump Administration resume negotiations to reach a bilateral investment treaty with China?
Some financial analysts have raised concerns over China's economic slowdown in recent years, the relatively slow pace of economic reforms, and what many believe to be a worsening business climate for foreign exporters and investors. On the one hand, China appears to be rebalancing its economy away from rapid growth that is driven by high fixed investment, exporting, and heavy industry, to a more consumption-based economy with greater emphasis on services and innovation. For some, China's slower economic growth rates are a positive development. However, the Chinese government continues to emphasize the role of the state in the economy, and it is unclear whether it is willing to implement the type of comprehensive economic reforms that are needed to ensure that healthy economic growth continues in the years ahead. Some economists warn that the absence of new reforms could cause the Chinese economy to stagnate in the years ahead, which in turn could negatively affect the global economy. Others are concerned that China's increased use of industrial policies to advance its goals of boosting innovation and advancing advanced manufacturing may negatively impact U.S. high technology firms if such policies restrict market access for U.S. firms.