The U.S. Coal Industry
Introduction
The Trump Administration has taken several actions intended to help revive the U.S. coal industry. Within its first two months, the Administration rolled back or began reversing several coal-related regulations finalized under the Obama Administration. For example, the Trump Administration repealed the coal valuation rule on August 7, 2017, effective on September 6, 2017.1
This effort was undertaken as three of the largest coal producers continued recovery from Chapter 11 bankruptcy, and occurred in the context of higher coal prices (making coal production possibly more profitable), lower inventories, and higher natural gas prices—factors that could lead to coal being more competitive as a fuel source for electricity generation. Coal will likely remain an essential component of the U.S. energy supply, but how big of a role will it play?
As the Trump Administration is focused on reversing some of the Obama Administration's coal-related rules, congressional action in the 115th Congress has primarily centered on assistance to distressed coal communities (e.g., H.R. 405/S. 76, H.R. 663, and H.R. 1731/S. 728) and coal miner health benefits (e.g., H.R. 179/S. 175, H.R. 323, and H.R. 1613). There is also legislation proposing coal leasing reform (S. 737), preventing new coal and other fossil fuel leasing on federal lands (H.R. 2242/S. 750), and preventing new self-bonding for coal projects (H.R. 1819/S. 800).
The United States sits on abundant coal reserves and resources, but it also has an abundance of natural gas resources. Additionally, because of technical innovation and regulatory incentives, costs for renewable energy are declining, leading to a likely long-term growth trend in renewable energy capacity. Even though U.S. coal production remained consistent at over 1 billion short tons annually over the past two decades (until recently), coal is losing its share of the overall U.S. energy market, primarily to natural gas. Just a few years ago, coal production, consumption, and exports were at or near record levels, but 2015 and 2016 saw significant declines. One of the challenges for the industry is how to penetrate the overseas coal market, particularly for steam coal, to compensate for declining domestic demand.
Domestic and global concerns over the potential environmental impacts from burning coal, particularly around carbon dioxide (CO2) emissions and climate change, are leading to clean coal alternatives and the greater use of natural gas and renewables.
There is also the domestic concern over job losses and long-term impacts within coal communities. If coal jobs do not come back in large numbers, what new employment opportunities could be created?
At the global scale, some emerging countries see coal as the primary path to electric generation in the short term, while at the same time more developed countries such as Canada and those in Europe are moving away from coal and toward renewable energy. China, which currently consumes over 50% of the world's coal and is expected to remain the largest coal consumer over the long term, is seeking to implement a more balanced energy strategy as a response to the environmental impacts of burning coal.2
Beginning in the 1970s, U.S. coal operators were required to comply with numerous federal and state regulations including stream buffer rules, effluent guidelines, underground injection control, and siting and reclamation rules.3 As U.S. energy policy and environmental regulations are debated, there is ongoing congressional interest in the role of coal in meeting U.S. and global energy needs. The question may not be whether the domestic production of coal is here to stay but, rather, how much U.S. coal will be burned, what type (e.g., from which region), and under what regulatory framework.
Coal mining is capital intensive, and coal prices (like other commodity prices) are volatile. The coal industry will be challenged to be profitable in the current environment whether or not the industry incorporates social and environmental costs. A McKinsey and Company report that was critical of the financial health of the coal industry questioned whether the industry could overcome long-term indebtedness and abundant low-cost natural gas supplies in order to compete in the global export market.4
This report reviews the historical trends (over the past 30 years) and recent developments in the U.S. coal industry, including coal development on federal lands, but does not cover the health, safety, and labor union issues associated with coal mining. (For more details on the health benefits issue, see CRS In Focus IF10616, Health Benefits for United Mine Workers of America Retirees, by John J. Topoleski.) For more details on environmental issues, see CRS Report R44150, The Office of Surface Mining's Stream Protection Rule: An Overview and CRS Report R44341, EPA's Clean Power Plan for Existing Power Plants: Frequently Asked Questions.
Appendix A provides a primer on coal (including Table A-1, which reflects more current production and consumption data published by the EIA; for the purposes of showing more disaggregated data for production and consumption, Table 1 and Table 4 in the text use EIA Annual Coal Report data). Appendix B provides selected coal production company profiles, and Appendix C provides a list of selected coal-related CRS reports that are not otherwise referenced in this report.
U.S. Coal Reserves and Resources5
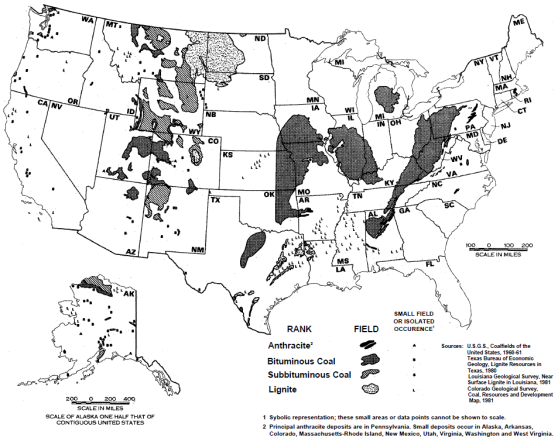
The United States has the largest coal reserves and resources in the world. The Energy Information Administration (EIA) estimates there are about 255 billion short tons (Bst) of recoverable domestic coal reserves. The U.S. total demonstrated resource base (DRB) is estimated at about 477 Bst.6 Coal resource deposits are found in various regions in the United States (see Figure 1), with the dominant coal reserve owner being the U.S. government.
EIA statistics show that more than half (55%) of U.S. coal reserves are located in the West, of which Montana and Wyoming together account for 43% of total U.S. reserves. About 70% of U.S. coal reserves are located in the top five producing states, which are Wyoming, West Virginia, Pennsylvania, Illinois, and Kentucky.7 The U.S. government owns about one-third, or 88 Bst, of U.S. domestic coal reserves, followed by Great Northern Properties Limited Partnership (20 Bst) and Peabody Energy Corporation (6.3 Bst).8 Altogether, the top three reserve owners account for about 44% of U.S. coal reserves.
Trends and Recent Developments in the U.S. Coal Industry
Coal Production
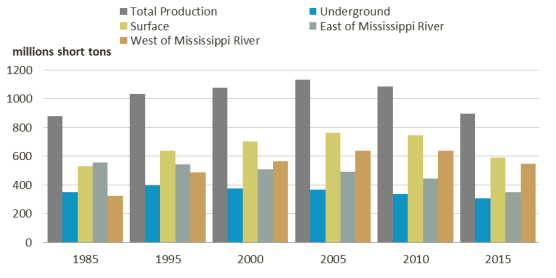
U.S. coal production had been strong since the 1990s (above or near 1 Bst per year until 2014), and reached its highest level of production in 2008 (1.17 Bst) before it declined precipitously in 2015 (see Table 1 and Figure 2) and 2016.9 EIA current data and short-term projections show coal production remaining under 800 million tons in 2017 and 2018 (see Table A-1).
The prospects are not promising for a reversal of fortunes for U.S. coal mining in the long run, particularly for underground eastern coal, as lower-cost Powder River Basin (PRB) coal (with its extensive reserves) maintains its dominance and as Interior Region coal gains ground.10 Western coal, in general, has gradually risen from about 53% of U.S. production in 2000 to 61% of production in 2015, and is expected to retain a majority position at 51% through 2050, according to EIA's long-term reference case.11 Production from the Interior Region would gain from 18% in 2015 to 28% of total U.S. coal production by 2050.12 Long-term EIA projections show that coal production would fall below 600 million short tons (mst) per year under the reference case that includes the implementation of the Obama Administration's Clean Power Plan (CPP). Without CPP, coal production would remain relatively flat, at between 800 million and 900 million short tons per year through 2050.13
|
Year |
Total Production |
Underground |
Surface |
East of Mississippi River |
West of Mississippi River |
|
1985 |
878.5 |
348.8 |
529.7 |
553.7 |
324.8 |
|
1990 |
1,029.1 |
424.5 |
604.5 |
— |
— |
|
1995 |
1,033.0 |
396.2 |
636.7 |
544.2 |
488.7 |
|
2000 |
1,073.9 |
373.7 |
699.9 |
507.5 |
566.1 |
|
2005 |
1,131.5 |
368.6 |
762.2 |
493.1 |
637.7 |
|
2010 |
1,084.4 |
337.1 |
745.4 |
444.3 |
638.2 |
|
2015 |
896.9 |
306.8 |
588.7 |
347.6 |
548.0 |
Source: EIA, Annual Coal Report, various years.
 |
|
Source: Energy Information Administration, http://www.eia.gov/coal/reserves. Note: The "Lower 48" U.S. states are divided into three coal regions: Appalachia, Interior, and Western. |
 |
|
Source: EIA, Annual Coal Report, various years. |
Coal Mining Employment and the Number of Mines
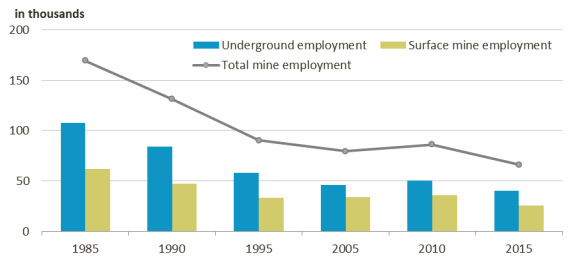
The trend in coal mining has been to improve labor productivity, or to make production more efficient, with the use of technology. There were sharp increases in labor productivity (more coal per man-hour) in the 1980s and 1990s, as labor productivity more than doubled from 2.74 average production per employee hour in 1985 to 7.02 in 2000, particularly at coal mines in the West (see Table 2). There is no indication that the coal industry will see a reversal of these production trends, even if there are some short-term gains in employment.14 Any employment gains would be starting from a historically low level. As shown in Table 2 and Figure 3, coal mining employment declined from 169,300 in 1985 to 71,500 in 2000 (a 57% decline), then rose to a recent high of 86,100 in 2010 (as coal production was rising) before falling again to a historic low, 65,900, in 2015.15
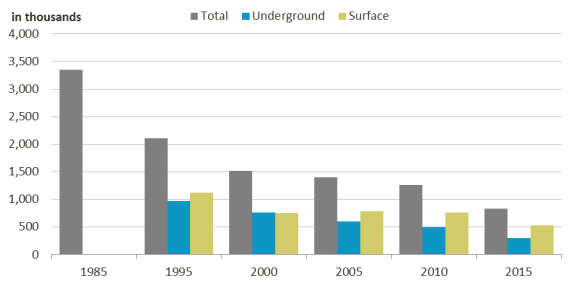
A similar pattern was true for the number of coal mines, as the majority of the decline occurred between 1985 and 2000, when the number of coal mines fell by 55% (from 3,355 to 1,513) before declining further by 45% from 2000 to 2015 (from 1,513 to 834). As coal production was trending upward, reaching its peak in 2008, the number of coal mines declined dramatically (see Table 3 and Figure 4). Additionally, the number of coal mining firms has decreased in the United States, while the size of the average mine and output per mine have increased.
If mines continue to close, particularly underground mines east of the Mississippi, and large-scale surface mines in the West stay more economical, then the impact on coal mine employment may continue to disproportionately affect eastern coal miners. Recently, however, overall employment losses among underground and surface mines have been similar. For example, from 2010 to 2015 employment losses in underground and surface mining operations were about 10,000 each (see Table 2).
|
Year |
Total Mine Employment |
Underground Employment |
Surface Mine Employment |
Labor Productivitya |
|
1985 |
169.3 |
107.4 |
61.9 |
2.74 |
|
1990 |
131.3 |
84.1 |
47.1 |
3.83 |
|
1995 |
90.3 |
57.9 |
33.4 |
5.38 |
|
2000 |
71.5 |
na |
na |
7.02 |
|
2005 |
79.3 |
45.6 |
33.6 |
6.36 |
|
2010 |
86.1 |
50.5 |
35.5 |
5.55 |
|
2015 |
65.9 |
40.1 |
25.8 |
6.28 |
Source: EIA, Annual Coal Report, various years.
a. Labor productivity is measured as average production per employee hour (in short tons). For surface mines, labor productivity rose from an average of 4.24 in 1985 to 11.05 in 2000, currently at 10.42. Underground mines' labor productivity went from 1.78 in 1985 to 4.17 in 2000 and currently stands at 3.35 (as of 2015).
 |
|
Source: EIA, Annual Coal Report, various years. Note: 2000 data for underground and surface coal mining employment was not available from EIA. |
|
Year |
Total |
Underground |
Surface |
|
1985 |
3,355 |
— |
— |
|
1990 |
— |
— |
— |
|
1995 |
2,104 |
977 |
1,127 |
|
2000 |
1,513 |
767 |
746 |
|
2005 |
1,398 |
606 |
792 |
|
2010 |
1,257 |
497 |
760 |
|
2015 |
834 |
305 |
529 |
Source: EIA, Annual Coal Report, various years. See http://www.eia.gov/.
Note: Empty cells indicate incomplete data from EIA Annual Coal Reports.
 |
|
Source: EIA, Annual Coal Report, various years. See http://www.eia.gov/. Note: The omission of 1985 underground and surface mining data, and of all 1990 data, indicates incomplete data from EIA Annual Coal Reports. |
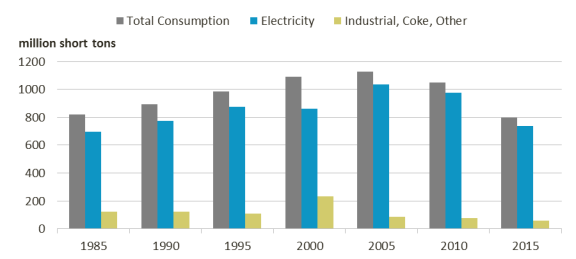
Coal Consumption
Coal consumption in the United States was consistently over 1 billion tons per year from 2000 (peaking in 2007, at 1.128 billion tons per year) until 2012, when demand fell below 900 million short tons (mst) (see Table A-1; for pre-2000 levels, see Table 4 and Figure 5). The EIA projects coal consumption to remain below 800 mst in the short term (from 2017 to 2018) and to drop close to 500 mst in its long-term reference case that includes the implementation of CPP.16 Without CPP, U.S. coal consumption levels would rise slightly above 800 mst until 2030, before falling below 800 mst in 2040 and remaining there through 2050, the end of the projection period.17
In either case (declining or flat demand), coal consumption would continue to be a smaller share of the total U.S. energy pie. Societal concern for cleaner air is one reason for depressed coal consumption, along with many other factors, including low natural gas prices and large gas supplies as a result of advanced drilling techniques.
|
Year |
Total Consumptiona |
Electricity |
Industrial, Coke, Other |
|
1985 |
818.1 |
693.8 |
124.3 |
|
1990 |
895.5 |
773.6 |
121.9 |
|
1995 |
983.3 |
874.7 |
108.6 |
|
2000 |
1,089.9 |
859.3 |
230.6 |
|
2005 |
1,125.5 |
1,037.5 |
88.0 |
|
2010 |
1,051.3 |
975.1 |
76.2 |
|
2015 |
797.7 |
738.0 |
59.7 |
Source: EIA, Annual Coal Report, various years.
a. Coal is typically characterized as either metallurgical coal or steam (thermal) coal. Metallurgical coal (bituminous coal) has properties required to create coke (a porous, hard black rock, with high carbon content and little moisture), which is used for making iron and steel. Steam coal is used to generate electricity. Its properties are not suitable to form coke.
 |
|
Source: EIA, Annual Coal Report, various years. See http://www.eia.gov/. |
Electric power generation is the primary market for coal, accounting for about 93% of total consumption. With the retirement of many coal-fired power plants and the building of new gas-fired plants, accompanied by relatively flat electricity demand, there has been a structural shift in demand for U.S. coal—one that will likely result in reduced capacity for coal-fired electricity generation over the long run.18 Historically, coal maintained a 50% share of the electricity generation market until 2008 and now accounts for about 32% of the market (for more details on the electricity market, see CRS Report R42950, Prospects for Coal in Electric Power and Industry, by Richard J. Campbell, Peter Folger, and Phillip Brown). In 2016, natural gas overtook coal as the primary fuel for power generation. Also, the EIA projects renewables' share of the electricity generation market will grow by 2.6% annually through 2050, with renewables capturing 28% of the market by the end of the forecast period. Simultaneously, coal's share of the market would fall to less than 20% in the reference case.19 In short, coal would likely account for a smaller portion of total U.S. energy consumption for years to come, replaced by natural gas and renewable energy, particularly for power generation.
The economics of coal versus natural gas may change in the near term, with coal prices and natural gas prices rising in 2017 (making coal operations more profitable), which may allow for some coal plants to be more competitive in some markets or regions.
But in the long run, as abundant U.S. shale gas resources are being produced economically—and if they can be produced in an environmentally sustainable manner—then natural gas would likely continue to increase its share of the electricity market for years to come.
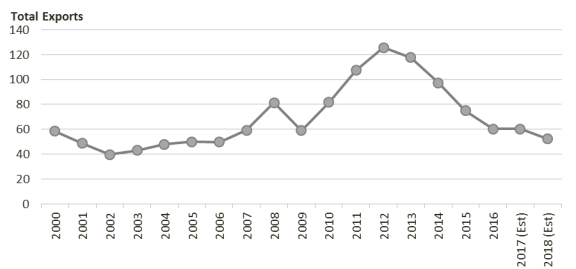
U.S. Coal Exports
One of the coal industry's greatest challenges is to increase sales to overseas coal markets, particularly for steam coal, to compensate for declining domestic demand. In the recent past, coal exports rose as domestic and global demand (particularly in China) increased, and continued to rise as domestic demand fell. But now both domestic demand and exports are in decline. The EIA's reference case forecasts coal exports to continue declining in the short term (2016-2018) but increasing to 85 million tons annually by 2050. Exports to Asia are expected to increase, but potential bottlenecks such as infrastructure (e.g., port development and transportation) and significant global competition could slow export growth.
The rise in U.S. coal exports through 2012 was aided by a drop in the value of the U.S. dollar against other currencies, including those of other major coal-exporting countries, such as Australia, Indonesia, and Russia. Coal exports from the United States more than doubled from 2000 to 2012 before declining in 2015 to an estimated 75 mst as global coal demand slowed. In 2011, U.S. coal exports broke 100 mst for the first time since 1992 and in 2012 peaked at 126 mst, surpassing their previous peak of almost 113 mst in 1981. (See Figure 6.)
Several key factors are likely to influence how much coal will be exported from the United States in the future, one of which is the building of export terminals, particularly for PRB (Western) coal. Another major factor is the level of global demand for metallurgical coal, which is used to make steel. Historically, metallurgical coal has been the primary coal exported by the United States, and primarily to the European market, which has been in decline.20 In 2016, metallurgical coal accounted for 68% of U.S. total coal exports.21
PRB coal is exported primarily from Canadian terminals at Roberts Bank near Vancouver, British Columbia, and Ridley Terminal at Prince Rupert, British Columbia. PRB coal is transported to both facilities for export via rail. However, the Canadian export terminals have reached capacity.22
Although the Canadian export facilities have plans for expansion that may better accommodate U.S. exports,23 PRB coal producers have been searching for a potential domestic export link to the growing Asian market through the Pacific Northwest, so far without success. Three port terminal projects for exporting coal in Washington and Oregon had permit applications before the U.S. Army Corps of Engineers (the Corps), although none advanced:24 The Gateway Pacific Terminal and Coyote Island Terminal projects were cancelled due to permit denials,25 and as Washington State's Department of Ecology was preparing the final environmental impact statement for the Millennium Bulk Terminal, the State of Washington denied the Millennium project a permit to build on state land.26
|
(in million short tons) |
 |
|
Source: EIA, Monthly Energy Review, September 2016, p. 97; and Coal Short-Term Outlook, April 2017. |
Structure of the U.S. Coal Industry
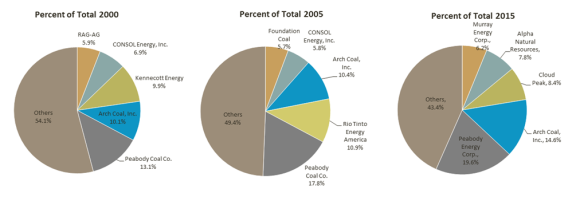
Background on the Industry
The coal industry is highly concentrated in the United States, with just a handful of major producers, operating primarily in four states (Wyoming, West Virginia, Kentucky, and Illinois). In 2015, the top five coal mining companies were responsible for about 57% of U.S. coal production, led by Peabody Energy Corp. with 19.6% and Arch Coal Inc. with 14.6% (see Table 5 and Figure 7). Other major producers include Cloud Peak Energy, Alpha Natural Resources (ANR), and Murray Energy Corp.
In 2000, the top five producers accounted for about 46% of total U.S. coal production. That year, the two leading producers were Peabody Energy Corp., with 13.1% of production, followed by Arch Coal Inc., with 10.1% of production. The next three top producers were Kennecott Energy, CONSOL Energy Inc., and RAG-AG.
The major coal producers made numerous acquisitions in 2011 in anticipation of stronger global demand, although it was during a period of slowing domestic coal demand, weak coal prices, and more competitive natural gas supplies. The huge debt load and coal overproduction during this period was not sustainable and led to the bankruptcy of many coal firms.
Three of the top five coal producers have filed for Chapter 11 bankruptcy protection (see Table 5) since August 2015 (ANR in August 2015, Arch Coal in February 2016, and Peabody Energy in April 2016). Other major producers such as Patriot Coal, Walter Energy, and James River Coal have filed as well. All told, over 50 coal producers have filed for bankruptcy in the past two years, with a total of $19.3 billion in debt being reorganized. The three largest producers that filed for bankruptcy (Peabody, Arch, and ANR) alone accounted for 42% of U.S. coal production in 2015.27
|
2015 |
2005 |
2000 |
|||||||||
|
Producer |
Percent of Total |
Producer |
Percent of Total |
Producer |
Percent of Total |
||||||
|
|
Peabody Coal Co. |
|
Peabody Coal Co. |
|
|||||||
|
Arch Coal Inc.b |
|
Rio Tinto Energy Americac |
|
Arch Coal Inc. |
|
||||||
|
Cloud Peak Energy |
|
Arch Coal Inc. |
|
Kennecott Energy |
|
||||||
|
Alpha Natural Resources (ANR)b |
|
CONSOL Energy Inc. |
|
CONSOL Energy Inc. |
|
||||||
|
Murray Energy Corp. |
|
Foundation Coal |
|
RAG-AG |
|
||||||
Source: EIA, Annual Coal Report 2000, Annual Coal Report 2005, and Annual Coal Report 2015.
a. Peabody Energy Corp., incorporated in 1998, was previously known as Peabody Coal.
b. Filed for Chapter 11 bankruptcy.
c. Rio Tinto Energy America (RTEA), formerly named Kennecott, was a U.S. subsidiary of the Rio Tinto Group based in England. Rio Tinto spun off Cloud Peak Energy and its RTEA mines in 2010.
 |
|
Source: EIA, Annual Coal Report 2000, Annual Coal Report 2005, and Annual Coal Report 2015. |
Arch Coal, ANR, and Peabody Energy have emerged from Chapter 11 with a plan to move forward, selling off some holdings. Opponents of the coal industry and its restructuring are critical of the plans and of the long-term viability and reliability of the coal industry. A major challenge for the coal industry will be to attain access to financing needed for new or expanded projects, but following their reorganization and reduced debt levels, the larger coal firms are generally expected to be in a better position to be profitable.
|
Chapter 11 Bankruptcy Chapter 11 bankruptcy is known as a reorganization bankruptcy, and results in an automatic stay against creditors. It is thus used by businesses to eliminate and restructure debt, release (sell off) assets, or, in some cases, to liquidate. In a corporation, none of the stockholders' personal assets are at risk, only their investment in the company. When Chapter 11 is useful, the firm typically needs to sort out its affairs (e.g., stop collections), obtain a cash restructure (i.e., shed some unprofitable assets), and reduce its debt burden. The goals of Chapter 11 bankruptcy are the following:
The case begins with a company or individual filing a petition with a bankruptcy court. The petition may be voluntary or involuntary. (This box discusses voluntary petitions.) The voluntary petitioner must also file a schedule of assets and liabilities; current income and expenditures; a schedule of executory contracts; unexpired leases; and a statement of financial affairs. The entity (debtor) pays a filing fee with the petition. The debtor typically becomes the debtor-in-possession who typically keeps possession and control of its assets while going through Chapter 11 reorganization without the appointment of a trustee by the court. The debtor generally files a written disclosure statement and a reorganization plan with the bankruptcy court. The debtor-in-possession must account for the property, examine claims, and file information reports (e.g., monthly operating reports). Creditors whose assets are impaired—those who might be subject to issues, such as not receiving full value—vote on the plan by ballot. Acceptance of the Plan The debtor is given a timeline for filing a reorganization plan and a timetable for acceptance of the reorganization plan (with the possibility of an extension). The reorganization plan classifies the claims and identifies how each class will be addressed under the plan. Once the court approves the disclosure plan and the votes are counted, the court will hold a confirmation hearing to determine if the plan is put together in good faith, and whether to confirm the plan. The Discharge The new plan creates a new contractual right. Confirmation of a plan discharges the debtor obligations on any claim that may have been impaired if the plan does not include liquidation. In order to confirm, the court must find that (1) the plan is feasible, (2) the proposal is in good faith, and (3) the plan is in compliance with bankruptcy code. Sources: U.S. Courts, "Bankruptcy Basics," at http://www.uscourts.gov/services-forms/bankruptcy; Ken Ayotte, U.C. Berkeley School of Law, "A Primer on Bankruptcy Law and Trends in Corporate Bankruptcy Research"; and 11 U.S.C. §101 et seq. |
Research and Development
In an effort to minimize price and supply risk, electric utilities value diversity in power generation options. However, the choices for new power plant technologies are subject to Environmental Protection Agency (EPA) rules related to greenhouse gas (GHG) emissions, other air emissions, water discharges, and other environmental concerns. Carbon capture and sequestration (CCS) is one of the leading coal R&D efforts that might hold some promise for coal as a fuel for power generation if federal GHG emissions limits are implemented (see below).
|
Carbon Capture and Sequestration28 Carbon capture and sequestration (or storage)—known as CCS—has attracted congressional interest as a measure for mitigating global climate change. Large amounts of carbon dioxide (CO2) emitted from fossil fuel use in the United States are potentially available to be captured and stored underground using CCS, and prevented from reaching the atmosphere. Large, industrial sources of CO2, such as coal-fired electricity-generating plants, are likely initial candidates for CCS because they are predominantly stationary, single-point sources. Electricity generation contributes over 40% of U.S. CO2 emissions from fossil fuels. Currently, most U.S. power plants do not capture large volumes of CO2 for CCS; however, the Petra Nova carbon capture project, near Houston, TX, became the first large-scale CCS operation at a fossil fuel power plant in the United States, commencing operations in January 2017. Petra Nova will capture more than 1 million tons of CO2 per year, and transport the captured gas to a nearby oil field for the purposes of enhanced oil recovery (EOR). The only other large-scale CCS project at an electricity generating plant worldwide is the Boundary Dam project, in Saskatchewan, Canada, which began operations in October 2014 and is capturing approximately 1 million tons of CO2 each year, also mostly used for EOR. In 2012, the U.S. Department of Energy's (DOE's) CCS research, development, and deployment program embarked on commercial-scale demonstration projects for CO2 capture, injection, and storage. The success or failure of these projects will likely bear heavily on the outlook for widespread deployment of CCS technologies as a strategy for preventing large quantities of CO2 from reaching the atmosphere while U.S. power plants continue to burn fossil fuels. Congress has appropriated more than $7 billion for CCS activities at DOE. The American Recovery and Reinvestment Act of 2009 (P.L. 111-5) provided $3.4 billion of that total. Authority to spend Recovery Act funds expired on September 30, 2015. Of the $3.4 billion allocated for CCS activities, approximately $1.4 billion went unspent as of the spending deadline. Several large CCS demonstration projects were canceled, suspended, or failed to spend all of their Recovery Act funding before the 2015 deadline. DOE's Coal R&D program is pursuing improvements to first- and second-generation carbon capture technologies, and is seeking to augment technologies to ensure the permanent storage of CO2. Source: U.S. Department of Energy, National Energy Technology Laboratory, "Coal," at https://www.netl.doe.gov/research/coal. |
Federal Coal Resources
Congress continues debate on several issues regarding coal production on federal lands, including how to balance coal production against other resource values. Federal coal leases accounted for 40-42% of total U.S. coal production in recent years. Other concerns include how to assess the value of the coal resource, what is the fair market value (e.g., minimum bids) for the coal, and what should be the government's royalty. In response to these congressional concerns, a 2013 Government Accountability Office (GAO) analysis found inconsistencies in how the Bureau of Land Management (BLM) evaluated and documented federal coal leases.29 In addition, a 2013 Department of the Interior (DOI) Inspector General report found BLM may have violated provisions in the Mineral Leasing Act (MLA) by accepting below-cost bids for federal coal leases.30 Subsequently, the Secretary of the Interior announced the initiation of a new rule for the valuation of coal. A proposed rule was published on January 6, 2015, and finalized in July 2016.31
The Leasing Process for Federal Coal
The BLM administers coal leasing on all federal lands. All BLM coal leasing is done competitively except in cases where a party holds a "prospecting permit" issued prior to the Federal Coal Leasing Amendments Act of 1976 or where contiguous acres are added to existing leases. The process for coal leasing on federal lands is similar to the process for oil and gas leasing. It is governed by Section 2 of the Mineral Leasing Act, as amended. Federal coal leasing is based on the BLM's Resource Management Plan and the Forest Service Land Use Plans.
There are two processes by which federal lands may be leased for coal production. The first is "regional coal leasing," in which BLM selects tracts for leasing as needed to meet regional requirements as outlined by "regional coal teams" composed of BLM officials and interested state and local parties. The second is leasing by application whereby mining companies submit an application to lease certain tracts. Nearly all new coal leasing is done by application.
Restrictions on Federal Coal Resources: Administrative and Congressional Action
Under Section 437 of the Energy Policy Act of 2005, Congress directed the George W. Bush Administration to conduct an inventory and assessment of federal coal resources and restrictions on their development. The study was to identify lands available for coal development and restrictions on the lands and to identify environmentally compliant and super-compliant resources (based on sulfur dioxide emissions per million British thermal units [btus]).32 The study evaluated the Powder River Basin (PRB) federal land and coal resources.33
According to the study, the PRB contained 550 Bst, or 58% of the federal resources assessed, and PRB represents 88% of coal produced on federal lands.34 The total federal land ownership surveyed was 5.4 million acres (including split estate lands whereby the surface owner and mineral rights owner are two separate parties).
There are three major categories of land classification in the study:
- 1. leasing available under standard lease terms or with no surface occupancy;
- 2. leasing permitted with restrictions (possible leasing); and
- 3. leasing prohibited.
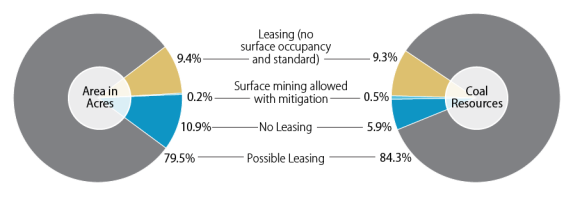
Leasing is prohibited on 591,000 acres in the PRB, which is estimated to contain 5.9% of potential federal coal. Leasing is "possible" on 4.3 million acres (subject to BLM's determination) containing an estimated 84.3% of federal coal resources (see Figure 8). Leasing is available under standard lease terms on 82,000 acres and available with no surface occupancy on 431,000 acres, containing 5% and 4.3% of federal coal resources, respectively.
|
Figure 8. PRB Federal Land and Coal Resources by Access Category |
 |
|
Source: Inventory of Assessed Federal Coal Resources and Restrictions to Their Development, prepared by U.S. Departments of Energy, Interior, and Agriculture in compliance with the Energy Policy Act of 2005, P.L. 109-58, August 2007. |
Trends and Recent Developments in Federal Coal Leasing
Federal Coal Leasing Moratorium
On January 16, 2016, President Obama announced a moratorium on federal coal leasing. The purpose of the moratorium was to examine the federal coal leasing program and to determine whether it needs to be "modernized." The Secretary of the Interior directed BLM (under Secretarial Order 3338) to prepare a programmatic environmental impact statement (PEIS) of the coal leasing program to serve as the basis for a comprehensive review. There has been both support and opposition in Congress to the moratorium.
On January 11, 2017, the Obama Administration published its scoping report35 as a prelude to the comprehensive draft and final PEIS. BLM presented three leasing modernization options centered on four main categories (in alignment with the Secretarial Order): fair return to the public, climate change and resource protection, the federal leasing system, and community assistance. In addition to the three possible options, the BLM discusses no action and no leasing alternatives.
The Trump Administration, however, issued an Executive Order on March 28, 2017, that amends or withdraws Secretarial Order 3338 and lifts "any and all" moratoria on federal coal leasing. Critics of the previous Administration's moratorium on new coal leases stated that there will be major impacts on coal communities and coal markets.36
Several environmental groups and the Northern Cheyenne Indian Tribe filed a lawsuit in a Montana-based federal court to keep the coal leasing moratorium in place and allow for the completion of the environmental review.37
The New Coal Valuation Rule
Concerns raised by various interest groups include the question of whether the public has been getting "fair market value" for the sale of coal leases.38 There has been little or no competition at most coal lease sales; thus, bonus bids were often at minimum levels. Some argued that the minimum bid levels of $100 per acre and the royalty rate levels (i.e., 8% on the value of production for underground mines and 12.5% for surface mines) are too low. There have been concerns over lease modifications that could allow coal mining operators to lease adjacent tracts for development without competition. According to the BLM, many of these tracts would otherwise go undeveloped.
The DOI (under the Office of Natural Resources Revenue, or ONRR) published a final rule regarding federal coal valuation.39 The final coal valuation rule (published July 2016) reaffirmed the current rule that the value of coal for royalty purposes is near or at the lease (the source of production) and that the gross proceeds from an arms-length transaction best reflect fair market value. ONRR had proposed no changes to the valuation of arms-length sales. For non-arms-length coal transactions, ONRR had proposed to eliminate current benchmarks because current benchmarks for coal valuation from non-arms-length sales are difficult to apply. Current benchmarks include comparable arms-length sales, prices reported for that coal to a public utility commission, prices for that coal reported to EIA spot market prices, or a netback method. Instead, ONRR would value coal on the gross proceeds received from the first arms-length sale minus allowable deductions.
In a separate Trump Administration coal-related announcement (unrelated to the March 28 executive order), the coal valuation rules implementation (scheduled for January 2017) was postponed by ONRR on February 22, 2017, as ONRR reconsidered several parts of the rule. Then, on April 3, 2017, the DOI announced a proposal to repeal the coal valuation rule and provided an Advanced Notice of Proposed Rulemaking on the preexisting rule and the new rule seeking comment regarding whether the rules should be revised, retained, or repromulgated "in whole or in part." The Department of the Interior repealed the valuation rule on August 7, 2017, effective on September 6, 2017.40
Appendix A. Background Primer on Coal
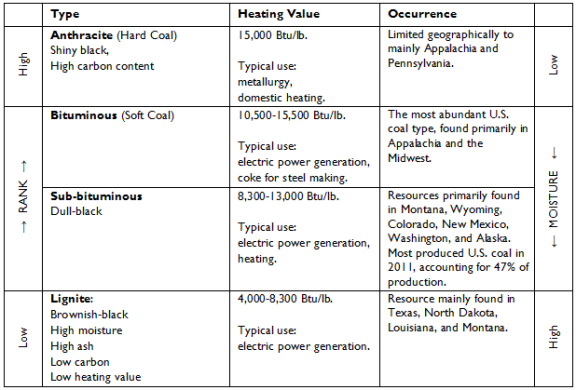
Coal consists of the fossilized remains of ancient plant life that have been transformed through metamorphosis into carbon-rich mineral deposits.41 It occurs as seams in sedimentary rock strata as old as 300 million years, though the most abundant deposits in the United States were deposited during the geologic Carboniferous period between 210 and 250 million years ago. Coal mineral classification considers type, rank, and grade. The plant life that coal originated from determines its type, and the degree of metamorphosis determines its rank, grade, and the amount of inorganic mineral matter present. Qualities such as moisture, carbon, sulfur, and ash content contribute to a coal's heating value as a fuel (measured in Btus).
The content of sulfur is significant because of the sulfur dioxide (SO2) emissions that occur during coal combustion. Under the Clean Air Act, there are federal limits on the amount of SO2, among other pollutants, allowed from coal-fired power plants.42 Western coal (which has low sulfur and low energy content), primarily produced in the PRB of Wyoming,43 is used generally for power generation, while eastern coal has been used domestically for power generation and exported for coking and metallurgical purposes. Moisture adds weight to the coal, increasing shipping costs while decreasing its heating value. Minerals deposited with the plants that formed coal create ash when coal burns. Figure A-1 below illustrates the various coal classifications.
There are two primary mining techniques used in the United States: underground mining and surface mining. About 69% of U.S. coal comes from surface mines, while the remaining 31% comes from deep underground mines.
There are two primary underground mining techniques: room and pillar (including conventional and continuous mining) and longwall. Room and pillar and continuous mining is practiced as follows: In flat-lying coal beds, conventional room and pillar techniques rely on cutting, drilling, blasting, loading, hauling, and roof bolting—a labor-intensive process. Long steel bolts properly spaced and driven into the roof are required. In continuous mining, the cutting, drilling, blasting, and loading are performed by a mechanical excavator known as a continuous miner. The continuous miner cuts and loads the coal. Together, room and pillar and continuous techniques account for 50% (conventional, room and pillar 2%; continuous 48%) of underground mining.44
 |
|
Source: International Energy Agency. Note: The ranking is based on different coals' carbon and heating values. |
The most efficient technique in underground mining is the longwall method, which employs a large machine with a rotating drum that moves back and forth across a wide coal seam. Once coal is removed by a longwall miner or other method, it is then moved out of the mine with conveyor belts or shuttle cars. About 50% of underground coal is produced using the longwall technique.
Surface mining, also called "open-pit" or strip mining, entails blasting rock above the coal with explosives. This overburden (rock and soil) above the coal deposit is then removed with huge electric shovels and draglines to reveal the coal seam. The coal seam in a surface mine is worked in long cuts by uncovering and removing coal, then backfilling and reclaiming land in sequence. In other words, while coal extraction is taking place, as required by federal law, the reclamation work occurs in an adjacent area previously mined. Mountaintop removal mining is a form of strip mining.45 Mountaintop removal mining generally removes a coal seam from one side of a mountain to the other. This is typically done in "steep-terrain" surface mining. Some of the overburden or "excess spoil" from the top of the mountain can be placed in a valley fill. The placement of the excess spoil in valleys adjacent to mining areas remains controversial.46
|
Year |
Total Production |
Total Consumption |
Total Exports |
|||||||
|
|
|
|
|
|||||||
|
|
|
|
|
|||||||
|
|
|
|
|
|||||||
|
|
|
|
|
|||||||
|
|
|
|
|
|||||||
|
|
|
|
|
|||||||
|
|
|
|
|
|||||||
|
|
|
|
|
|||||||
|
|
|
|
|
|||||||
|
|
|
|
|
|||||||
|
|
|
|
|
|||||||
|
|
|
|
|
|||||||
|
|
|
|
|
|||||||
|
|
|
|
|
|||||||
|
|
|
|
|
|||||||
|
|
|
|
|
|||||||
|
|
|
|
|
|||||||
|
|
|
|
|
|||||||
|
|
|
|
|
Source: EIA, Monthly Energy Review, September 2016, p. 97; EIA, Annual Energy Outlook and Short Term Outlook, 2017.
Note: The production and consumption numbers in this table reflect more current data published by the EIA, but for the purposes of showing more disaggregated data for production and consumption, Table 1 and Table 4 in the text use EIA Annual Coal Report data.
Appendix B. Selected Company Profiles
Peabody Energy
Peabody Energy, based in St Louis, MO, and established in 1883, is the world's largest private-sector coal company. Peabody has dominated U.S. coal production over the past two decades. The company grew from 11.5% of industry production in 1994 to 19.6% of production in 2015.47 Peabody has a majority interest in 23 coal mining operations and 6,700 employees in the United States and Australia. Its most productive mines are in the PRB in Wyoming, which include the North Antelope Rochelle, Caballo, and Rawhide mines (which account for 65% of its production in the PRB). Peabody also operates mines in Arizona and New Mexico. In Australia, Peabody operates three mine sites in New South Wales and six mining operations in Queensland. Peabody claims 6.3 billion tons of coal reserves (most of which is thermal grade). Peabody had $4.7 billion in revenue in 2016.48
Peabody has experienced issues with its debt levels since its 2011 expansion into Australia (the acquisition of two mines). Peabody debt-financed its acquisition of Australian coal company Macarthur Coal for $5.1 billion in 2011. In 2015, Peabody had long-term debt of $6.3 billion and operational losses of $1.5 billion. Its stock price fell from $79.35 per share in April 2015 to $2.07 per share as of April 12, 2016.49 Peabody filed for Chapter 11 bankruptcy in April 2016, stating that overproduction of natural gas led to low gas prices, making coal less competitive.
The reorganization plan would eliminate over $5 billion in debt (with $2 billion in debt remaining) and cover future mine cleanups using third-party surety bonds estimated at $1.26 billion.50
Arch Coal Inc.
Arch Coal was formed in 1997, with headquarters in St. Louis, MO. The company came about from a merger of Ashland Coal Inc., and Arch Mineral Corp. Arch Mineral began in 1969. Ashland coal was formed as a subsidiary of Ashland Oil in 1975. In 1998, Arch Coal acquired the coal assets of Atlantic Richfield.51
Arch Coal operated 11 mines in the United States and had $2.6 billion in revenue in 2015. The company made several acquisitions in 2009-2011, spending several billion dollars. Arch Coal debt-financed the acquisition of metallurgical coal producer International Holding Group for $3.4 billion in 2011. About 76% of Arch's coal comes from the PRB, primarily its Black Thunder Mine in Wyoming. Arch's revenue fell from $3.9 billion in 2011 to $1.65 billion in 2016 and had major losses in the interim (2011-2016).52
In 2015, Arch Coal was the leading metallurgical coal producer in the United States and the second leading thermal coal producer, accounting for 14.6% of total coal production. Arch was the third-largest producer in 2005, producing in every U.S. coal basin, with mining complexes in Wyoming, Colorado, Illinois, West Virginia, Kentucky, and Virginia.
Arch Coal filed for Chapter 11 bankruptcy in January 9, 2016, as its shares fell from a high of $260 per share in early January 2011 to less than $1 in 2015. Arch Coal emerged from Chapter 11 bankruptcy on October 5, 2016. The company restructured its debt and has a new entity trading on the New York Stock Exchange (NYSE) (ARCH). ARCH "streamlined" its portfolio of large-scale, modern, low-cost mines with a new debt level of $363 million.53 The company now has third-party bonds to cover its reclamation bonding requirement.
Cloud Peak Energy
Cloud Peak Energy Inc. is headquartered in Wyoming and operates three surface mines in the PRB—two in Wyoming (Antelope and Cordero Rojo mines) and one in Montana (Spring Creek mine). Cloud Peak Energy was incorporated in July 2008. Cloud Peak did not file for bankruptcy protection.54 Cloud Peak Energy was formed after the Rio Tinto Group (a large-scale mining corporation) based in England spun off its 48.3% ownership in 2010.
In 2015, the company accounted for 8.4% of U.S. coal production and had 1,400 employees. The number of employees fell to 1,300 in 2016. Gross revenues fell from $1.5 billion in 2011 to $1.1 billion in 2015. Cloud Peak avoided layoffs because of transfers and attrition. At current coal prices, no new mines are being developed, as it will take time to work through stockpiles and overcapacity. Cloud Peak believes that the outlook for 2017 is better than 2016. The company has reduced its practice of self-bonding for reclamation to $10 million in 2016 from $200 million in 2015. Its surety bonds accounted for $418 million out of $428 million in reclamation bonds. Cloud Peak exports coal to the Asian market.55
Alpha Natural Resources
Alpha Natural Resources (ANR), formed from a private equity group in 2002, acquired the majority of Pittston Coal Co. (which was a subsidiary of the Brink's Co.). ANR made a number of acquisitions from 2003 to 2011, including Massey Energy Co., which was debt-financed for $7.1 billion in 2011. The Massey acquisition gave ANR more than 150 mines and 40 coal preparation plants and a huge metallurgical-coal reserve base. Because of its heavy debt and low demand for coal, ANR filed for Chapter 11 bankruptcy on August 3, 2015.56
ANR emerged from Chapter 11 bankruptcy in July 2016 and reorganized as a smaller company with 18 mine operations and eight coal preparation plants in West Virginia and Kentucky.57 The reorganization discharged over $4 billion in debt, which included selling its PRB mines and multiple holdings in Kentucky. Up until its bankruptcy filings, ANR had been self-bonded.
In 2016, ANR split into two companies—Contura Energy (with the higher-valued assets in the PRB) and ANR (with the lower-valued assets elsewhere). ANR spun off its PRB mine to ensure private bonding for reclamation projects in Wyoming under Contura Energy (with some of the same executives from ANR). Contura bought ANR Mines in Virginia, West Virginia, and Pennsylvania.58
Murray Energy Corporation
Murray Energy was founded in 1988 by Robert Murray, who purchased the Ohio Valley Coal Company's Powhatan Mine. Murray Energy continued to purchase mines in the Illinois Basin, Northern Appalachia, and Utah. Murray invested in Foresight Energy, LP, in 2010, after paying $1.4 billion for a 50% stake. In 2013, Murray took over CONSOL Coal for $3.5 billion (including $1.8 billion in employment obligations, such as pension benefits, workers compensation, and disability payments). Murray currently operates 12 active coal mines (11 in the United States and 1 in Colombia with 6,000 miners). According to Murray, it is the largest privately held coal mining company in the United States. Murray Energy did not file for bankruptcy protection.59
Standard & Poor's downgraded Murray's credit rating to the lowest possible level before default. There was particular financial stress among coal producers in the northern Appalachia region because of the Marcellus shale natural gas play. Murray said that "as the coal industry is destroyed, so will reliable, low cost electricity in America."60
Appendix C. Selected Coal-Related CRS Reports
CRS Report R43011, U.S. and World Coal Production, Federal Taxes, and Incentives, by Marc Humphries and Molly F. Sherlock
CRS Insight IN10460, The Federal Coal Leasing Moratorium, by Marc Humphries
CRS Report R43198, U.S. Coal Exports, coordinated by Marc Humphries
CRS Report R43690, Clean Coal Loan Guarantees and Tax Incentives: Issues in Brief, by Peter Folger and Molly F. Sherlock
CRS Report R44090, Life-Cycle Greenhouse Gas Assessment of Coal and Natural Gas in the Power Sector, by Richard K. Lattanzio
CRS Report R44341, EPA's Clean Power Plan for Existing Power Plants: Frequently Asked Questions, by James E. McCarthy et al.
CRS Report R44150, The Office of Surface Mining's Stream Protection Rule: An Overview, by Claudia Copeland
CRS Report RS21421, Mountaintop Removal Mining: Background on Recent Controversies, by Claudia Copeland
CRS In Focus IF10617, Pension Benefits for United Mine Workers of America Retirees, by John J. Topoleski