Introduction
The skills, knowledge, and credentials obtained through education are widely believed to be connected to positive occupational and economic outcomes. In recent decades, considerable attention has been devoted to improving educational attainment levels of students with disabilities. Several federal policies have aimed to require educators to pay greater attention to the educational progress and attainment of students with disabilities, and many others provide for a variety of supports with the goal of improving levels of attainment. Data collection efforts have also been launched to allow for better tracking of relevant trends.
This report discusses policies aiming to promote educational attainment and examines trends in high school graduation and college enrollment for students with disabilities. It begins with a discussion of the laws related to the education of students with disabilities at the secondary and postsecondary levels. Subsequent sections discuss the existing data on transition-aged students with disabilities, what is currently known about such students, and federal legislation and other factors that may have contributed to changes in students with disabilities' high school graduation rates and postsecondary enrollment over time.
The report offers a brief overview of what is currently known about the U.S. population of students with disabilities in secondary and postsecondary education. It focuses on data gathered in conjunction with federal programs and federally funded studies of nationally representative samples of students with disabilities. It does not attempt to provide an overview or review of existing research on transition-aged students with disabilities or to provide an in-depth examination of the differences between the rights of and services afforded to students with disabilities at the secondary and postsecondary levels. The next sections of the report provide an overview of the education and civil rights laws that aim to support students with disabilities as they work toward completing high school and potentially transition into further educational pursuits.
Education Laws
Individuals with Disabilities Education Act (IDEA)
The IDEA was originally enacted in 1975 (P.L. 94-142)1 and was most recently reauthorized in 2004.2 It is the primary federal act providing for special education and related services for children with disabilities between birth and 21 years old.3 Approximately 13% of the K-12 student population received IDEA services in the 2013-2014 school year (SY).4
The IDEA provides states with grants that support the identification, evaluation, and provision of special education services to children with disabilities. States may receive grants under the condition that, among other requirements, they provide each qualifying student with (1) an individualized education program (IEP) outlining the student's goals, and the accommodations, special education, and related services that the school will provide to the student, and (2) a free appropriate public education (FAPE) in the least restrictive environment (LRE). This means specially designed instruction to meet students' needs, provided to the greatest extent possible with their general education peers and at no cost to their families.
Beginning with its 1990 reauthorization,5 the IDEA has required that the IEPs of students who are 16 years old or older contain a statement of transition goals and services. Transition services are defined as:
A coordinated set of activities for a child with a disability that—
(A) is designed to be within a results-oriented process, that is focused on improving the academic and functional achievement of the child with a disability to facilitate the child's movement from school to post-school activities, including post-secondary education, vocational education, integrated employment (including supported employment), continuing and adult education, adult services, independent living, or community participation;
(B) is based on the individual child's needs, taking into account the child's strengths, preferences, and interests; and
(C) includes instruction, related services, community experiences, the development of employment and other post-school adult living objectives, and, when appropriate, acquisition of daily living skills and functional vocational evaluation. 6
The 1997 and 20047 amendments to the IDEA have supported students with disabilities graduating with regular diplomas and transitioning to postsecondary education by
- increasing local education agencies' (LEAs) accountability for improving the performance of students with IEPs,
- emphasizing students' progress toward meaningful educational and postsecondary goals in the IEP process, and
- requiring states to develop IDEA performance goals and indicators, including dropout and graduation rates, and to report to the Secretary of Education (the Secretary) and the public on the progress of the state and of students with disabilities in the state toward these indicators at least every two years.8
Elementary and Secondary Education Act of 1965 (ESEA)
The ESEA was originally enacted in 1965 (20 U.S.C. 6301 et seq.). It was most recently reauthorized by the Every Student Succeeds Act (ESSA; P.L. 114-95) in 2015. The ESEA is the largest source of federal aid to K-12 education, supporting educational and related services for low-achieving and other students attending elementary and secondary schools with high concentrations of students from low-income families. The largest grant program in the ESEA is Title I-A. There are a number of educational accountability requirements that states, LEAs, and schools must meet to receive Title I-A funds. For example, amendments to the ESEA enacted under the No Child Left Behind Act of 2001(NCLB; P.L. 107-110) included several educational accountability provisions that aimed to promote the educational progress of all students in schools served. These provisions have subsequently been amended through the ESSA.
Over half of public elementary and secondary schools receive Title I-A funds. While students with disabilities benefit from this funding, they are not specifically targeted by it. However, many of the ESEA's educational accountability provisions do require that schools pay particular attention to students with disabilities and likely have an effect on them. For example, when the ESEA was amended through the NCLB in 2001, provisions were adopted requiring states to develop and implement a state accountability system to ensure that schools and LEAs made progress with respect to student achievement.9 Under the NCLB provisions, student progress was not only systematically measured and monitored for the broad population of K-12 students served under the ESEA but also for specific subgroups of students, of which "students with disabilities" was one.
Under NCLB provisions, student proficiency in relation to academic performance standards was regularly tracked in selected subject areas, as were high school graduation rates. The NCLB contained high-stakes accountability provisions featuring varied consequences for schools in which a sufficient percentage of students or subgroups of students, such as students with disabilities, failed to make sufficient academic progress in relation to the academic achievement and high school graduation standards. The accountability provisions of the NCLB, and those in place after the ESEA was amended through the ESSA, emphasize holding all students and all subgroups of students (including students with disabilities) to the same standards and levels of academic achievement, and closing gaps between subgroups of students. To comply with these accountability provisions, schools and school districts are required to pay specific attention to the academic progress and graduation rates of students with disabilities.
Higher Education Act of 1965 (HEA)
The HEA was originally enacted in 1965 (P.L. 89-329). It was most recently reauthorized in 2008 by the Higher Education Opportunity Act (HEOA; P.L. 110-315) in 2008, which authorized appropriations for most HEA programs through FY2014. Funding is still being provided for HEA programs through appropriations acts. The HEA authorizes student financial aid programs that help students and their families meet the costs of attending postsecondary institutions, a series of targeted grant programs that assist students transitioning into postsecondary education, and grants that support program and institutional development at some colleges and universities. While students with disabilities benefit from many of the HEA's student financial aid programs, the programs that specifically target support and assistance to students with disabilities are the TRIO Student Support Services (SSS) program10 and Comprehensive Transition and Postsecondary (CTP) programs for students with intellectual disabilities. 11
The TRIO SSS program served over 200,000 students through grants to over 1,000 projects in SY2015-2016.12 The program, originally enacted in 1992 through amendments to the HEA,13 provides support services to primarily low-income first generation college students with the aim of improving their retention, graduation rates, financial and economic literacy, and transfers from two-year to four-year schools.14 TRIO SSS programs are also intended to foster an institutional climate supportive of potentially disconnected students. These include students with disabilities, students who are limited English proficient, students from groups that are traditionally underrepresented in postsecondary education, students who are homeless children and youths, and students who are in foster care or aging out of the foster care system. Under the TRIO SSS program, the U.S. Department of Education (ED) makes competitive grants to Institutions of Higher Education (IHEs) and combinations of IHEs. Grantees must provide statutorily defined services to an approved number of participants. At least two-thirds of participants must be either students with disabilities15 or low-income, first-generation college students. The remaining one-third of participants must be low-income students, students with disabilities, or first-generation college students. Also, at least one-third of the participating students with disabilities must be low-income.
The CTP programs for students with intellectual disabilities served approximately 1,000 students through grants to 66 institutions in SY2015-2016.16 The programs, enacted through the HEOA, provide transition support for students with intellectual disabilities.17 Under provisions in the HEA, CTP programs for students with intellectual disabilities are not required to lead to a recognized credential (e.g., bachelor's or associate's degree, certificate) or adhere to the same durational requirements that regular postsecondary programs must meet (e.g., a certain number of credit-bearing clock hours). Instead, CTP programs require students with intellectual disabilities to receive curriculum advising, participate at least part-time in courses or training with students who do not have intellectual disabilities, and prepare for gainful employment.
Civil Rights Laws
In addition to the education laws that fund programs for students with disabilities, there are two civil rights laws that protect them in secondary and postsecondary education from discrimination based on their disabilities: Section 504 of the Rehabilitation Act (P.L. 93-112) and the Americans with Disabilities Act of 1990 (ADA; 42 U.S.C. §12101 et seq.).
Section 504 of the Rehabilitation Act18
Section 504 prohibits discrimination on the basis of a disability by protecting the rights of people with disabilities to access programs receiving federal funding. Section 504 also provides for accommodations such as extended time on tests for students with learning disabilities, accessible classrooms for students with orthopedic impairments, and large print or braille materials for students who are visually impaired. These accommodations are available at all levels of schooling—preschool to postsecondary—in schools that receive any federal funding.
All children with disabilities attending K-12 public schools who are served under Section 504 are entitled to a FAPE and an individualized accommodations plan, often called a "504 plan." At the postsecondary level, Section 504 requires IHEs to provide students with disabilities with appropriate academic adjustments and equitable access to educational programs and facilities.
ED's Office for Civil Rights (OCR) reported that in SY2011-2012, more than 6 million K-12 students were served under the IDEA, and slightly less than three-quarters of a million K-12 students were served under Section 504.19 This means approximately 89% of children with disabilities served by K-12 public schools are served under the IDEA and approximately 11% of students with disabilities served by K-12 public schools are served solely by Section 504.20 At the postsecondary level, however, the IDEA no longer applies to students with disabilities; instead, all students with disabilities attending IHEs that receive federal funding are protected by Section 504. Most IHEs have a 504 coordinator or a disabled student services (DSS) office on campus that coordinates accommodations such as extended time on tests, early course registration, and physical accommodations and access to campus facilities for students with disabilities.
Americans with Disabilities Act of 1990 (ADA)
The Americans with Disabilities Act of 1990, most recently amended by the ADA Amendments Act of 2008 (together, ADA),21 includes a conforming amendment to the Rehabilitation Act that broadens the meaning of the term "disability" in both the ADA and Section 504 to protect people who have or are regarded as having a physical or mental disability that impacts one or more major life activities. The ADA provides broad nondiscrimination protection in employment, public services, public accommodations and services operated by private entities, transportation, and telecommunications for individuals with disabilities. The ADA states that its purpose is "to provide a clear and comprehensive national mandate for the elimination of discrimination against individuals with disabilities." In 2008, in response to Supreme Court and lower court decisions that narrowly interpreted the term "disability," Congress passed the ADA Amendments Act to, among other things, "carry out the ADA's objectives of providing 'a clear and comprehensive national mandate for the elimination of discrimination' and 'clear, strong, consistent, enforceable standards addressing discrimination' by reinstating a broad scope of protection to be available under the ADA."
Both Section 504 and the ADA require that educational institutions at all levels provide equal access for people with disabilities. The ADA extends the requirements of Section 504 from only institutions receiving federal financial assistance to all institutions, with some exceptions for institutions controlled by religious organizations. The ADA impacts schools from pre-K to postsecondary because it extends the rights of people with disabilities to access facilities and receive accommodations, allowing them to participate in the activities of both public and private institutions.
High School Completion and Postsecondary Transition for Students with Disabilities
Federal data on students with disabilities transitioning from secondary to postsecondary education include both data reported from public high schools to ED, and federally funded studies and datasets examining students with disabilities transitioning from secondary to postsecondary education and enrolled in postsecondary education. This section will examine what is currently known about transition-aged students with disabilities from federal data, and the limitations of that data.
High School Graduation Rates
IDEA Student High School Degree Attainment
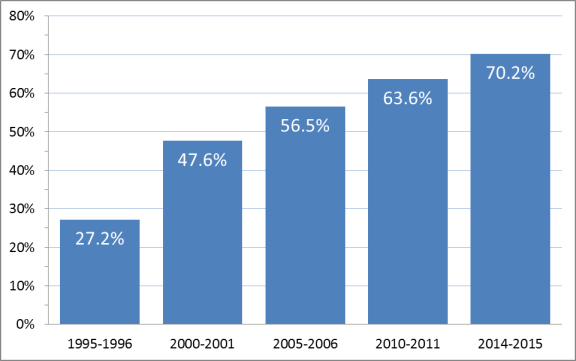
As displayed in Figure 1, the percentage of students with disabilities graduating with a regular high school diploma has increased substantially since SY1995-1996, when ED revised and expanded the categories of special education exiting data it tracked to those in use today. The rise in high school diploma attainment among high school-aged students receiving special education and related services, from less than 30% in the mid-1990s to over 70% two decades later, was mirrored by a decline in the dropout rate among secondary school-aged students served under the IDEA,22 from a high of nearly 46% in the mid-1990s to 18% in SY2014-2015.
Currently, states report annually to ED the number of students ages 14 to 21 served under the IDEA who graduated from high school with a regular diploma during the past school year.23 To be included in the reported data, students with disabilities must graduate with a regular diploma, meaning they must meet the same academic standards required for students without disabilities. Students who receive certificates of attendance/completion, general educational development credentials (GED), or alternative degrees that are not fully aligned with the state's academic standards are not included in the data on students with disabilities graduating with a regular high school diploma.
Averaged Freshman and Cohort Graduation Rates (AFGR and ACGR)
ED data on the averaged freshman graduation rate (AFGR), a measure of the percentage of all public school students who attain a regular high school diploma within four years of starting 9th grade for the first time, has been collected as part of the data reporting requirements of the ESEA for decades. From SY1995-1996 through SY2014-2015, the AFGR increased from 71% to 83%.
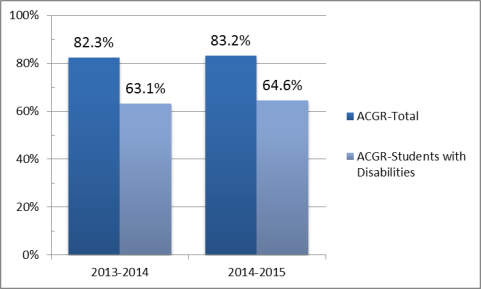
Recently, in addition to AFGR data for the general population of high school students, ED has begun releasing a more precise estimate called a four-year adjusted cohort graduation rate (ACGR). Because ACGRs use more precise student-level data, they can track the graduation rates of a variety of cohorts, including students with disabilities. The ACGR data on students with disabilities is comparable to the ACGR data used to examine the outcomes of all students in a particular cohort year (beginning in 9th grade or the first year of high school).24 A four-year ACGR for students with disabilities has only been available for comparison to the general ACGR since SY2013-2014. In the two available years of comparison ACGR data shown in Figure 2, the ACGR for students with disabilities increased more than the ACGR for the general student population (1.5% vs. 0.9%) from SY2013-2014 through SY2014-2015, but it remained nearly 20 percentage points lower overall.
The exiting data on students with disabilities who graduate with a regular diploma shown in Figure 1 provides a more complete picture of the population of secondary students served by the IDEA, because it reports on all students with IEPs that graduate with a regular diploma whether they do so in four, five, six, or seven years. However, the ACGR data on students with disabilities shown in Figure 2 allows the graduation rates of students with and without disabilities to be compared. Further data on the two ACGR groups would be needed to determine any trends in their relative graduation rates.
Longitudinal Data on Post-High School Enrollment in Further Education
When the IDEA's original predecessor legislation was first reauthorized in 1983,25 Congress requested that ED conduct a national longitudinal study of youth with disabilities from ages 13 to 21 as they transitioned from high school to adult life to determine how they fared in terms of education, employment, and independent living. The result was the first National Longitudinal Transition Study (NLTS), a five-year study beginning in SY1985-1986 that tracked a nationally representative sample of more than 8,000 students representing each of the federal disabilities categories.
The NLTS showed that secondary school-aged students with disabilities were more likely to be male, poor, and minorities than were their general education peers.26 It also showed that transition-aged students with disabilities often dropped out of or exited high school without attaining a regular diploma; had inconsistent access to transition planning; and often received insubstantial transition planning, which rarely included postsecondary education among students' transition goals,27 when planning was made available.28
In contrast to the original NLTS's finding that fewer than one in four 12th graders reported postsecondary education as a goal,29 the National Longitudinal Transition Study-2 (NLTS2), which began 15 years after the first NLTS, found that more than four out of five secondary school-aged students with disabilities who had transition plans named postsecondary education as a primary post-high school goal.30 In addition, the NLTS2 found that a majority of secondary school-aged students with disabilities (60%) continued on to postsecondary education within eight years of leaving high school, and most of them began postsecondary studies within a year of leaving high school. The NLTS2 also found the following for postsecondary students with disabilities:
- They enrolled most frequently in two-year programs or community colleges (44%). They also enrolled in vocational, business, or technical schools (32%), and four-year colleges or universities (19%).
- They usually enrolled in postsecondary education programs on a consistent (77%), full-time (71%) basis, where they were working toward a diploma or certificate (90%).
- They were likely to stop self-identifying as disabled once in postsecondary education. A majority (63%) of students who had been identified as having disabilities by their secondary schools no longer considered themselves to have a disability by the time they transitioned to postsecondary school. Only 28% of postsecondary students continued to identify as students with disabilities and disclosed their disabilities to their IHEs, as required to receive accommodations or supports at the postsecondary level, and fewer than one in five students (19%) received accommodations for their disability from an IHE.31
- When postsecondary students did request assistance because of their disabilities, they received a range of accommodations and supports from their schools, the most common of which was additional time to complete tests (79%).32
The NLTS2 findings generalize to students with disabilities nationally, but they are only representative of students in the early 2000s. The NLTS2 allows insight into the outcomes of students with disabilities transitioning from high school to postsecondary life that could not be arrived at through cross-sectional data such as high school graduation and college enrollment rates. However, because the study's sample is nationally representative of secondary students circa 2000, the NLTS2 results cannot be assumed to reflect the postsecondary outcomes of the current national population of young adults with disabilities.
A new NLTS study began in 2012. Once it has collected additional waves of data, the NLTS 2012 will begin to provide some insight into the characteristics, experiences, and outcomes of a more recent nationally representative sample of students with disabilities transitioning from high school to postsecondary education and life. Until then, examining the NLTS2 findings along with more recent data on high school graduation and college enrollment rates helps to form a more accurate picture of students with disabilities currently transitioning between secondary and postsecondary education.
Postsecondary Students Self-Identifying as Having Disabilities
The National Postsecondary Student Aid Study (NPSAS) is a federal study focused primarily on student aid at IHEs. However, the NPSAS also includes a survey designed to be nationally representative of students attending Title IV postsecondary institutions, which among other subjects asks students whether they have a disability. In the most recent administration of the NPSAS (SY2011-2012), 11% of undergraduates and 5% of post-baccalaureate students reported having a disability. Male and female undergraduates reported having disabilities at statistically similar rates. Other student characteristics such as veteran status, age, and dependency status showed significant differences between undergraduates who reported having a disability and those who did not. The largest of these differences was between the percentage of veterans (21%) and nonveterans (11%) reporting a disability. The percentage reporting a disability was also higher among older students: 16% among undergraduates age 30 and over compared to 11% among 24 to 29 year olds and 9% among 15 to 23 year olds.
The results of NPSAS data collection cannot be compared across years because of changes in the relevant survey questions posed to students to determine if they had a disability and in the number and types of disabilities students were asked about across different administrations of the NPSAS. In addition, the use of students self-identifying as disabled on a survey is fundamentally different and more likely to result in lower reported rates of disability than data tracked by schools or pulled from student records. For example, the increase in postsecondary students self-identifying as disabled as they grow older may reflect more about the reluctance of students who have recently exited high school special education programs to adopt the disability label in their new postsecondary institution than it does about actual increases in the number of disabilities among older undergraduate students.
Factors Contributing to High School Graduation and College Enrollment Trends among Transition-Aged Students with Disabilities
High school graduation and college enrollment have increased considerably for all students in recent decades. The increased rates of students with disabilities graduating from high school with a regular diploma and continuing on to postsecondary education may be part of the trends seen in the general population of transition-aged students.33 The appeal of higher earnings or self-sufficiency may be a factor in the increasing educational attainment of students with and without disabilities. Relatedly, the increase in unemployment among 16 to 24 year olds in the years immediately after the 2007-2009 recession34 may have factored both in declining high school dropout rates and in increasing postsecondary enrollment rates during those years. In addition, changes in the postsecondary landscape, such as increased access to non-selective two-year and less than two-year programs, may have encouraged more students to pursue postsecondary education.35
In addition to the potential factors impacting the overall population of transition-aged students, several congressional actions may have contributed specifically to the increasing percentages of students with disabilities graduating from high school with a regular diploma (Figure 1) and enrolling in postsecondary education.
- P.L. 101-476 (IDEA; 1990) introduced requirements that all students' IEPs contain a statement of needed transition services by the time those students turn 16 years old, and that the students be invited to attend and participate in all IEP meetings where their transition goals are discussed. P.L. 101-476 marked the first time that IEP teams were required to set goals for what students would do in their postsecondary lives and determine the services needed to help them attain those goals.
- P.L. 101-476 also included two new disability categories: autism and traumatic brain injury (TBI). Both categories have grown significantly in terms of raw numbers and the percentage of students with disabilities served, with the growth in the autism category being particularly pronounced. Autism is now the fourth largest category of children served under the IDEA, accounting for nearly 10% of all children with IEPs.36 According to ED data, more than two-thirds of students with autism (68%) and three-quarters of students with TBI (75%) graduated from high school with a regular diploma in SY2014-2015.37
- P.L. 105-17 (IDEA; 1997) required children with IEPs to participate in statewide assessments and the general education curriculum. The bill required all students' IEPs to relate their IEP programming to their achievement in the general education curriculum. In addition, under this act states were required to establish performance goals and indicators for students with IEPs and include students with IEPs in statewide assessments and alternative assessments.
- P.L. 107-110 (NCLB; 2001) required states to implement accountability systems tracking the academic progress of different subgroups of students, including students with disabilities, toward meeting state developed educational standards. The NCLB contained high-stakes accountability provisions, which emphasized holding all students, including students with disabilities, to the same standards; closing gaps between different groups of students; and expecting all students to reach proficiency in reading and mathematics. The NCLB's accountability provisions required that specific attention be paid to academic progress and graduation rates of students with disabilities.
- P.L. 108-446 (IDEA; 2004) increased accountability requirements by revising state performance goals and requiring that students with disabilities be included in all state and district-wide assessments, including assessments required under the ESEA.
- In addition to the TRIO SSS program38 and CTP programs for students with intellectual disabilities, established in earlier amendments to the HEA,39 the HEOA established a new competitive CTP grant program, which operates on a limited scale, called Model Transition Programs for Students with Intellectual Disabilities into Higher Education (TPSID). TPSID grants fund IHEs in partnering with one or more LEAs and create model transition programs from secondary to postsecondary education for students with intellectual disabilities.