Research and development (R&D) in the United States is funded and performed by a number of sectors—including the federal government, state governments, businesses, academia, and nonprofit organizations—for a variety of purposes. This fact sheet begins by providing a profile of the U.S. R&D enterprise, including historical trends and current funding by sector and by whether the R&D is basic research, applied research, or development. The final section of this fact sheet includes data on R&D performance by sector.
Historical Trends in U.S. R&D Funding
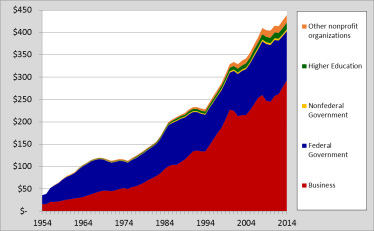
The United States became a global leader in R&D in the 20th century, funding as much as 70% of annual global R&D in the period following World War II.1 Figure 1 shows the growth in total U.S. R&D expenditures from 1954 to 2014 in constant dollars.2 In current dollars, U.S. R&D in 2014 was more than 85 times higher than it was in 1954; it was 12 times higher in constant dollars.3 By sector, business-funded R&D grew the most during this period. However, faster growth in aggregate R&D spending of other nations has reduced the U.S. share of global R&D to approximately 29% in 2014.4
|
Figure 1. U.S. R&D Expenditures by Source of Funding, 1954-2014 Constant dollars, in billions |
 |
|
Source: National Science Foundation, National Patterns of R&D Resources: 2014–15 Data Update, March 14, 2017, https://www.nsf.gov/statistics/2017/nsf17311/#chp2. |
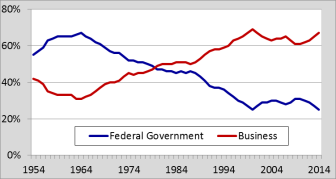
Two sectors—business and the federal government—have accounted for more than 90% of U.S. R&D funding since 1953. Federal R&D expenditures as a share of total U.S. R&D expenditures peaked in 1964 at 66.8%, the same year that business R&D expenditures reached a nadir of 30.8%. Between 1964 and 2000, the federal government's share fell and business's share rose. In 2000, business accounted for 69.2% of U.S. R&D expenditures and the federal government 25.2%. This shift in the composition of R&D funding resulted not from a reduction in federal government R&D expenditures, but rather from faster growth in business R&D expenditures. Since 1995, business has accounted for 60%-70% of total U.S. R&D each year while the federal government has accounted for 25%-34%. (See Figure 2.)
|
Figure 2. Federal and Business Shares of U.S. R&D Expenditures, 1954-2014 |
 |
|
Source: National Science Foundation, National Patterns of R&D Resources: 2014–15 Data Update, March 14, 2017. |
Trends in Federally Funded R&D
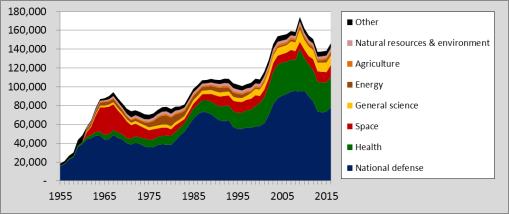
In current dollars, federal funding for R&D grew from $3.1 billion in 1954 to $119.8 billion in 2014, a compound annual growth rate (CAGR) of 6.3%. In constant dollars, federal R&D grew by a 2.9% CAGR during this period. However between 2011 and 2014, federal R&D funding, as measured in current dollars, fell for three consecutive years for the first time since such data has been collected; the total decline in federal funding for these years was $9.1 billion (7.1%). In constant dollars, federal R&D declined for five consecutive years from 2009 to 2014, a total drop of 13.5%; a deeper drop occurred from 1987 to 1994, when federal R&D fell by 15.8%.5 Figure 3 shows federal R&D funding by budget function in constant dollars from 1955 to 2015.
Trends in U.S. Business-Funded R&D
Business funding of R&D has grown nearly every year (in current dollars) since 1954. In current dollars, business-funded R&D grew from $2.4 billion in 1954 to $318.6 billion in 2014, a compound annual growth rate (CAGR) of 8.5%. In constant dollars, business-funded R&D grew by a 5.0% CAGR during this period. In recent years, business-funded R&D has grown at a slower pace. Between 2000 and 2014, business R&D grew by a 3.9% CAGR in current dollars, and by a 1.8% CAGR in constant dollars.6
Current Composition of U.S. R&D Funding
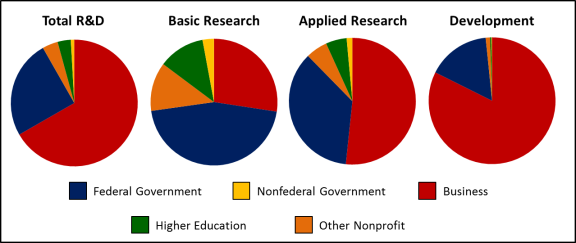
R&D funding can be categorized by the character of the work that it supports: basic research, applied research, and development. (See text box for definitions.) Total U.S. R&D expenditures in 2014 (the most recent year for which data are available) were $477.7 billion. Of this amount, $84.0 billion (17.6%) was for basic research, $93.6 billion (19.6%) was for applied research, and $300.1 billion (62.8%) was for development.7
Table 1 shows total U.S. R&D expenditures in 2014 by funding sector and character of work. Figure 4 shows this information graphically.
|
Sector |
Basic Research |
Applied Research |
Development |
Total |
||||
|
Dollars |
Percent |
Dollars |
Percent |
Dollars |
Percent |
Dollars |
Percent |
|
|
Federal Government |
$38.1 |
45.4 |
$33.7 |
36.0 |
$48.0 |
16.0 |
$119.8 |
25.1 |
|
Nonfederal Government |
2.4 |
2.9 |
1.4 |
1.5 |
0.4 |
0.1 |
4.2 |
0.9 |
|
Business |
23.0 |
27.4 |
48.4 |
51.7 |
247.2 |
82.4 |
318.6 |
66.7 |
|
Higher Education |
10.0 |
11.9 |
5.0 |
5.3 |
1.1 |
0.4 |
16.0 |
3.4 |
|
Other Nonprofit Organizations |
10.5 |
12.5 |
5.2 |
5.5 |
3.3 |
1.1 |
19.0 |
4.0 |
|
Total |
$84.0 |
100.0 |
$93.6 |
100.0 |
$300.1 |
100.00 |
$477.7 |
100.0 |
Source: National Science Foundation, National Patterns of R&D Resources: 2014–15 Data Update, March 14, 2017.
Note: Rows and columns may not add to totals due to rounding.
 |
|
Source: National Science Foundation, National Patterns of R&D Resources: 2014–15 Data Update, March 14, 2017. |
Current Composition of U.S. R&D Performance
R&D is often performed by sectors other than the one funding the R&D. For example, the federal government performs some of the research it funds, but also funds research performed by business, universities and colleges, and other organizations. Table 2 provides data on performance of U.S. R&D by sector and character of the work (basic research, applied research, and development).
|
Sector |
Basic |
Applied Research |
Development |
Total |
||||
|
Dollars |
Percent |
Dollars |
Percent |
Dollars |
Percent |
Dollars |
Percent |
|
|
Federal Government |
$10.0 |
12.0 |
$15.5 |
16.6 |
$26.7 |
8.9 |
$52.3 |
10.9 |
|
Nonfederal Government |
n/a |
n/a |
n/a |
n/a |
n/a |
n/a |
0.5 |
0.1 |
|
Business |
21.9 |
26.1 |
53.4 |
57.0 |
265.4 |
88.4 |
340.7 |
71.3 |
|
Higher Education |
41.3 |
49.2 |
18.5 |
19.8 |
4.8 |
1.6 |
64.7 |
13.5 |
|
Other Nonprofit Organizations |
10.6 |
12.6 |
5.9 |
6.3 |
3.0 |
1.0 |
19.5 |
4.1 |
|
Total |
$84.0 |
100.0 |
$93.6 |
100.0 |
$300.1 |
100.0 |
$477.7 |
100.0 |
Source: National Science Foundation, National Patterns of R&D Resources: 2014–15 Data Update, March 14, 2017.
Note: Rows and columns may not add to totals due to rounding.