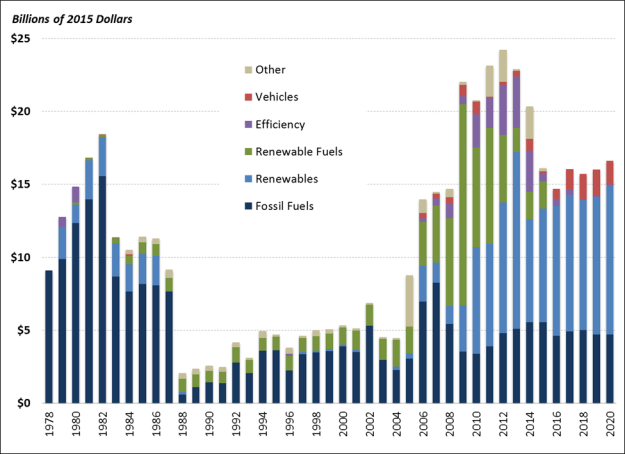
Over time, the proportion of energy-specific tax incentives benefitting different energy resources has shifted. Figure 1 illustrates the value of energy-related tax incentives since 1978. Energy tax provisions are categorized as primarily benefitting fossil fuels, renewables, renewable fuels, efficiency, vehicles, or some other energy purpose. Earlier versions of Figure 1 have appeared in past Congressional Research Service reports (R41953 and R41227). Similar figures have also appeared in Congressional Budget Office (CBO) publications in 2012, 2015, and 2017. See these resources for additional information on the data underlying the figures in this Insight.
In recent years, the budget cost associated with tax incentives for renewables has increased. In 2016, the largest energy tax expenditures were the renewable energy production tax credit (PTC), estimated at $3.4 billion, and the energy credit, or the renewable energy investment tax credit (ITC), estimated at $2.6 billion. Most PTCs are associated with electricity production using wind, while most ITCs are associated with investment in solar. The projected estimates in Figure 1 reflect the PTC and ITC extensions enacted as part of the Consolidated Appropriations Act, 2016 (P.L. 114-113). Specifically, the PTC for wind was extended through 2019, with a phaseout starting in 2017. The 30% ITC for solar is available through 2019, after which the credit rate begins to phase down. Solar facilities placed under construction after 2021 may qualify for a 10% ITC, assuming no changes to current law. The 10% ITC for solar is one of the few permanent energy tax incentives supporting renewables.
Until the mid-2000s, the majority of energy-specific tax incentives supported fossil fuels. From the late 1980s through 2011, most of the tax-related federal financial support for renewable energy was for renewable fuels (mainly ethanol). The primary tax incentive for ethanol expired at the end of 2011. However, tax incentives for biodiesel and renewable diesel remained available through 2016. Further extension of the tax incentives for biodiesel and renewable diesel (beyond 2016) would result in positive values for renewable fuels in those years (current estimates of incentives for renewable fuels are zero after 2016).
|
Figure 1. Projected Annual Cost of Energy-Related Tax Incentives
FY1978-FY2020
|
 |
|
Source: CRS using data from the Joint Committee on Taxation (JCT) and Office of Management and Budget (OMB).
Notes: Energy tax incentives include the value of (1) energy tax expenditures, as estimated by the JCT; (2) energy tax provisions that offset excise tax liability, such as tax incentives for ethanol and biofuels (through 2015); and (3) outlays that are related to tax provisions, notably outlays associated with Section 1603 grants in lieu of tax credits. Annual estimates are the sum of individual tax expenditures and other tax provisions and do not reflect possible interaction effects. Tax expenditure estimates are based on current law, and thus do not reflect foregone revenues associated with retroactive extensions of expired provisions.
|
Many energy tax provisions are temporary. Of the 34 temporary tax provisions that expired at the end of 2016, 16 are energy-related. However, expiration of certain energy tax expenditures does not necessarily mean the cost associated with the provision immediately disappears. One of the primary tax incentives supporting renewable energy, the PTC, is available for the first 10 years of qualified production. Thus, there will be positive tax expenditures associated with this provision even after the provision expires and is not available to encourage new investment. Other energy tax provisions have limitations, even if they do not have an expiration date. For example, the tax credit for qualified plug-in electric vehicles will begin to phase out once a manufacturer has sold 200,000 qualifying vehicles for use in the United States.
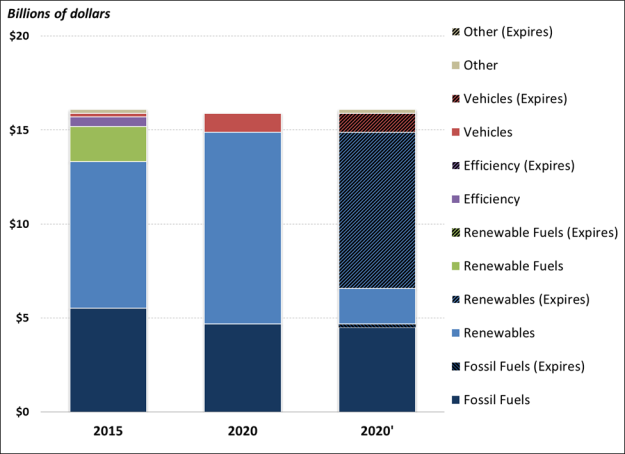
Figure 2 illustrates the relative importance of permanent versus temporary tax incentives for different types of energy resources. The first column shows the projected cost of energy tax provisions in 2015 (the same as the column for 2015 in Figure 1). The second column shows the projected cost of current law energy tax provisions in 2020 (again, the same as the column for 2020 in Figure 1). The third column in Figure 2 (2020') illustrates what proportion of the projected cost of energy tax incentives in 2020 is associated with provisions that have an expiration date or are otherwise limited.
Most of the projected cost of energy tax incentives in 2020 is associated with incentives for renewables (under current law, renewable fuels incentives have expired, and thus are not scheduled to be available in 2020). However, much of this cost in 2020 is associated with the PTC, which will have expired but can still be claimed by taxpayers in the 10-year period of qualifying production. With most of the budget cost arising from expired tax provisions, there will be limited incentives for new investment in renewables.
In contrast to tax incentives for renewables, most of the tax incentives that support fossil fuels are permanent features of the tax code. Thus, the cost associated with fossil-fuels-related tax incentives, as illustrated in both Figure 1 and Figure 2, is projected to be stable over the next few years. In 2015, the largest tax expenditures for fossil fuels are the expensing of exploration and development costs (including intangible drilling costs [IDCs], estimated at $1.3 billion, and the percentage depletion allowance, estimated at $1.6 billion). In 2020, these incentives are estimated to cost $1.2 billion and $1.1 billion, respectively.
|
Figure 2. Projected Cost of Energy Tax Provisions: FY2015 and FY2020
Changes Associated with Limited or Expiring Provisions
|
 |
|
Source: CRS using JCT and OMB data.
Notes: See Figure 1 notes.
|