Introduction
Established in 2010, "Feed the Future" (FTF) is a major Obama Administration foreign assistance initiative designed to alleviate global poverty and improve health and food security. It supports both implementation of President Obama's 2010 Policy Directive on Global Development1 and U.S. food security pledges made at the G8 Summit in 2009. FTF employs a whole-of-government approach to achieve these ends. While FTF adds to the suite of existing U.S. international development programs and outlays, it has pioneered new approaches for achieving cross-sectoral international development goals and for aligning existing U.S. food and agriculture programs. The Administration views FTF as promoting a range of international agricultural development best practices and strategies. FTF acts as a coordination mechanism for all U.S. international agricultural and food security development programs.
FTF is a new federal investment paradigm targeting sustainable reductions in international hunger, malnutrition, and food insecurity. FTF seeks to foster transparency and accountability and track and assess program implementation progress through the use of publicly released metrics to justify U.S. investments in each recipient country and each development program, indicators to monitor and evaluate progress, and annual reports to Congress. The U.S. Agency for International Development (USAID) selects the main FTF recipient countries—known as "focus countries" under the initiative—based on country ownership potential, need, and opportunity for reducing food insecurity. Under USAID's selection process, FTF aid targets some of the world's poorest countries, but also channels investments to countries that show the greatest potential to achieve progress. FTF also emphasizes sustainable and collaborative approaches to development. Key FTF operating principles include
- recipient-country ownership of and commitment of resources to country-specific investment plans;
- reliance on measurable indicators to assess initial needs; monitor progress toward targets; and evaluate whether corrections, adjustments, or wholesale changes are needed mid-course;
- use of a whole-of-government implementation strategy that cuts across existing U.S. international development programs to facilitate coordination and potentially prevent duplication and gaps; and
- an emphasis on coordinating and partnering with recipient-country organizations and private sector entities, as well as with other donors and international organizations.
This report discusses these and other features of FTF. Key issues addressed include the origin, intent, and government-wide inter-agency development approach of FTF; FTF program implementation, including monitoring and evaluation issues; and funding. This report also raises possible oversight issues for Congress relating to FTF implementation. Possible matters of interest to Members include the limited availability of USAID reporting on program impact results by country, and long-term institutional prospects for FTF, given its status as an ad hoc Obama Administration presidential initiative. Congress is presently evaluating the overall merits of FTF and whether to permanently authorize the initiative.
Background
The Administration established FTF to support implementation of President Obama's 2009 pledge to reduce global hunger—a multi-year U.S. food security commitment made at the G8 Summit in 2009—and his 2010 Policy Directive on Global Development. FTF was also motivated by the recognition that global investment in the agricultural sectors of many of the world's poorer nations had declined in recent decades. Investment in developing-country agriculture by the international donor community had fallen off sharply over the previous two decades—the share of total official development assistance devoted to agriculture had fallen to 6% by 2008, down from 17% in the late 1980s.2 Matters were made worse by the global financial crisis that began in 2008 and the subsequent global recession, which left an international wake of rising unemployment and ever-tightening budgetary resources. The Administration established FTF, in part, as a vehicle for delivering on U.S. commitments to the international response to these challenges.
The Administration also created FTF to act as a key framework for enhancing U.S. agricultural development assistance focused on food security and poverty alleviation goals, key foreign policy priorities of the Obama Administration. In his first inaugural address, President Obama signaled that alleviating global hunger would be a top priority of his Administration.3 Later, in 2010, he issued a Presidential Policy Directive (PPD) on Global Development, which defined socioeconomic development as "vital to U.S. national security" and as "a strategic, economic, and moral imperative for the United States."4 Three interrelated presidential initiatives, the Global Climate Change Initiative, the Global Health Initiative, and FTF, are the core policy and program tools for achieving the goals of the PPD, which lays out the key precepts that define the operation of FTF.
Response to Global Crisis
The global food price crisis of 2007-2008 pushed food prices for many basic staples out of reach for many of the world's poorest, most vulnerable people.5 The result was an increase in the proportion and absolute number of hungry people worldwide to historic levels. In 2009, the United Nation's Food and Agriculture Organization (FAO) estimated that the total number of undernourished people in the world had reached more than 1 billion.6 This estimate, later revised downward to 870 million, triggered new interest in global food security issues.
In July 2009, at the G87 Summit in L'Aquila, Italy, President Obama pledged to provide at least $3.5 billion over three years (FY2010 to FY2012) to global food security programs as part of the Global Partnership for Agriculture and Food Security (hereinafter the Global Partnership), a component of the L'Aquila Food Security Initiative,8 which was intended to promote global agricultural development, improved nutrition, and food security (Table 1).9 The G8 summit leaders and other countries and institutions in attendance announced the launch of the Global Partnership and established a goal of mobilizing at least $20 billion over three years to finance the initiative.10
In September 2009, in Pittsburgh, the G2011 Summit endorsed the L'Aquila Food Security Initiative and, in addition, called for the establishment of a World Bank food security trust fund to finance medium- and long-term investments in agricultural productivity and market access in low-income countries.12 The fund, called the Global Agriculture and Food Security Program (GAFSP), was established in 2010. Also, countries that did not attend the earlier G8 Summit—Belgium, Finland, Norway, and Switzerland—pledged to support the Global Partnership and to commit an additional $2 billion to the effort, making a new total of $22 billion pledged by the international donor community.13 By the end of 2014, U.S. commitments of $4.3 billion were in excess of the initial L'Aquila pledge of $3.5 billion (Table 1).
Table 1. U.S. Budget Commitments to the L'Aquila Food Security Initiative
Pledges as of December 31, 2014 ($ millions)
|
U.S. Government Agency |
Commitments |
Disbursements |
||||
|
USAID |
|
|
||||
|
GAFSPa (U.S. Dept. of Treasury) |
|
|
||||
|
Millennium Challenge Corporation (MCC)b |
|
|
||||
|
Totals |
|
|
Source: U.S. Agency for International Development (USAID)
Notes: The global pledge of $22 billion for food security is also referred to as the Global Partnership. The data in this table are not adjusted for inflation.
a. See text box, "The Global Agriculture and Food Security Program (GAFSP)," on page 8 and Table 3 below for details on GAFSP and U.S. contributions. Note that Table 3 GAFSP numbers differ from those in this table because they reflect budget requests and enacted appropriations rather than international commitments and actual disbursements.
b. For more information, see CRS Report RL32427, Millennium Challenge Corporation, by Curt Tarnoff.
The U.S. commitment to the Global Partnership spurred U.S. efforts to create a novel, comprehensive response spanning the suite of existing U.S. international development programs that address poverty, health, and food security. In May 2010, the Administration launched such a response, in the form of a new global hunger and food security initiative that it called Feed the Future (FTF).14 Later that year, the U.S. Agency for International Development (USAID) was named the lead agency responsible for implementing FTF, which was established on the basis of existing authorities set out in the Foreign Assistance Act of 1961 (FAA, P.L. 87-195), as amended.15 The Administration created the Bureau for Food Security within USAID in November 2010 to manage both the FTF initiative and other previously established USAID agricultural development programs.
To date, FTF has been led by USAID's Administrator, acting as U.S. Global Food Security Coordinator. FTF also has two deputy coordinators:16
- a Deputy Coordinator for Development, based at USAID, who coordinates implementation of FTF across the U.S. government, oversees its execution and reports on results, and leads engagement with the external community to ensure that food security remains high on the development agenda; and
- a Deputy Coordinator for Diplomacy, based at the State Department, who leads all aspects of U.S. diplomacy related to food security and nutrition, including in support of FTF.
Feed the Future Strategy
According to USAID, the overarching goal of FTF is to sustainably reduce global hunger and poverty by tackling their root causes using proven strategies and management approaches. These approaches include the development of strategies and interventions in coordination with stakeholders; a commitment to sound investments in coordination with reliable partners; and the adjustment of program elements and activities based on analyses of performance reports.17 USAID also requires that host governments demonstrate commitment to the efforts that they agree to pursue under FTF. FTF focuses on countries that have placed high priority on poverty and hunger reduction and have adopted national plans—called Country Investment Plans (CIPs)—to achieve these ends. According to USAID's Feed the Future Guide, FTF prioritizes investments that have the potential to achieve lasting and large-scale impacts—that is, outcomes that can most easily be expanded beyond a FTF activity's initial zone of influence (ZOI, i.e., the area within a country where FTF operates) and be sustained over time.18 To implement FTF, the United States works with host governments, international and regional development partners, and other stakeholders.
|
The Rome Principles for Sustainable Global Food Security19 FTF builds on the five principles for sustainable food security—referred to as the Rome Principles—first articulated at L'Aquila and endorsed at the 2009 World Summit on Food Security in Rome. The so-called Rome Principles are a set of five aid effectiveness principles that seek to
|
Focus, Aligned, and Strategic Partner Countries
According to USAID's Feed the Future Guide, FTF investments are prioritized for those countries where the Rome Principles can best be realized in practice. FTF "Focus Countries" are the primary recipients of assistance under FTF. The FTF initiative also includes "aligned" agricultural programs in additional countries.20 These countries receive some assistance for agricultural development, but they are not FTF focus countries. FTF also funds cooperative agricultural development programs with "strategic partner countries," which include Brazil, India, and South Africa. Strategic Partner programs seek to further enhance and "leverage the significant expertise, research capabilities, investment, and leadership" of strategic partner countries with respect to increasing global food and nutrition security "for the benefit of FTF focus countries."
Focus Country Selection
A U.S. governmental interagency process, led by USAID, selects focus countries based on assessments that measure suitability using the following set of five criteria:
- 1. Level of need. Need is based on income levels, prevalence of stunting,21 poverty, the Global Hunger Index compiled and published annually by the International Food Policy Research Institute (IFPRI), and the IFPRI categorization of level of food security, among other factors.22
- 2. Host government commitment, governance, leadership, and political will. FTF assessments are based on a range of factors, including basic political stability and the absence of conflict; the quality of governance; the overall economic policy environment; the commitment to design and implement a high-quality strategy to enhance food security; and the willingness to invest in agriculture, to place a high priority on food security for all of their citizens, and to commit to working in partnership with, among others, donors, civil society, international organizations, and the private sector.
- 3. Potential for agriculture-led growth. Within the FTF strategy, the principal mechanism for reducing extreme hunger and poverty is agricultural-led growth. Thus, it prioritizes countries where poverty is still predominantly rural and where significant potential for improvements in agricultural productivity, income generation for the poor, and market development exists.
- 4. Opportunity for regional synergies through trade and other mechanisms. Priority is given to countries that present strong opportunities to strengthen regional trade and development corridors, integrate markets, accelerate regional growth, and play a major role in regional trade.
- 5. Country resource availability and commitment. A central tenet of the FTF strategy is that creating lasting progress in food security will require deep investments in agricultural, economic, and social systems. To achieve this, USAID targets FTF resources toward countries that commit their own resources toward achieving the Millennium Development Goals (MDGs);23 however, USAID takes resource constraints into consideration.
Based on these criteria, FTF has prioritized investment in 19 focus countries (Table 2). Africa, with 12 focus countries, has been the leading recipient of FTF investments. See Table 5 for a breakout of FTF outlays by focus country. As of January 2016, no new focus country selections were planned.
|
Region |
# |
Countries |
|
Africa |
12 |
Ethiopia, Ghana, Kenya, Liberia, Malawi, Mali, Mozambique, Rwanda, Senegal, Tanzania, Uganda, Zambia |
|
Asia |
4 |
Bangladesh, Cambodia, Nepal, Tajikistan |
|
Latin America |
2 |
Guatemala, Honduras |
|
Caribbean |
1 |
Haiti |
|
World Total |
19 |
Source: USAID, Feed the Future, at http://feedthefuture.gov/countries.
Note: Initially, USAID also selected Nicaragua as a focus country; however, it was dropped early on, as it did not sufficiently meet the criteria.
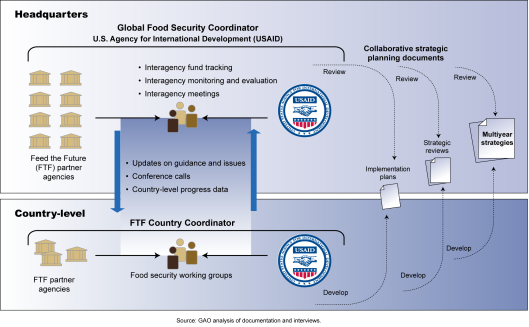
Developing and Implementing Country Multi-Year Strategies
All focus countries must have in place a Country Investment Plan (CIP), a multi-year investment strategy for achieving food security and related goals, such as poverty reduction and agriculturally led growth. Each CIP is developed by the focus country government in collaboration with development partners and national stakeholders.
|
Country Investment Plans, with a Focus on Africa While there are not formal required CIP criteria, the 2010 Feed the Future Guide—which has been superseded with respect to some of its requirements—called for CIPs to include the following:
In Africa, a key FTF program region, many CIPs have been produced in association with or guided by criteria set out under the African Union's Comprehensive Africa Agriculture Development Program (CAADP), a continent-wide "policy framework for agricultural transformation, wealth creation, food security and nutrition, economic growth and prosperity for all" that is implemented at the regional and country level.25 CAADP sets out a process for formulating national CAADP "compacts," or agricultural investment plans that undergo external technical review and provide an agenda for marshalling investment. CAADP compacts generally meet the criteria necessary to fulfill FTF programming requirements and are essentially equivalent to CIPS. USAID has worked with the African Union to ensure that these compacts are robust, as they form the basis for a variety of national level public and private sector investments in agricultural development, in addition to those under FTF. CAADP country compacts are developed under a process that integrates broad public stakeholder consultative processes; evidence-based analyses and research studies; development of investment goals, programs, and alliances; and an iterative process of assessment, learning, and plan improvement. Forty-two countries had finalized and adopted or were developing CAADP compacts as of late 2015.26 |
When a focus country is selected to participate in FTF, country government officials and FTF teams—usually also in collaboration with other stakeholders—assess CIP priorities and areas of weakness and strength in CIP planning or implementation. Particular issues that are prioritized for evaluation include patterns and sources of investment, the management and coordination of resources, and program implementation efficacy. Based on resulting findings and country priorities, the country and FTF staff develop a FTF-specific multi-year strategy (MYS), which sets out a five-year strategic implementation plan intended to ensure a coordinated U.S. whole-of-government approach for supporting the selected CIP goals targeted in the MYS.
The proposed MYS plan then undergoes a strategic review by FTF agencies active in a given country, including representatives from the field and Washington, DC, as well as the country government. Such reviews center on program target selection, returns on investment, and related issues. The MYS is then adjusted, if necessary, and approved for implementation. MYS may vary, but they generally
- assess development challenges and opportunities (e.g., set out commodity value chains and regions that are to receive targeted assistance, lay out cost-benefit considerations, and identify opportunities for synergy and collaboration);
- set out program structures and implementation plans built around a set of projected results (such as improved agricultural productivity, expanded markets and trade, and improved nutrition, among a host of other potential goals);
- lay out core investment targets, usually by commodity, or with respect to capacity-building, market or productivity gains, or institutional or policy outcomes; and
- establish monitoring and evaluation, financial planning, and management plans.
MYS undergo annual program implementation and portfolio reviews to assess relative efficacy and, if necessary, may be modified. Internally, FTF maintains MYS policy goal and implementation matrices that aid tracking and assessment of MYS implementation progress.
Most aligned countries also have in place a CIP; if they do not, a key FTF goal is to help them formulate a CIP—or improve an existing CIP if it is not robust—including through peer review processes. Aligned countries do not develop a formal MYS, but FTF-aligned country programming supports a targeted country investment and spending plan. Such programming must comply with FTF results framework requirements, including by incorporating a monitoring and evaluation plan linked to the FTF Monitoring System (FTFMS). The FTFMS is an inter-agency, indicator-based data collection and reporting mechanism that is used to assess program progress, inform decisions on prospective programming, and allocate budget resources.
Initially, before the MYS planning paradigm was fully elaborated, FTF employed a transitional two-phase investment approach, under which countries that lacked a CIP received "foundational" technical, financial, and political support to help them develop or hone a robust CIP, as well as conduct policy reform as needed and build country capacity necessary for scalable implementation of a CIP. If and as warranted, Phase I countries then moved on to become Phase II countries. This graduation required that a technically robust CIP be in place; that there be demonstrable coordination and consultation with key stakeholders centering on CIP formulation; and that the CIP focus country government demonstrate the commitment and capacity to implement the CIP. Phase II countries received so-called "core" investments in support of CIP implementation, new projects and/or the expansion of effective existing projects, increased project-specific support and improvement assistance, and other higher-level capacity-building support. According to FTF discussions with CRS, the Phase I/Phase II designation was assessed in 2013 and, based on a mix of initiative-wide learning, program evolution, and budget availability factors, was dropped as a formal FTF program structuring and allocation paradigm.27
In early 2016, FTF was undertaking an internal review of the implementation of the MYS approach across countries, as well as of other initiative activities, and was slated to contract and award an initiative-wide external evaluation later in 2016.
Partnering and Coordination
In addition to partnering with FTF recipient country governments, FTF works with a broad range of development stakeholders and multilateral institutions.
Partnerships with Other Stakeholders
An important feature of FTF is USG engagement with a range of development and investment partners in joint development ventures relating to the design, implementation, monitoring, and evaluation of FTF-related activities.28 In addition to host country governments, such partners may include a wide range of international-development stakeholders, including affected populations, non-governmental organizations (NGOs), foundations, universities, local civic and religious groups, private sector entities, labor unions, women-focused organizations, and donors and multilateral institutions.
The aim of extensive partnering under FTF is to leverage U.S. resources by coordinating their use with—and otherwise linking them to—the diverse, often unique capacities and resources of a wide range of stakeholders in order to achieve synergies, economies of scale, cost and program efficiencies, and similar benefits. Such stakeholders often have close ties to local communities, and in many cases may already have made commitments toward the FTF goals of reducing poverty and hunger. Extensive partnerships for planning and implementing activities are also intended to help foster more targeted, locally tailored interventions. The joint commitment of resources by multiple actors is also aimed at creating a greater potential for sustainable results than might be the case if the USG were the sole investor. Under shared stakeholder-backed projects, the USG co-designs, co-funds, and co-implements projects, thus sharing the risks, responsibilities, and results based on the resources and expertise that are available to each focus country.29 An additional potential result of this partnering approach is the strengthening of focus country capacity to engage in results-based planning and robust stakeholder consultation.
Coordination with Multilateral Institutions
According to USAID's Feed the Future Guide, robust multilateralism improves coordination among development partners and reduces the management burden of host governments.30 Thus, FTF emphasizes coordination at the global level with donors and multilateral institutions, particularly as relates to advocacy, resource mobilization, sharing information and best practices, tracking investments and results, and supporting country-owned processes. Given their convening authority and technical expertise, these institutions play a central role in efforts to enhance food security. They provide emergency assistance, undertake analysis and research, offer a platform for sector-wide investments in agriculture, and provide a significant portion of the external financing for investment projects and programs in developing countries.
Relevant multilateral institutions include a number of United Nations (U.N.) agencies, funds, and programs; international financial institutions, including the World Bank and regional development banks; and the OECD, among others. In an effort to institutionalize coordination among such institutions, the G-20 leaders, meeting in a summit held in Pittsburgh in 2009, called for the establishment of a multi-donor trust fund called the Global Agriculture and Food Security Program (GAFSP). For the United States, GAFSP is the multilateral component of FTF.
|
The Global Agriculture and Food Security Program (GAFSP) The GAFSP is a multilateral mechanism, administered by the World Bank, that funds projects supporting the agricultural investment plans of poor countries.31 GAFSP financing is available to members of the World Bank's International Development Association (IDA) only, specifically those that are eligible to receive financing from IDA.32 Additional need-based screens, such as undernourishment levels, per capita gross domestic product (GDP), suitable policy environment, and the development of a comprehensive agricultural development strategy, further restrict country eligibility. An important objective of the GAFSP is to consolidate donor resources where a multilateral approach holds a comparative advantage either because of economies of scale or donor capacity. This fund leverages the existing resources of multilateral institutions, their expertise and experience, and their presence in low-income countries to meet needs that donors and country partners often find difficult to address in a timely or efficient manner on their own. The GAFSP will also finance private sector activities to help catalyze investment along the agricultural value chain. Since its inception in 2010, the GAFSP public sector window has awarded $1 billion in grant financing to 30 low-income countries in Asia, Latin America, and Africa.33 In October 2012, the United States pledged to commit $1 for every $2 from other donors up to a total U.S. contribution of $475 million.34 As of December 2014, other donors had committed $242 million in additional funding, which was matched by the United States with $121 million from FY2014 appropriations. Fundraising efforts are ongoing. The Department of the Treasury expects at least an additional $80 million in new commitments from other donors, requiring at least $40 million from the United States to meet its matching challenge. See Table 3 for annual U.S. contributions to the GAFSP. |
Table 3. Global Agriculture and Food Security Program (GAFSP) Budget Requests and Appropriations, FY2010-FY2016
($ millions)
|
Fiscal Year |
Requested |
Enacted |
||
|
FY2010 |
|
|
||
|
FY2011 |
|
|
||
|
FY2012 |
|
|
||
|
FY2013 |
|
|
||
|
FY2014 |
|
|
||
|
FY2015 |
|
|
||
|
FY2016 |
|
|
Sources: Various annual President's Budget Requests (Requested) and congressional appropriations (Enacted) made under annual State, Foreign Operations (SFOPS) appropriations acts.
Notes: na = not available. Appropriations are made to the U.S. Treasury for distribution to the World Bank's Global Agriculture and Food Security Program (GAFSP). The data in this table are not adjusted for inflation. Data in this table do not match data for corresponding years in Table 1 because they reflect Administration requests and enacted appropriations rather than international commitments and funds disbursed.
a. USAID transferred the $66.6 million in FY2010 from the Development Assistance account to the U.S. Treasury. Additional transfers were made in FY2011 of $25 million, and in FY2012 of $14.2 million.
b. FY2013 appropriations occurred under a continuing resolution. The enacted numbers shown in this table are pre-sequestration estimates based on the previous year's (FY2012's) funding level.
c. A precise GAFSP funding level was not identified; instead funds appropriated under title III—Food Security and Agricultural Development fund component—of the FY2015 Appropriations Act may be used for GAFSP, but not to exceed 33% of the total amount.
Regional Organizations
According to USAID's Feed the Future Guide, regional coordination allows countries to share experiences, provide peer support, address cross-border trade issues, harmonize regulatory standards and practices, and benefit from trade flows, and FTF supports such ends in its three core regions, Africa, Asia, and Latin America and the Caribbean, and in the Middle East. In 2003, African leaders made a historic pledge to develop rigorous agricultural development strategies and to increase their own investments in agricultural-led growth through the African Union's Comprehensive Africa Agriculture Development Program (CAADP), a pan-continental initiative of the African Union. Through CAADP, FTF works with the African regional economic communities—Southern African Development Community (SADC), Economic Community of West African States (ECOWAS), and Common Market for Eastern and Southern Africa (COMESA)—to aid agricultural development at both the sub-regional and country levels. In addition, many individual FTF country multi-year strategies are premised on or align with separate national agricultural development CAADP "compacts" that also guide country agricultural development goals and activities.35 In other regions of the world, FTF works with organizations, such as the Asian Development Bank and the Inter-American Institute for Cooperation on Agriculture, to encourage technical and political support for the development of regional strategies that link to country-level planning and implementation around food security.
Whole of Government
Although USAID is the lead FTF agency, the initiative operates within a whole-of-government framework and is charged with coordinating efforts across 11 U.S. government agencies that have programs addressing an aspect of international poverty, health, and food security (see box below and Figure 1). Six of the FTF implementing agencies—USAID, USDA, Millennium Challenge Corporation (MCC), Treasury, Peace Corps, and U.S. African Development Foundation (USADF)—support field activities and report into the FTF Monitoring System (FTFMS), which aggregates a wide range of monitoring and evaluation (M&E) indicators (Table 4).36 According to the 2015 FTF progress report, FTF "began tracking results in FY2011, when the initiative developed multi-year strategies, defined its zones of influence, and implemented its monitoring and evaluation system."37 Although USAID leads FTF implementation, it does not directly control all agencies' FTF funding (see Table 4), in part because each agency's program and spending authorities are uniquely defined. Instead, USAID seeks to increase collaboration and complementarities between various agencies' program activities as they relate to FTF, including with respect to focus country selection, partnering, and monitoring and evaluation. A key goal of USAID coordination is to create synergy and alignment between disparate agencies' development efforts.
|
U.S. Government Feed the Future Partner-Agencies and Their Roles38 USAID—provides overall leadership of Feed the Future. USAID directly programs agriculture, nutrition, and development food assistance funding (including Food for Peace Title II emergency and non-emergency programs), while also coordinating, implementing, and assessing FTF programming at country and regional levels. Department of State—uses diplomatic efforts to keep food security and nutrition high on the global political agenda, to improve strategic coordination, and to increase global resources from other donors for food security and nutrition. Advances policy reforms that strengthen the effectiveness of food security investment, strengthens national frameworks for adoption and regulation of agricultural biotechnology, and partners with relevant United Nations agencies and other international organizations on global food security, nutrition, and the FTF agenda. USDA—supports agricultural development through research and extension; data and economic analysis; market information systems and statistics; and in-country and U.S.-based capacity building, including enhancing implementation of trade-related sanitary and phytosanitary standards. USDA further supports the USG's global food security efforts through the McGovern-Dole (MGD) International Food for Education and Child Health and Nutrition program, which focuses on improving the literacy of school-aged children and children's health and nutrition, and through the Food for Progress (FFPr) program, which seeks to improve agricultural productivity and expand trade and markets. USDA provides various types of training through the Borlaug and Cochran Fellowship professional technical training and collaborative research programs, as well as through the MGD and FFPr programs. USDA also leads the USG's open data in agriculture efforts through the Global Open Data for Agriculture and Nutrition initiative (GODAN), which supports global efforts to make agricultural and nutritionally relevant data available, accessible, and usable for unrestricted use worldwide.39 Department of the Treasury—coordinates multilateral development bank (MDB) support for food security, including contributions to the GAFSP.40 Promotes rigorous monitoring and evaluation of MDB projects and GAFSP investments. Encourages alignment of GAFSP investments with U.S. food security priorities. Oversees other MDB funding for agriculture, including activities of the International Fund for Agricultural Development (IFAD), the African Development Bank, the Asian Development Bank, and the World Bank. Department of Commerce—promotes trade and investment through the International Trade Administration and provides weather and climate forecasting and guidance to some FTF focus countries on climate change mitigation and sustainable fisheries through the National Oceanic and Atmospheric Administration. Millennium Challenge Corporation (MCC)41—supports country-led programs for agriculture- and food security-related investments through MCC compacts, including irrigation, roads, ports, post-harvest infrastructure, property rights and land policy, productivity and business training, agricultural finance, institutional and policy reform, and nutrition. As of July 2015, 22 out of 29 signed MCC compacts have included food security-related investments. Office of U.S. Trade Representative (USTR)—advances work on trade and investment policy, including trade facilitation and other efforts to reduce barriers to efficient markets consistent with international obligations in the World Trade Organization, through bilateral discussions such as Trade and Investment Framework Agreements, and through free trade agreements. Overseas Private Investment Corporation (OPIC)—supports U.S. private investments in some FTF focus countries through political risk insurance, debt financing, and support to private equity funds. U.S. African Development Foundation (USADF)—builds the capacity of local farmer associations and food processors in some African FTF focus countries. Also expands economic activities in rural communities and involves smallholders in local, regional, and international markets. U.S. Peace Corps—deploys Peace Corps Volunteers to support community economic development, agriculture, environment, and nutrition. U.S. Geological Survey (USGS)—offers scientific and technical expertise to enhance resilience to recurring drought. Provides remotely sensed seasonal forecast-derived products on crop performance indices for more informed recovery, response, and preparedness. Provides expertise on an integrated approach for sustainable water resources and management. |
FTF Monitoring and Evaluation (M&E) Approach
The FTF implementation strategy includes a monitoring and evaluation (M&E) component designed to enable monitoring of FTF implementation progress and to hold FTF investments and their stakeholders accountable. USAID provides FTF funding and technical assistance to focus countries in support of M&E. M&E tracks the progress of FTF investments against a Results Framework (Figure 2) that maps linkages between program activities and their intended outcomes. USAID evaluates the performance of FTF investments within a focus country zone of influence (ZOI, i.e., the area within a focus country where FTF operates) by assessing changes in key performance indicators. Measured results are compared against initial baseline values to assess progress, and against pre-established targets to determine the degree of any progress.
USAID and the focus country cooperating sponsors use the M&E system to provide regular feedback to facilitate planning and help improve the design and operation of ongoing programs.42 Key questions that M&E activities are intended to answer include the following: What are FTF investments buying? Are FTF activities, projects, and programs accomplishing what was intended? Are FTF efforts impacting the overall goal to reduce poverty and hunger? Are barriers hindering the progress or performance of FTF programs? What changes would support broader or deeper FTF program impacts? Which FTF activities are working and can be scaled up within the ZOI?
To make such determinations, FTF employs the following M&E tools:
(1) a Results Framework, which is the conceptual and analytic structure that establishes FTF goals and objectives and links them to specific indicators;43
(2) a performance monitoring process and standard performance indicators, which are used to track progress toward desired results;
(3) local capacity-building to improve the quality and frequency of data collection and use;
(4) evaluations to determine the measureable effects of FTF investments; and
(5) knowledge-sharing activities to foster learning and use of M&E findings.
Results Framework: Targeted Investments
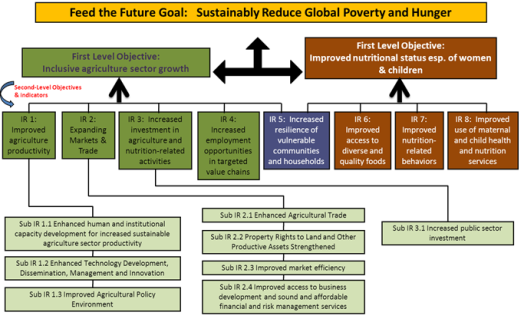
The FTF Results Framework maps linkages between program activities and their intended outcomes as they relate to the overall goal of sustainably reducing global hunger and poverty. The Framework outlines linkages through four levels of desired results that are intended to feed into each other from bottom to top (Figure 2 and Table A-1):
- first, the overall goal—sustainably reductions in global hunger and poverty;
- second, two objectives—promotion of inclusive agricultural sector growth and enhanced nutritional status, especially among women and children;
- third, eight intermediate results (IR), all relating directly to the two objectives; and
- fourth, several sub-intermediate results (Sub IR) that act as building blocks toward achieving progress at the IR level.
|
Figure 2. Feed the Future Results Framework (RF) Four Levels: Overall Goal, First Level Objectives, Intermediate Results (IR), and Sub-Intermediate Results |
 |
|
Source: USAID, "Volume I: Monitoring and Evaluation Under Feed the Future," M&E Guidance Series, February 2014, p. 2. Note: The RF levels, with associated indicators, are listed in "Summary Chart of Feed the Future Indicators," October 31, 2014, at https://www.feedthefuture.gov/resource/summary-chart-feed-future-indicators. |
Standard Performance Indicators
Each objective or result within each level has its own set of indicators.44 For example, for the Expanding Markets and Trade "intermediate result," indicators include the value of farm-level incremental sales and the value of exports of targeted agricultural commodities. The indicators used to date measure a combination of FTF outcomes, outputs, and impacts.45 According to USAID, by assessing the link between an intervention and an outcome, the impact evaluation process provides empirical evidence on the effectiveness of an intervention to inform policy and investment decisions. For a full list of FTF indicators, see the Appendix.
Local Engagement and Capacity Building in Program Design and M&E
The FTF strategy advocates and supports investment in strengthening national statistical systems and capacity in data use to inform policy, development priorities, and program design. To facilitate the development and execution of impact evaluations by the focus country, USAID engages local groups or host government agencies in FTF program design and implementation from the beginning of programming in a given area, with the goal of ensuring appropriate formulation of evaluation priorities and building local knowledge of data collection and analysis, and program evaluation methodologies. In addition, certain tools used for data collection of performance indicators—such as household or farm-level surveys or population sampling—include local groups or host government staff, such as the national statistics office, to build capacity to conduct the same methodologies in the future. USAID also collaborates with USDA's National Agricultural Statistics Service (NASS) and Economic Research Service (ERS) to assess countries' data needs and then develop programs to train staff and strengthen statistics systems. Ideally, with a strengthened system for program-specific data collection, USAID, cooperating sponsors, and focus countries will be better able to measure progress and make adjustments to FTF country strategy implementation.
Transparency
In addition to annual reporting to Congress, FTF is increasingly sharing its M&E findings regarding progress toward overall FTF goals externally, with both development stakeholders and the general public. Vehicles for doing so include the Feed the Future website (http://www.feedthefuture.gov), USAID's website (https://www.usaid.gov), and the Foreign Assistance Dashboard (http://www.foreignassistance.gov/).46
Research and Capacity Building
FTF includes investments in research in support of its food security and nutrition goals as delineated by the Results Framework. A consultative process among USAID, USDA, university partners, and other stakeholders was used to develop an explicit FTF-funded research strategy.47 Key considerations for FTF food security and nutrition goals are the constraints of limited agricultural land availability and increased climate variability. In this regard, the FTF research strategy calls for additional resources to be directed toward support for and development of scientific and technological innovations that increase agricultural productivity in an environmentally sound manner while improving the availability of nutritious foods.48
The FTF Food Security Innovation Center (FSIC) leads USAID's implementation of the FTF research strategy.49 The FSIC has organized projects around seven key program areas: climate-resilient cereals; legume productivity; advanced approaches to combat pests and diseases; research on nutritious and safe foods; markets and policy research; sustainable intensification; and human and institutional capacity development.
Investments in the FTF research strategy are done through research partnerships across the USG, the private sector, U.S. and non-U.S. universities, Consultative Group on International Agricultural Research (CGIAR) centers, focus-country national and regional research programs, and NGOs. In the past, USAID-funded research collaborations with U.S. land-grant universities as the principal implementing partner were referred to as Collaborative Research Support Programs (CRSPs). Under FTF, CRSPs are now called Innovation Labs. Currently there are 24 FTF Innovation Labs, each of which focuses on a different agricultural production activity.50 In line with the capacity-building strategy of FTF investments, FTF collaborative research arrangements are to be designed to engage developing country partners in ways that build the capacity of both women and men.
In addition to Innovation Labs, USAID and USDA collaborate under the Norman Borlaug Commemorative Research Initiative (NBCRI). The NBCRI is intended to strengthen international public goods research in ways that generate technologies and knowledge that support agricultural productivity both in the United States and developing countries.51 A related effort, the Borlaug 21st Century Leadership Program, announced in June 2011, represents a new effort to train individuals and strengthen developing country public and private institutions.52 Other USG agencies, such as the National Science Foundation and the National Institutes of Health, may also contribute to the broader research objectives and goals of FTF.
Cross-Cutting Issues
FTF plans and strategies identify gender equity, environmental stewardship and protection, and climate change as key priorities that it says all initiative investments and activities must address.
Gender Issues
Empowerment of women through gender integration is a major theme of the FTF initiative. The FTF implementation strategy contends that (1) reducing gender inequality and recognizing the contribution of women to agriculture are critical to achieving global food security, and (2) consistent and compelling evidence shows that improvements in the status of women are associated with increases in agricultural productivity, reductions in poverty, and improvements in household nutrition.53 As a result, FTF integrates gender-based analysis into all of its investments and employs the Women's Empowerment in Agriculture Index (WEAI) to measure women's empowerment and gender equality.54
The WEAI also seeks to identify ways to overcome the obstacles and constraints that limit women's inclusion in the agriculture sector.55 The WEAI is a measure of the roles and extent of women's engagement in the agricultural sector in five domains: (1) decisions about agricultural production; (2) access to and decisionmaking power over productive resources; (3) control over use of income; (4) leadership in the community; and (5) time use. In addition to the WEAI, gender-specific data are available for several of the other performance indicators, thus permitting comparisons of how FTF program effects vary across gender.56
Climate Change and Environment
Working in concert with the U.S. Global Climate Change Initiative,57 USAID contends that FTF investments in agricultural productivity support assessment of the potential vulnerabilities and impacts of climate change; development and deployment of climate-smart technologies and management practices; and policies that encourage the necessary investments and enabling environments to mitigate risk, improve resilience, and increase food security despite changing climate patterns.58
Funding
Congress has provided funding for FTF programs through the annual Department of State, Foreign Operations and Related Programs (SFOPS) appropriations bill. Congress does not specify a funding level for Feed the Future as a whole, but rather allocates funds for bilateral food security and agricultural development activities (implemented by USAID, MCC, and other agencies such as the Peace Corps), for multilateral food security accounts, and for global health programs implemented by USAID. Since 2010, Congress has allocated nearly $1 billion annually to food security and agricultural development activities under SFOPS appropriations. The Administration then determines whether or how to allocate these appropriations within the FTF framework. As a result, it can be difficult to determine FTF funding patterns based on appropriations acts. Data reported in Table 4 rely on FTF funding reported by the Administration.
Under the whole-of-government approach, FTF's operational strategy applies to other federal programs that invest in international agricultural development, even those that derive funding outside of FTF funding in the SFOPS appropriation. Whole-of-government outlays on food security and agricultural development programs grew nominally (i.e., in non-inflation adjusted terms) from an estimated $1.7 billion in FY2010 to $2.6 billion in FY2013 before declining to $2.4 billion in FY2014 (Table 4). In addition, FTF efforts are complemented by U.S. spending for nutrition-specific activities under other global health programs59 and multilateral institutional investments in both health and food security.60
Table 4. Feed the Future Implementing Agencies, Selected Estimated Funding Allocations, FY2010-FY2014
$ millions
|
FY2010 |
FY2011 |
FY2012 |
FY2013 |
FY2014 |
|||||||||||
|
USAIDa |
|
|
|
|
|
||||||||||
|
USAID Feed the Future |
|
|
|
|
|
||||||||||
|
Nutrition (Global Health Programs) |
|
|
|
|
|
||||||||||
|
Food for Peace Title II Development Aidb |
|
|
|
|
|
||||||||||
|
Treasuryc |
|
|
|
|
|
||||||||||
|
GAFSPd |
|
|
|
|
|
||||||||||
|
IFAD |
|
|
|
|
|
||||||||||
|
Millennium Challenge Corporation (MCC)e |
|
|
|
|
|
||||||||||
|
USDAf |
|
|
|
|
|
||||||||||
|
Food for Progress |
|
|
|
|
|
||||||||||
|
McGovern-Dole IFECN |
|
|
|
|
|
||||||||||
|
Cochran Fellowship Program |
|
|
|
|
|
||||||||||
|
Borlaug IAST Fellowship Program |
|
|
|
|
|
||||||||||
|
Peace Corpsg |
|
|
|
|
|
||||||||||
|
U.S. African Development Fund (USADF)h |
|
|
|
|
|
||||||||||
|
Approximate Total Funding Allocationsi |
|
|
|
|
|
Source: USAID, Feed the Future Results Summary, 2015, July 2015; at http://feedthefuture.gov/progress2015.
Notes: GAFSP = Global Agriculture and Food Security Program; IFAD = International Fund for Agricultural Development; and IAST = International Agricultural Science and Technology. The most recent data are available through FY2014. In preparing this table, USAID has combined outlays, enacted appropriations, and obligations as described in the table notes below. Thus, data in this table are representative of funding for FTF implementation as reported by the Administration. Certain federal agencies participate in FTF by providing policy and diplomatic support (i.e., activities that are difficult to measure and assign a dollar value to) and are not represented in this table. The data in this table are not adjusted for inflation.
a. USAID funding is the amount allocated for FTF programs, excluding agriculture, food security, and nutrition funding for Afghanistan, Pakistan, and Iraq. FY2010 USAID Feed the Future figures are base funding only and do not include a $62.1 million Haiti supplemental appropriation.
b. Annual Agricultural Appropriations fund Food for Peace Title II programs; however, USAID implements the funds and programs. According to the 2014 farm bill (P.L. 113-79; §3012), USAID shall make available not less than 20%, nor more than 30%, of Title II funds to carry out non-emergency (i.e., development) food aid, with a minimum of $350 million each fiscal year. For details, see CRS Report R41072, U.S. International Food Aid Programs: Background and Issues, by Randy Schnepf.
c. GAFSP and IFAD figures represent enacted amounts.
d. Dollar amounts in this row correspond with the third column of Table 3.
e. These figures represent disbursements of food security-related investments from MCC Compacts.
f. Funding represents obligations for these programs.
g. Represents estimated funding for Peace Corps Volunteers working in agriculture, environment, and health (nutrition and water/sanitation) programs.
h. Represents funding obligated for new grants that build the capacity of local farmer associations and food processors in nine African FTF focus countries. Also expands economic activities in rural communities and involves smallholders in local, regional, and international markets.
i. The data represent a combination of appropriations, obligations, and outlay. Totaling the data may result in some double counting, but is done here to indicate funding patterns for the time period shown.
|
FY2010 |
FY2011 |
FY2012 |
FY2013 |
FY2014 |
FY2015a |
|||||||||||||
|
Total Focus-Country Allocations |
|
|
|
|
|
|
||||||||||||
|
Ethiopia |
|
|
|
|
|
|
||||||||||||
|
Ghana |
|
|
|
|
|
|
||||||||||||
|
Kenya |
|
|
|
|
|
|
||||||||||||
|
Liberiab |
|
|
|
|
|
|
||||||||||||
|
Malawi |
|
|
|
|
|
|
||||||||||||
|
Mali |
|
|
|
|
|
|
||||||||||||
|
Mozambique |
|
|
|
|
|
|
||||||||||||
|
Rwanda |
|
|
|
|
|
|
||||||||||||
|
Senegal |
|
|
|
|
|
|
||||||||||||
|
Tanzania |
|
|
|
|
|
|
||||||||||||
|
Uganda |
|
|
|
|
|
|
||||||||||||
|
Zambia |
|
|
|
|
|
|
||||||||||||
|
Sub-Total: Africa |
|
|
|
|
|
|
||||||||||||
|
Bangladesh |
|
|
|
|
|
|
||||||||||||
|
Cambodia |
|
|
|
|
|
|
||||||||||||
|
Nepal |
|
|
|
|
|
|
||||||||||||
|
Tajikistan |
|
|
|
|
|
|
||||||||||||
|
Sub-Total: Asia |
|
|
|
|
|
|
||||||||||||
|
Guatemala |
|
|
|
|
|
|
||||||||||||
|
Haitic |
|
|
|
|
|
|
||||||||||||
|
Honduras |
|
|
|
|
|
|
||||||||||||
|
Sub-Total: C. Am. & Caribbean |
|
|
|
|
|
|
Source: Personal communication between USAID and CRS, September 1, 2015.
Notes: This table includes USAID Feed the Future allocations that are specific to the 19 focus countries. It does not include funding for strategic partners, regional programs, research and development, monitoring and evaluation, markets, partnership and innovations, economic resilience, and aligned agricultural programs.
b. In FY2014, Liberia continued implementation of FTF programs with available prior year resources.
c. Figures do not include $62.1 million in FY2010 supplemental funding for Haiti.
Status and Accomplishments
USAID publishes an annual FTF progress report that includes data measuring progress made from baseline measures and toward aspirational targets based on select indicators.61 USAID publishes FTF progress reports as part of its effort to establish a transparent set of overarching guidelines for justifying and implementing U.S. non-emergency food aid and agricultural development activities.
FTF Progress Report
In 2012, USAID set as aspirational five-year targets, to be achieved by 2017, the reduction by 20% of the prevalence of extreme poverty62 and the prevalence of stunted children less than five years of age63 in the ZOI where FTF programs are concentrated. USAID expects these reductions to remove about 12 million people from the ranks of the extremely poor and prevent stunting in about 1 million children. Based on preliminary data through 2014, USAID reports that progress had been made in three of the focus countries with respect to a reduced prevalence of poverty, and in five countries with respect to reductions in stunting. No final interim data points have been published, and USAID has not yet reported on the status of progress toward these aspirational goals in any of the remaining focus countries. See Table 6 for reported progress by country.
The most recent FTF progress report includes performance indicator data that track the impact of investments made through FY2014.64 USAID uses a combination of data that tracks both the effects of FTF in focus countries on direct beneficiaries, as well as both direct and indirect beneficiaries in the geographic ZOI within focus countries where programs are being implemented and resources coordinated (Table 7).
Gender Progress Relative to the WEAI Baseline
FTF supports targeted efforts to ensure and increase gender equity in FTF hunger and poverty reduction programs, with the goal of enhancing the socioeconomic prospects of women. The first joint FTF/IFPRI focus country report on gender—referred to as the Women's Empowerment in Agriculture Index (WEAI) baseline report—was released in May 2014 and contained the initial baseline values for 13 of the 19 focus countries.65 FTF expects to use changes in future year WEAI Index measures to assess progress with respect to women's empowerment in agriculture made as a result of FTF investments. In addition to the WEAI, several FTF performance indicators include disaggregation by gender, which allows gender-specific comparison (Table 7).
According to the WEAI baseline report, greater access to resources for women and more equitable access to resources between males and females can foster large improvements in reaching program goals. FTF primarily uses the WEAI to prioritize and target activities with respect to improving gender-related program design. The first WEAI report found that
- baseline WEAI values revealed substantial differences in the relative empowerment of women relative to men across focus countries;
- WEAI scores had a large distribution (in a range of 0 to 1), from a low of 0.66 in Bangladesh to a high of 0.98 in Cambodia, with higher numbers indicating greater empowerment;66
- the greatest constraints on empowerment among women in agriculture were a lack of access to credit and the power to make credit-related decisions; excessive workloads; and a low prevalence of membership in social groups or agriculture-related associations; and
- baseline WEAI values indicated substantial variability among the primary constraints to women's empowerment across regions; in Asia, for instance, the main limitation was lack of group membership, while in East and Southern Africa it was access to and decisions on credit and excess workload.
|
Country |
Impact, Region, Period |
FTF Activity Involved |
|
|
Reductionsa in Childhood Stuntingb of 20% to Be Achieved by 2017 |
|||
|
Bangladesh |
14% reduction: (38.2% to 32.7%) in FTF ZOI 2011 to 2014 |
USG implements large-scale nutrition projects, Food for Peace development programs, and maternal and child health activities across the FTF ZOI. Collectively, these projects have reached more than 2 million children annually with nutrition interventions. |
|
|
Cambodia |
21% reduction: (41.2% to 32.6%) in FTF ZOI 2010 to 2014 |
USG supported nutrition counseling for caregivers of undernourished children, mass media nutrition education campaigns, growth monitoring, and nutrition-sensitive horticulture. USDA's McGovern-Dole IFECN programs provided take-home rations to families and training in child health and nutrition. The USG reached more than 130,000 children with nutrition interventions in 2014. |
|
|
Ethiopia |
9% reduction: 44.4% to 40.2% Nationally 2011 to 2014 |
USG investments including the President's Initiative to End Hunger in Africac and nutrition education programs. For example, in 2014 the USG trained more than 20,000 people in nutrition and reached over 1.3 million children under five with evidence-based nutrition interventions, such as micronutrient supplementation. |
|
|
Ghana |
33% reduction: 28.0% to 18.8% nationally 2008 to 2014 |
USG investments in agricultural and maternal and child health programs including nutrition-specific activities (such as management of severe malnutrition) and nutrition-sensitive agriculture (including promotion of household water and sanitation, horticulture, livestock, and safety net programs). In 2014, approximately 230,000 children were reached directly with such interventions. |
|
|
Kenya |
25% reduction: 36.3% to 26.3% in FTF ZOI 2009 to 2014 |
USG invested in nutrition interventions and training. For example, in 2014, USG efforts reached over 3 million children under five with nutrition interventions and provided nutrition training to more than 6,000 health care providers, community health workers, agriculture extension agents, and others. |
|
|
Reductions in Povertyd of 20% to Be Achieved by 2017 |
|||
|
Bangladesh |
16% reduction in FTF ZOI 2011 to 2015 |
USG provided over $200 million, including over $100 million in Food for Peace development programming. In FY2014, FTF helped over 1.97 million smallholder farmers utilize new technologies or management practices, including efficient fertilizer techniques, high-yielding rice varieties, and improved practices for horticulture and aquaculture. |
|
|
Uganda |
16% reduction in FTF ZOI; 20% reduction nationally 2009-2010 to 2012-2013 |
FTF has provided more than $150 million to improve agricultural productivity (especially for beans, maize, coffee, and horticulture), nutrition, and other aspects of food security. USDA has improved market linkages, trained smallholder farmers in conservation farming and farm management, increased access to financial services, provided financial literacy training to agribusinesses, and increased access to improved inputs and output markets. |
|
|
Honduras |
27% reduction in FTF ZOI 2012 to 2014 |
FTF focuses on coffee and horticulture value chains, improved land preparation, crop and water management practices, and diversified livelihoods. |
|
Source: USAID, Feed the Future Results Summary, 2015, July 2015, at http://feedthefuture.gov/progress2015.
Notes: FTF ZOI = Feed the Future Zone of Influence; USG = U.S. government.
a. All reductions are from initial baseline values established in the starting year of the indicated time period.
b. Stunting is a height-for-age measurement that is a reflection of chronic undernutrition. This indicator measures the percent of children 0-59 months who are stunted, as defined by a designated height-for-age ratio.
c. A multi-year effort to help fulfill the Millennium Development Goal of reducing the number of hungry people on the continent by 2015.
d. Extreme poverty is defined by the World Bank as people living on less than $1.25 per day.
Table 7. Feed the Future Selected Global Results, FY2011-FY2014
Numbers shown are attributed to U.S. government assistance under FTF
|
Performance Indicatora |
FY2011b |
FY2012 |
FY2013 |
FY2014 |
|||||
|
Improved Agricultural Productivity |
|
|
|
|
|||||
|
Rural households benefiting from FTF activitiesc |
|
|
|
|
|||||
|
Hectares under improved technologies or practicesd |
|
|
|
|
|||||
|
Farmers using improved technologies or practices |
|
|
|
|
|||||
|
Male-to-female ratiof |
|
|
|
|
|||||
|
Expanded Markets and Trade |
|
|
|
|
|||||
|
Value of incremental salesg |
|
|
|
|
|||||
|
|
|||||||||
|
Value of agricultural and rural loans |
|
|
|
|
|||||
|
Enterprises, including farmers, receiving loans |
|
|
|
|
|||||
|
Male-to-female ratio |
|
|
|
|
|||||
|
Public-private partnerships formed |
|
|
|
|
|||||
|
Value of new private sector investment |
|
|
|
|
|||||
|
Improved Use of Nutrition Service |
|
|
|
|
|||||
|
Children under-5 reached by nutrition programh |
|
|
|
|
|||||
|
Male-to-female ratio |
|
|
|
|
|||||
|
Health facilities able to treat acute under-nutritioni |
|
|
|
|
|||||
|
Capacity Building |
|
|
|
|
|||||
|
Individuals receiving agr.-related M.A. or Ph.D. |
|
|
|
|
|||||
|
Male-to-female ratio |
|
|
|
|
|||||
Source: USAID, Feed the Future Results Summary, 2015, July 2015; at http://feedthefuture.gov/progress2015.
Notes: na = not available. No documented baselines are available for these indicators prior to FY2011, when the FTF developed its zones of influence and monitoring and evaluation system. In addition, the data presented may not be comprehensive. Participating agencies do not necessarily report on all countries with programs or on all indicators. U.S. government agencies reporting into the FTF Monitoring System include USAID, USDA, MCC, Treasury, Peace Corps, and the USADF. FTF began tracking results in FY2011, when the initiative developed multi-year strategies, defined its zones of influence, and implemented its monitoring and evaluation system. USAID has used additional information provided after publication of progress reports for previous years to adjust previously reported results from FY2011 to FY2013.
a. For more information, visit the FTF Indicator Handbook at http://www.feedthefuture.gov/progress.
b. Reporting was incomplete in 2011, the first year of the FTF Monitoring system. Figures do not reflect the full impact of FTF programs that year.
c. This indicator counts households with at least one member who is a beneficiary of an FTF activity, meaning that the member directly receives goods or services provided by the activity. The intervention must be significant, and an individual is not to be counted if merely reached by an activity through brief attendance at a meeting or gathering.
d. For example, use of improved seeds and other crop genetics, fertilizer and other soil-related technologies, irrigation and water management, or new management practices.
e. FTF changed the criteria for this indicator, resulting in a revised value for FY2012.
f. The male-to-female ratio represents the gender shares across program participants.
g. Incremental sales reflect increases in sales above the value at baseline. In 2014, significant increases in incremental sales were seen as a result of increased productivity of horticultural and climate-resilient commodities, which have scaled up over the past several years. They comprise a portion of total sales, which equaled more than $1.4 billion in FY2014.
h. USAID anticipates some double-counting among overlapping projects working in the same regions of some countries. Such double-counting cannot be calculated with precision due to the logistics of working in the field. Individual USAID projects count children only once even if they are reached several times. Feed the Future, Food for Peace Development, and Global Health Nutrition programs all deliver nutrition interventions as part of a multi-sectoral effort to combat malnutrition.
i. USAID defines severe acute undernutrition as a very low weight for height, visible severe wasting, or the presence of nutritional edema. Decreasing child mortality and improving maternal health depend heavily on reducing malnutrition, which is responsible, directly or indirectly, for 35% of deaths among children under age 5 (World Health Organization). The value for this indicator decreased in FY2013 compared with FY2012 because USAID terminated investments in a large community health activity in Malawi. USAID understands that most or all of those health clinics are still operating; however, they are not counted in FY2013 because the activity supporting and reporting on them is no longer active.
Issues for Congress
Efforts to Institutionalize Feed the Future
FTF was created as an ad hoc Obama Administration initiative. According to the Administration, the Foreign Assistance Act of 1961, as amended, provides authority for FTF. Concerned that future administrations might not recognize or use that authority to pursue programs broadly akin to those being pursued under the FTF, Members of Congress introduced legislation in the 113th Congress to permanently authorize an agriculture-focused global food and nutrition security strategy and programs. H.R. 1567 was enacted by Congress and signed into law as P.L. 114-195 in July 2016, establishing a specific statutory foundation for global food security assistance. Under this law, the President must develop a whole-of-government strategy to promote global food security, resilience, and nutrition, and submit the strategy, including agency-specific plans, to Congress by October 1, 2016. Congressional consideration of that strategy may be on the agenda of the 115th Congress. Furthermore, the law authorizes funding to support the strategy (just over $1 billion per year) only for FY2017 and FY2018, potentially requiring congressional action in the 115th Congress to extend the funding authorization.
Whole of Government
The FTF initiative adopted a whole-of-government approach ostensibly to ensure coordination of related activities and to tap expertise residing outside of the principal agencies in charge of development assistance, USAID and MCC. The extent to which FTF capitalizes on the expertise and budgetary resources of different U.S. government agencies is difficult to measure. According to one analyst:
Success will depend on the lead agency's ability to overcome inherent problems, and that often depends on the nature of the lead agency's political position within the administration. Collaborating is time consuming particularly in the beginning when time must be spent defining interagency roles and responsibilities. Every agency within a whole of government construct has its own structure, culture, and decision making process that may not be compatible in terms of budgeting, transparency or accountability. Each agency's congressional oversight and appropriations panels may be unevenly committed to the effort. The programs of various agencies do not always lend themselves to common frames of evaluation, monitoring, and correlating adjustments. Each of these challenges is mirrored and often amplified within U.S. embassy country teams.67
Similarly, in a September 2013 report, GAO found that administration of FTF has remained dominated by USAID:
USAID leads the whole-of-government approach by better coordinating and integrating partner agencies' knowledge and expertise at three levels: at headquarters in Washington, D.C.; in each of the 19 FTF focus countries; and between the countries and headquarters. In headquarters, USAID and FTF partner agencies established joint strategies and new data management systems to track funding and results across the U.S. government. At the country level, in GAO's survey of U.S. FTF partner agency representatives in 19 FTF focus countries, 93 percent reported coordinating with USAID.68
Country-Led Planning
The FTF 2010 Guide characterizes "country-led planning" of FTF activities as a key process for ensuring country ownership, program relevance, and sustainability of impacts over time. In the past, some Members of Congress have voiced concern over country-led planning because it diminishes donor control and oversight, specifically with respect to relative alignment with broad, global donor development and foreign policy objectives. Others have voiced concern that some developing countries lack the capacity to develop robust strategic plans, and may have a limited capacity to carry out accountability and transparency measures required by donors. Still others within civil society have voiced concerns over the possibility that country-led planning processes may privilege government-led strategies and not adequately include the inputs and perspectives of civil society and nongovernmental organizations (CSOs and NGOs), or private sector actors, or citizens.
While the FTF Guide emphasizes partnering across a range of civil society organizations within focus countries, the actual measurement of their level of effective participation is likely subjective. GAO, in its September 2013 report, found that (at that time) USAID had facilitated a country-led approach but had not systematically assessed risks associated with this approach. It reported that
USAID has facilitated the approach by providing assistance to the host governments in developing country plans and coordinating on FTF with country stakeholders, including nonprofit and for-profit organizations. U.S. FTF partner agency representatives answering GAO's survey reported working with multiple country stakeholders on FTF. In its March 2010 report, GAO found that the country-led approach was vulnerable to a number of risks, including insufficient capacity of host governments to meet funding commitments for agriculture. USAID has since made some progress in monitoring these risks, including tracking the number of focus countries that increase public expenditure for agriculture. However, GAO's current study found that USAID's FTF multiyear country strategies did not systematically assess risks to the country-led approach.69
Although USAID country guidance documents indicate that country teams must assess risks associated with USAID's development objectives, the agency does not require country teams or FTF programs to systematically respond to and mitigate such risks, potentially raising opportunity cost losses associated with not doing so.
Linkages with Food for Peace Food Aid
Under the FTF whole-of-government approach, Food for Peace (FFP) development food aid programs are considered to be part of the FTF initiative, at least to the extent that they are coordinated with FTF goals and monitoring and evaluation strategies. FFP development programs include non-emergency Title II activities.70 The funding for FFP development programs derives primarily from non-FTF appropriations. For example, FFP Title II and McGovern-Dole (Food for Education) funding derives from annual agricultural appropriations. Food for Progress receives mandatory funding through USDA's Commodity Credit Corporation. FFP Title II food aid (historically referred to as P.L. 480) is arguably a larger component of U.S. food security assistance than FTF. The Administration's FY2016 request includes $1.4 billion for FFP Title II food aid compared with an FTF budget request of $0.9 billion. The majority of FFP funds, however, must be used to purchase and deliver emergency food supplies rather than address long-term food security.
The independent nature of such appropriations, as well as the dedicated authorities under which these programs operate, may mean that they are not well suited or structured for integration with FTF or other complementary programs. This likely does not pose major challenges to the goals set out under FTF. In practice, there has long been at least some coordination and complementarity between these programs. In some cases, USAID has played a key or lead role in their administration. USAID, for instance, is the implementing agency for both FFP Title II and FTF. The broad application of FTF guidelines to FFP programs closely dovetails with the preexisting objectives of FFP. This may ensure more effective joint coordination, monitoring, and reporting on progress toward common, measurable goals. In some countries FTF Community Development Funds are programmed jointly by FTF and FFP.
A separate concern is the FFP program's continued use of in-kind donations, the use of which may conflict with FTF goals of improving agricultural productivity and enhancing rural incomes in focus countries that receive both donations under FFP and investments under FTF. The United States continues to rely primarily on in-kind transfers of domestically purchased commodities (acquired by USDA and transferred to USAID for shipment), shipped primarily on U.S.-flag vessels, as the basis for international food aid (referred to as "tied food aid").71 FFP programs are, by law, restricted to in-kind transfers of U.S.-sourced commodities, even though multiple studies and GAO reports over the past decade have provided evidence of economic inefficiencies and potential market distortions associated with in-kind food aid compared with cash-based assistance.72 In particular, monetization of in-kind food aid—in which imported food aid is sold on local markets to generate funds for development programs—has the potential to depress local market prices, as well as small farmer revenues and production incentives.73
Both the George W. Bush and Obama Administrations (via their annual budget requests), as well as certain Members of Congress, via bills in the 113th (H.R. 5656 and S. 2909) and 114th (S. 525) Congresses, have proposed making changes to the structure and intent of U.S. food aid programs. Proposed changes include, among others, expanding flexibility in the use of cash-based forms of assistance and eliminating both cargo preference and monetization. The 2014 farm bill (P.L. 113-79) provided some additional flexibility, increasing the maximum amount of allowable cash assistance for administrative costs for USAID's food assistance programs from 13% to 20%, with the purpose of limiting monetization.74 However, other proposed changes have yet to be approved by Congress.
Since 2010, USAID's Office of Food for Peace has managed funds appropriated through the International Disaster Assistance (IDA) account in addition to P.L. 480 FFP program funds. These funds complement USAID's in-kind food aid and may be used where cash assistance is most appropriate due to local market conditions or when in-kind food aid cannot arrive in time. In FY2014, the Office of Food for Peace contributed approximately $865 million in IDA funds (both base and overseas contingency operations funds) to support local and regional food procurement as well as cash transfers and vouchers to address emergency food security needs. Adjusting the relative funding levels for P.L. 480 and non-P.L. 480 humanitarian accounts, such as IDA, is one way in which Congress may address the limitations of the FFP program.
Another issue related to FFP Title II food aid concerns whether its substantial emergency donations are purely humanitarian in nature, rather than substantially related to FTF development goals, and to the extent, if any, to which they are subject to FTF monitoring and evaluation.75 USAID may use FFP Title II in-kind donations for both emergency and non-emergency (or development) assistance. Since 2003 nearly 75% of Title II food aid has consisted of emergency food aid. Despite the emphasis on coordination of U.S. food aid programs, little mention is made of whether and how U.S. emergency food aid fits into the overall FTF strategy.
Key questions relating to FFP food aid programs may include the following: Do emergency food aid activities effectively reinforce the objectives of FTF? Conversely, could there be adverse effects for FTF activities from in-kind food aid projects? Finally, to what extent are FTF guidelines being applied to McGovern-Dole and Food for Progress programs when they are implemented in non-focus countries?
Appendix. Performance Indicators
Program evaluation involves the use of measurable criteria described and measured by a performance indicator to assess program efficacy. Examples of evaluation tracking indicators include improvements in a child's physical growth, expanded crop area under a new technology or management practice, output per unit of an agricultural production activity, or the percent of national budget allocated to nutrition or agriculture. FTF currently uses 53 indicators to measure progress toward each result in the four levels of the Results Framework (RF) (Table A-1).76
To prioritize FTF investments, each focus country determines which section of the RF is most applicable in its country context and which linkages will have the greatest potential for change. All countries must seek to achieve the overall RF Goal and Objectives. They then select from among eight potential Intermediate Results those that are most likely to help them meet their particular needs.
Under the second level—the objectives—the RF posits six indicators (three for each objective) for measuring results with respect to achieving the objective. Accelerating inclusive agricultural growth is assessed by (1) agriculture sector GDP; (2) per capita expenditures of rural households; and (3) the women's empowerment in agriculture index (WEAI, discussed earlier). Similarly, to measure progress toward the objective of improving nutritional status, especially of women and children, the RF lists three nutrition-oriented indicators: (1) prevalence of stunted children, (2) prevalence of wasted children, and (3) prevalence of underweight women.
The third RF level of eight intermediate results (IRs) is specified under the two objectives. For example, IRs for agricultural sector growth are measures of improved agricultural productivity and expanding markets and trade. IRs for the nutrition objective include improved use of maternal and child health and nutrition services and improved access to diverse and quality foods.
The fourth level of the RF—specific Sub-IRs—varies by country and region. Each focus country selects project-level indicators from the set of 53 indicators to best measure progress against the chosen sections of the RF. A baseline for each indicator assesses initial need and provides a reference for measuring progress. For each indicator selected, countries set targets and routinely track progress toward them. While countries monitor performance against applicable output and outcome indicators for their projects and programs, an M&E contractor monitors higher-level impact indicators, such as "prevalence of poverty," to maintain consistency in reporting across focus countries and to reduce workload in the field. FTF performance management plans (PMPs) are developed by the FTF mission (i.e., the whole-of-government U.S. team) for each country. In addition, FTF implementing partners will develop PMPs for all projects supported by the mission.
Of the 53 FTF performance indicators, 8 are required, and 21 are required, if applicable, to enable FTF missions to ensure comprehensive reporting on FTF objectives. Additional indicators, including custom indicators tailored to measure specific projects, can be used as needed. USAID identifies 9 indicators as whole-of-government indicators (Table A-2).77 These are indicators that other U.S. government agencies supporting food security programs and services with non-FTF funding (e.g., MCC, USDA, etc.) have pledged to use. USAID encourages use of as many of the 53 indicators as applicable to their work.
|
Results Framework (RF): Level and Indicators (#) |
|
|
RF: Level One—Overall Goal and Indicators |
|
|
OVERALL GOAL: Sustainably Reduce Global Poverty and Hunger |
|
|
1- |
Prevalence of underweight children under five years of age |
|
2- |
Prevalence of Poverty: Percent of people living on less than $1.25/day |
|
RF: Level Two—Objectives and Indicators |
|
|
Key Objective 1- Inclusive Agricultural Sector Growth |
|
|
1- |
Percent change in agricultural GDP |
|
2- |
Daily per capita expenditures (as a proxy for income) of USG-assisted areas |
|
3- |
Women's Empowerment in Agriculture Index (WEAI) |
|
Key Objective 2- Improved Nutritional Status, Especially of Women and Children |
|
|
1- |
Prevalence of stunted children under five years of age |
|
2- |
Prevalence of wasted children under five years of age |
|
3- |
Prevalence of underweight women |
|
RF: Level Three—Intermediate (IR), and Level Four—Sub-Intermediate Results, and Indicators |
|
|
IR 1- Improved Agricultural Productivity |
|
|
1- |
Gross margin per hectare, animal, or cage of selected product (activities vary by country) |
|
Sub IR 1.1: Enhanced Human and Institutional Capacity Development via FTF Assistance |
|
|
1- |
Number of farmers and others using applied improved technologies or management practices |
|
2- |
Number of individuals receiving long-term agricultural productivity or food security training |
|
3- |
Number of individuals receiving short-term agricultural productivity or food security training |
|
4- |
Number of food security for-profit private enterprises, producers organizations, water users associations, women's groups, trade and business associations, and community-based organizations receiving FTF assistance |
|
5- |
Number of members of producer organizations and community-based organizations receiving FTF assistance |
|
6- |
Number of people implementing risk-reducing practices/actions to improve resilience to climate change |
|
7- |
Number of private enterprises (for profit), producers organizations, water users associations, women's groups, trade and business associations, and community-based organizations that applied new technologies or management practices |
|
Sub IR 1.2: Enhanced Technology Development, Dissemination, Management and Innovation |
|
|
1- |
Hectares under new or improved/rehabilitated irrigation or drainage services as a result of FTF assistance |
|
2- |
Number of hectares under improved technologies or management practices as a result of FTF assistance |
|
3- |
Number of rural households benefiting directly from USG interventions |
|
4- |
Number of technologies or management practices in one of the following phases of development: |
|
Sub IR 1.3: Improved Agricultural Policy Environment (increase productivity) |
|
|
1- |
Number of agricultural and nutritional enabling environment policies completing the following processes/steps of development as a result of FTF assistance in each case: Stage 1: Analysis |
|
2- |
Number of national policies supporting regionally agreed-upon policies for which a national-level implementation action has been taken as a result of FTF assistance (Regional missions only) |
|
IR 2- Expanding Markets and Trade |
|
|
1- |
Value of incremental sales (collected at farm- level) attributed to FTF implementation |
|
2- |
Percent change in value of intra-regional trade in targeted agricultural commodities (for regional missions) |
|
3- |
Value of exports of targeted agricultural commodities as a result of FTF assistance (for bilateral missions) |
|
Sub IR 2.1: Enhanced Agricultural Trade |
|
|
Sub IR 2.2: Property Rights to Land and Other Productive Assets Strengthened |
|
|
1- |
Number of households with formalized land |
|
Sub IR 2.3: Improved Market Efficiency |
|
|
1- |
Total increase in installed storage capacity (m3) |
|
2- |
Kilometers of roads improved or constructed |
|
Sub IR 2.4: Improved access to business development and financial and risk management services |
|
|
1- |
Value of Agricultural and Rural Loans |
|
2- |
Number of MSMEs,a including farmers, receiving FTF-assisted access loans |
|
3- |
Number of MSMEs, including farmers, receiving FTF-assisted business development services |
|
IR 3- Increased Investment in Agriculture and Nutrition-related Activities Leveraged by FTF |
|
|
1- |
Number of public-private partnerships formed as a result of FTF assistance |
|
2- |
Value of new private sector investment in the agriculture sector or food chain |
|
3- |
Number of firms (excluding farms) or CSOs engaged in agricultural and food security-related manufacturing and services now operating more profitably (at or above cost) |
|
Sub IR 3.1- Increased Public Sector Investment |
|
|
1- |
Percentage of national budget allocated to nutrition |
|
2- |
Percentage of national budget allocated to agriculture |
|
IR 4- Increased employment opportunities in Project-level, targeted value chains |
|
|
1- |
Number of jobs attributed to FTF implementation |
|
IR 5- Increased resilience of vulnerable communities and households |
|
|
1- |
Prevalence of households with moderate or severe hunger |
|
2- |
Number of FTF social assistance beneficiaries participating in productive safety nets |
|
3- |
Depth of Poverty: Mean percent shortfall relative to the $1.25 poverty line |
|
4- |
Number of vulnerable households benefiting directly from FTF interventions |
|
IR 6- Improved Access to Diverse and Quality Foods |
|
|
1- |
Prevalence of children 6-23 months receiving a minimum acceptable diet |
|
2- |
Women's Dietary Diversity: Mean number of food groups consumed by reproductive-age women |
|
3- |
Prevalence of women of reproductive age who consume targeted nutrient-rich value chain commodities |
|
4- |
Prevalence of children 6-23 months who consume targeted nutrient-rich value chain commodities |
|
5- |
Total quantity of targeted nutrient-rich value chain commodities produced by direct beneficiaries that is set aside for home consumption |
|
IR 7- Improved nutrition-related behaviors |
|
|
1- |
Prevalence of exclusive breastfeeding of children under six months of age |
|
IR 8- Improved utilization of maternal and child health and nutrition services |
|
|
1- |
Number of people trained in child health and nutrition through FTF-supported programs |
|
2- |
Prevalence of anemia among women of reproductive age |
|
3- |
Prevalence of anemia among children 6-59 months |
|
4- |
Number of children under five reached by FTF-supported nutrition programs |
|
5- |
Number of health facilities with established capacity to manage acute undernutrition |
|
6- |
Number of children under five years of age who received vitamin A from FTF-supported programs |
Source: Summary Chart of Feed the Future Indicators, October 31, 2014; USAID Feed the Future website, at https://www.feedthefuture.gov/resource/summary-chart-feed-future-indicators.
Notes: FTF Results Framework has four levels of results: goals, objectives, intermediate results (IR), and sub-intermediate results (Sub IR). Each of these levels has its own set of indicators.
a. Micro (1-10), small (11-50), and medium (51-100) (parenthesis = number of employees) enterprises (MSMEs).
|
Level Three—Intermediate Result (IR) and Indicators (#) |
|
|
IR 1- Improved Agricultural Productivity |
|
|
1- |
Number of individuals who have received U.S. government (USG) supported short-term agricultural sector productivity or food security training. |
|
2- |
Number of farmers and others who have applied new technologies or management practices as a result of USG assistance. |
|
3- |
Number of hectares under improved technologies or management practices as a result of USG assistance. |
|
4- |
Number of food security private enterprises (for profit), producers organizations, water users associations, trade and business associations, and community-based organizations (CBOs) receiving USG assistance. |
|
5- |
Number of private enterprises, producer organizations, water users associations, women's groups, trade and business associations, and community-based organizations (CBOs) that applied new technologies or management practices as a result of USG assistance. |
|
6- |
Hectares under new or improved/rehabilitated irrigation or drainage services as a result of USG assistance. |
|
IR 2- Expanding Markets and Trade |
|
|
7- |
Kilometers of roads improved or constructed. |
|
8- |
Value of Agricultural and Rural Loans. |
|
9- |
Number of households with formalized land. |
Source: USAID, Feed the Future, online document, downloaded August 3, 2015, from http://www.feedthefuture.gov/sites/default/files/resource/files/ftf_results_framework_2013.pdf.