Introduction
Holding capital enables banks to absorb unexpected losses (up to a point) without failing.1 To improve individual bank safety and soundness and financial system stability, bank regulators have implemented a number of regulations requiring banks to hold minimum levels of capital. These minimums, expressed as ratios between various balance sheet items, are called capital ratio requirements. Although capital ratio requirements can generate the benefits of safety and stability, they impose certain costs, including potentially reducing credit availability and raising credit prices.2 Given these characteristics, how capital ratio requirements should be calibrated and applied is subject to debate.
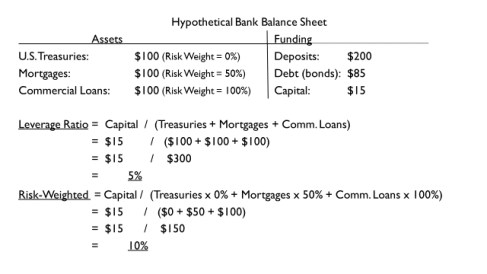
Capital ratios fall into one of two main types—a leverage ratio or a risk-weighted ratio. A leverage ratio treats all assets the same, requiring banks to hold the same amount of capital against the asset regardless of how risky each asset is. A risk-weighted ratio assigns a risk weight—a number based on the asset's riskiness that the asset value is multiplied by—to account for the fact that some assets are more likely to lose value than others. Riskier assets receive a higher risk weight, which requires banks to hold more capital to meet the ratio requirement, thus better enabling them to absorb losses.3
One question within the broader debate over bank regulation is what capital ratio requirements relatively small, safe banks should face. In general, policymakers conceptually agree that small, safe banks—which have fewer resources to devote to compliance and individually pose less risk to the financial system—should face a simpler, less costly regulatory regime. Accordingly, bank regulators have imposed higher thresholds and more complex rules on the largest banks for a number of years.4 However, some industry observers have argued for further tailoring for smaller banks.5
In response to concerns that small banks faced unnecessarily burdensome capital requirements, Congress mandated further tailoring of capital rules in Section 201 of P.L. 115-174, the Economic Growth, Regulatory Relief, and Consumer Protection Act of 2018 (EGRRCPA). Section 201 created the Community Bank Leverage Ratio (CBLR), a relatively simple ratio to calculate. Under this provision, a bank with less than $10 billion in assets that meets certain risk-profile criteria set by bank regulators will have the option to exceed a single CBLR threshold instead of being required to exceed several existing, more complex minimum ratios. The CBLR is set at a relatively high level compared to the existing minimum ratio requirements. Banks that exceed the CBLR are to be considered (1) in compliance with all risk-based capital ratios and (2) well capitalized for other regulatory considerations.6 Because small banks typically hold amounts of capital well above the required minimums, the CBLR option will allow many small banks to opt out of requirements to meet and report more complex ratios.
Section 201 grants the federal bank regulatory agencies—the Federal Reserve (the Fed), the Office of the Comptroller of the Currency (OCC), and the Federal Deposit Insurance Corporation (FDIC) (hereinafter collectively referred to as "the bank regulators")—discretion over certain aspects of CBLR implementation, including setting the exact ratio, as the statute mandates a range between 8% and 10%.7 In November 2018, the regulators proposed 9%.8 The banking industry and certain policymakers criticized this decision, arguing that the threshold would be too high.9 Despite the criticism, the bank regulators issued a joint press release on October 29, 2019, announcing they had finalized the rule with a 9% threshold.10
|
Capital Ratio Requirement Definitions Capital: The difference between the value of a bank's assets (what it owns) and the value of its liabilities (what it owes to depositors and creditors) is the bank's capital. In practice, banks raise capital by issuing equity (commonly referred to as stock) or other instruments with equity-like characteristics, by retaining earnings, or by other methods. A bank's balance sheet records each type of capital separately. Which types of capital a bank can use to meet capital ratio requirements differ from requirement to requirement. Capital ratio: A measure of how much capital a bank holds relative to its total assets or total exposures to losses. Generally expressed as percentage ratio between balance sheet values, such as (Capital/Total Assets)x100%, (Capital/Total Exposures)x100%, or (Capital/Risk-weighted Assets)x100%. For an explanation of Risk-weight Assets, see "Risk-weighted Ratio" definition below. See Figure 1 for simplified calculation examples. Capital ratio requirement: A rule implemented by bank regulators mandating that all banks or a set of banks hold an amount of capital such that a specified capital ratio meets or exceeds a minimum percentage. Community Bank Leverage Ratio (CBLR): A capital ratio created by Section 201 of the Economic Growth, Regulatory Relief, and Consumer Protection Act of 2018 (EGRRCPA; P.L. 115-174). It is a ratio of capital to unweighted assets. If a bank meeting other qualifying characteristics exceeds a threshold CBLR percentage, it is exempt from generally applicable minimum ratios. Generally applicable capital requirements: The capital ratio requirements that all banks generally must meet if they do not have an exemption, such as the exemption created in Section 201 of EGRRCPA. Leverage ratio: A capital ratio in which the denominator is the sum of all the values of assets or exposures to losses. No adjustments are made to those values; all are treated equally regardless of the risk of loss on individual asset classes or exposures. Risk-weighted ratio: A capital ratio in which the values of assets and exposures are adjusted by being multiplied by a risk weight before they are summed to make the denominator. Relatively risky assets are assigned higher risk weights to reflect the greater possibility of losses, and thus banks must hold more capital against risky assets than safe ones to meet risk-weighted capital ratio requirements. Conversely, relatively low-risk assets are assigned lower risk-weights, and so require the bank to hold less capital relative to risky assets. |
On March 27, 2020, the Coronavirus Aid, Relief, and Economic Security Act (CARES Act; P.L. 116-136) was enacted in an effort to mitigate the adverse effects of the Coronavirus Disease 2019 (COVID-19) pandemic. Section 4012 of the law temporarily lowered the CBLR to 8% until the earlier of (1) the date the public health emergency ends, or (2) the end of 2020. In the rulemaking implementing this provision, the regulators lowered the ratio to 8% until the end of 2020, and chose to raise the ratio first to 8.5% in 2021, before returning it to 9% on January 1, 2022.11
This report examines capital ratios generally, as well as the capital ratio regime that was in place before EGRRCPA's enactment and will continue to be in place for banks that do not qualify for or do not elect to exercise the CBLR option. It then describes Section 201 of EGRRCPA, the regulation implemented pursuant to that provision, and the ensuing debate surrounding this implementation. The report then describes the temporary lowering of the threshold pursuant to the CARES Act. Lastly, this report presents estimates on the number and characteristics of banks that would have qualified under the rule given their pre-implementation balance sheets and estimates those banks' CBLRs in the pre-implementation time period. This provides context on the number of banks potentially affected by CBLR implementation.
Background on Capital Requirements
A bank's balance sheet is divided into assets, liabilities, and capital. Assets are largely the value of loans owed to the bank and securities owned by the bank. To make loans and buy securities, a bank secures funding by either incurring liabilities or raising capital. A bank's liabilities are largely the value of deposits and debt the bank owes depositors and creditors. Banks raise capital through various methods, including issuing equity to shareholders or issuing special types of bonds that can be converted into equity. Importantly, many types of capital—unlike liabilities—may not contractually require the bank to make payouts of specified amounts.12
Banks make profits in part because many of their assets are generally riskier, longer-term, and more illiquid than their liabilities, which allows them to earn more interest on their assets than they pay on their liabilities. The practice is usually profitable, but it exposes banks to risks that can lead to failure. When defaults on a bank's assets increase, the money coming into the bank decreases. However, the bank generally remains obligated to make payouts on its liabilities. Capital, though, enables the bank to absorb losses. When money coming in decreases, the bank's payouts on capital can be reduced, delayed, or cancelled. Thus, capital allows banks to continue to meet their rigid liability obligations and avoid failure even after experiencing unanticipated losses on assets.13 For this reason, regulators require banks to hold a minimum level of capital, expressed as ratios between items on bank balance sheets.
Generally Applicable Requirements (Without CBLR Option)
Banks have been subject to capital ratio requirements for decades. U.S. bank regulators first established explicit numerical ratio requirements in 1981. In 1988, they adopted the Basel Capital Accords proposed by the Basel Committee on Banking Supervision (BCBS)—an international group of bank regulators that sets international standards—which were the precursor to the ratio requirement regime used in the United States today.14 Those requirements—now known as "Basel I"—were revised in 2004, establishing the "Basel II" requirements that were in effect at the onset of the financial crisis in 2008. In 2010, the BCBS agreed to more stringent "Basel III" standards.15 Pursuant to this accord, U.S. regulators finalized new capital requirements in 2013.16
Banks are required to satisfy several different capital ratio requirements. A detailed examination of how these ratios are calculated is beyond the scope of this report.17 (Figure 1 provides a highly simplified, hypothetical example.) The following sections examine the mix of leverage and risk-weighted ratio requirements in effect prior to CBLR's implementation to enable comparison between regulatory regimes.
 |
|
Source: Congressional Research Service (CRS). |
Leverage Ratio Requirements
Most banks are required to meet a 4% minimum leverage ratio.18 In addition, to be considered well capitalized for other regulatory purposes—for example, being exempt from interest-rate and brokered-deposit restrictions—banks must meet a 5% leverage ratio.19 Furthermore, 15 large and complex U.S. banks classified as advanced approaches banks must maintain a minimum 3% supplementary leverage ratio (SLR) that uses an exposure measure that includes both balance sheet assets and certain other exposures to losses that do not appear on the balance sheet. Finally, a subset of eight of the largest and most complex U.S. banks classified as globally systemically important banks (G-SIBs) must meet an enhanced SLR (eSLR) requirement of 5% at the holding-company level20 to avoid capital-distribution restrictions, and 6% at the depository level to be considered well capitalized.21
Risk-Weighted Ratio Requirements
The required risk-weighted ratios depend on bank size and capital quality (some types of capital are considered less effective at absorbing losses than other types, and thus considered lower quality). Most banks are required to meet a 4.5% risk-weighted ratio for the highest-quality capital and ratios of 6% and 8% for lower-quality capital types.22 To be considered well capitalized for purposes of interest-rate and brokered-deposit restriction exemptions (among other regulatory considerations), a bank's ratios must be 2% above the minimums (i.e., 6.5%, 8%, and 10%, respectively).23 In addition, banks must have an additional 2.5% of high-quality capital on top of the minimum levels (7%, 8.5%, and 10.5%, respectively) as part of a capital conservation buffer in order to avoid restrictions on capital distributions, such as dividend payments.24 Advanced approaches banks are subject to a 0%-2.5% countercyclical buffer that the Fed can deploy if credit conditions warrant increasing capital (the buffer is currently 0% and has been so since its implementation).25 Finally, the G-SIBs are subject to an additional capital surcharge of between 1% and 4.5% based on the institution's systemic importance.26
Effects of Capital Ratio Requirements
Whether the generally applicable capital requirements' (i.e., the requirements facing all banks prior to the implementation of the CBLR) potential benefits—such as increased bank safety and financial system stability—are appropriately balanced against the potential costs of reduced credit availability is a debated issue.27 Capital is typically a more expensive source of funding for banks than liabilities. In addition, calculating and reporting the ratios requires banks to devote resources—such as employee time and purchases of specialized software—to regulatory compliance. Thus, requiring banks to hold higher levels of capital and meet certain ratios imposes costs. This could lead banks to reduce the amount of credit available or raise credit prices.28
Leverage Ratio and Risk-Based Ratios: Relative Strengths and Weaknesses
Leverage ratios and risk-based ratios each have potential strengths and weaknesses. Because the CBLR exempts certain banks from risk-weighted ratio requirements and allows them to use a single leverage ratio, bank regulators will likely consider those relative strengths and weaknesses in determining which banks should have the CBLR option.
Riskier assets generally offer greater rates of return to compensate investors for bearing more risk. Thus, without risk weighting banks have an incentive to hold riskier assets because the same amount of capital must be held against risky and safe assets. In addition, a leverage ratio alone may not fully reflect a bank's riskiness because a bank with a high concentration of very risky assets could have a similar ratio to a bank with a high concentration of very safe assets.29 Risk weighting can address these issues, because the bank is required to hold more capital against risky assets than against safe ones (and no capital against the safest assets, such as cash and U.S. Treasuries).
However, risk weighting presents its own challenges. Risk weights assigned to particular asset classes could inaccurately estimate some assets' true risks, especially because they cannot be adjusted as quickly as asset risk might change. Banks may have an incentive to overly invest in assets with risk weights that are set too low (because they would receive a riskier asset's high potential rate of return, but have to hold only enough capital to protect against a safer asset's losses), or inversely to underinvest in assets with risks weights that are set too high. Some observers believe that the risk weights in place prior to the 2007-2009 financial crisis were poorly calibrated and "encouraged financial firms to crowd into" risky assets, exacerbating the downturn.30 For example, banks held highly rated mortgage-backed securities (MBSs) before the crisis, in part because those assets offered a higher rate of return than other assets with the same risk weight. MBSs then suffered unexpectedly large losses during the crisis.
Another criticism is that the risk-weighted system involves needless complexity and is an example of regulator micromanagement. The complexity could benefit the largest banks, which have the resources to absorb the added regulatory cost, compared with small banks that could find compliance costs more burdensome.31 Thus, critics argue, small banks should be subject to a simpler system to avoid giving large banks a competitive advantage.
Section 201 of P.L. 115-174
In response to concerns about the generally applicable capital ratio requirements' effects on small banks, Congress mandated in Section 201 of EGRRCPA that certain qualifying banks that exceed a non-risk-weighted Community Bank Leverage Ratio (CBLR) be considered in compliance with all risked-weighted capital ratios and well capitalized for other regulatory purposes.32 The provision defined qualifying banks as those with less than $10 billion in assets, but also authorized the federal bank regulators to disqualify banks based on "risk profile, which shall be based on consideration of—(i) off-balance sheet exposures; (ii) trading assets and liabilities; (iii) total notional derivatives exposures; and (iv) such other factors as the appropriate Federal banking agencies determine appropriate."33 This report refers to banks that meet these criteria as CBLR-qualifying banks. Section 201 also directed federal bank regulators to set a threshold ratio of capital to unweighted assets at between 8% and 10% (as discussed in the "Generally Applicable Requirements (Without CBLR Option)" section, the current minimum leverage ratio is 4% and the threshold to be considered well capitalized is 5%). This report refers to qualifying banks that would exceed the threshold as CBLR-compliant banks.
Although the act specified in statute one qualifying criterion (less than $10 billion in assets) and established a range within which the CBLR must be set (8% to 10%), it granted the regulators discretion in certain aspects, including setting other qualifying criteria and the exact level within the 8%-10% range.
Under Section 201, qualifying banks that meet size and risk criteria would fall into one of two groups with respect to the CBLR threshold when the new regulation goes into effect.34 The CBLR-compliant banks (i.e., those above the threshold) would have the option to enter the CBLR regime, and be considered in compliance with all risk-based capital ratio minimums and well capitalized for other regulatory purposes.35 This would free those banks from costs associated with meeting risk-based minimums and reporting their ratios (a quarterly exercise requiring bank resources). Most small banks hold enough capital to exceed the threshold, and thus will be provided this regulatory relief without having to raise extra capital. Banks that meet the size and risk-profile criteria (i.e., CBLR-qualifying banks) but whose capital holdings are below the CBLR threshold can remain in the preexisting capital regime (no banks are required to meet the CBLR), or can choose to raise capital or otherwise change their balance sheet composition in order to become CBLR compliant.
Regulatory Implementation
On November 21, 2018, the bank regulators announced they were inviting public comment on a proposed CBLR rulemaking.36 The proposal included the statutorily mandated qualifying criterion that only banks with less than $10 billion in assets would be eligible. In addition, the regulators used the authority granted by Section 201 to exclude banks based on risk-profile characteristics by including a number of additional qualifying criteria that limited banks' trading activity and off-balance-sheet exposures.37 On the question of where within the 8% to 10% range to set the CBLR threshold, the regulators chose 9%, arguing that this level supports the "goals of reducing regulatory burden for community banking organizations and retaining safety and soundness in the banking system."38
The banking industry criticized aspects of the rule. For example, an industry group representing community banks indicated it was "disappointed that regulators have proposed capital standards that are higher than necessary" and "supports an 8% community bank leverage ratio."39 In its comment letter, the group noted that an 8% threshold "would calibrate the CBLR closer to the current risk-based capital requirements ... [and] put the ratio closer to the current 5% leverage requirement."40
Despite the criticism, the bank regulators issued a joint press release on October 29, 2019, announcing they had finalized the rule with a 9% threshold. The rule went into effect on January 1, 2020.41
Section 4012 of the CARES Act (P.L. 116-136)
When borrowers miss payments on loans at an unanticipated high rate, banks incur losses and potentially must write down the value of their capital, reducing their capital ratios. To halt or slow the decline and stay above regulatory thresholds, banks may respond by halting or slowing the growth of assets by making fewer loans. If the missed payments are the result of widespread economic distress, this reduction in credit availability may exacerbate the downturn.
The COVID-19 pandemic caused widespread economic disruption as millions of businesses shut down and unemployment soared. To mitigate the pandemic's economic effects, among its other adverse effects, Congress passed the CARES Act (P.L. 116-136). Section 4012 of the CARES Act temporarily lowers the CBLR to give qualifying banks using this capital measure more leeway to continue lending and stay above the threshold as the pandemic's economic effects unfold. The provision directs regulators to lower the CBLR to 8% and to give banks that fall below that level a reasonable grace period to come back into compliance with the CBLR. This mandate expires the earlier of (1) the date the public health emergency ends or (2) the end of 2020. In the rulemaking implementing this provision, the regulators lowered the ratio to 8% until the end of 2020, and chose to raise the ratio first to 8.5% in 2021, before returning it to 9% on January 1, 2022.42
Analysis: Banks, Qualifying Criteria, and CBLR-Compliant Thresholds
Outside of bank policy circles and absent context, debating whether a threshold ratio of capital to unweighted assets is best set at 8% or 9% may seem inconsequential. However, hundreds of banks can be affected by just fractions of a percentage point. This section provides estimates of how many depositories would, as of June 30, 2019,43 likely fall above or below the CBLR threshold if set at 9% or 8%. Those estimates at the state level are provided in Appendix A. This section also includes statistics on certain characteristics of banks that meet or do not meet various CBLR criteria.
The estimates presented here are based on Congressional Research Service (CRS) analysis of (1) data provided by FDIC-insured depository institutions (insured depository institutions can be either banks or savings associations, but will be referred to as "banks") on their Consolidated Statement on Condition and Income, known as the call report, for the second quarter of 2019;44 and (2) information found in the CBLR notice of proposed rulemaking published in the Federal Register.45 CRS could not find in the call report some data points necessary to provide a definitive list of and exact statistics on which banks would and would not qualify and be CBLR compliant.46 Thus, the CRS list of qualifying and compliant banks and the calculation of every bank's current CBLR may not exactly match the eventual actual numbers. A more detailed description of CRS methodology is provided in Appendix B.
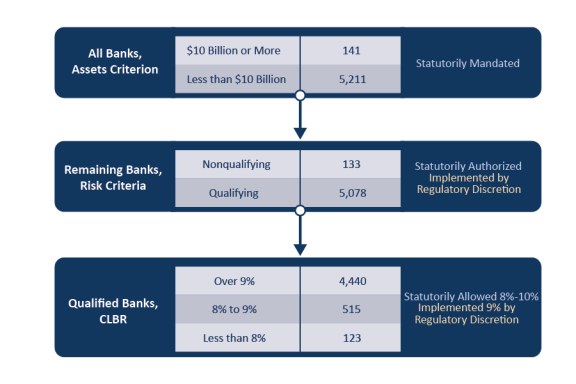
CRS began with all 5,352 banks that filed call reports for the second quarter of 2019, and first filtered out those with $10 billion or more in assets (see Figure 2). Based on that criterion, 141 banks would not have qualified and 5,211 would have if they met the risk-profile criteria.
Those 5,211 were then checked against the risk profile-based criteria, and 5,078 were found to qualify. This high rate of qualification is not entirely surprising at the depository level, because small banks are generally unlikely to engage intensely enough in the activities and products included in the risk criteria to exceed the allowable threshold.47
Of the 5,078 qualifying banks, 4,440 had CBLRs above 9% and thus would have been CBLR compliant. Of the remainder (638 banks), 515 banks had CBLRs between 8% and 9%, and thus would have been compliant if the CBLR threshold level was 8%.
|
Figure 2. Number of Qualifying Banks and Their CBLRs (As of June 30, 2019 [before CBLR implementation]) |
 |
|
Source: CRS calculations using data from the Federal Financial Institutions Examination Council, Bulk Data Download website, at https://cdr.ffiec.gov/public/PWS/DownloadBulkData.aspx, accessed on September 14, 2019. |
Table 1 compares the averages of certain balance-sheet values and ratios at qualifying and nonqualifying banks. Total assets measures bank size. Loans as a percentage of total assets and deposits as a percentage of total liabilities measure how concentrated a bank is in traditional, core banking activities, while trading assets and liabilities as a percentage of total assets measure how active it is in noncore activities. Off-balance-sheet exposures as a percentage of total assets measures bank risk that is not reflected on the balance sheet. Recall from "Risk-Weighted Ratio Requirements" that banks must meet three different minimum risk-weighted requirements that differ in the types of capital used to calculate the ratio. The types of capital they use are categorized as common equity Tier 1 (CET1), Tier 1, and total capital. Tier 1 capital is what is used to calculate the generally applicable leverage ratio in place before the CBLR. CET1 is the most loss-absorbing category of capital and allows the fewest capital types of the three.48 Tier 1 includes additional items not allowable in CET1.49 Total capital is the most inclusive, allowing certain Tier 2 capital items not allowable in Tier 1.50 The average of these ratios is presented to give an indication of how well capitalized banks were, as measured by the existing capital regime.
Banks that would not have qualified for the CBLR under the regulator-set risk-profile criteria were on average almost twice as large as qualifying banks ($1.05 billion vs. $542 million), but were still mostly relatively small banks. In addition, nonqualifying banks' concentrations in lending, deposit taking, and trading were not substantively different from qualifying banks'. However, their off-balance-sheet exposures and capital levels notably differed.
Nonqualifying banks had significantly more off-balance-sheet exposures as a percentage of total assets—37% on average, compared to an average of 8.5% at qualifying banks. (A difference is expected, as this characteristic is a risk-profile criterion for qualification. However, the large disparity and the fact that both groups are quite far from the allowable 25% threshold are notable). Furthermore, nonqualifying banks' average risk-based capital ratios were lower than qualifying banks' levels by about a quarter. These latter two differences indicate that regulators set the risk-profile criteria in a way that would disqualify banks with large off-balance-sheet exposures that are relatively thinly capitalized when the risk of their assets is taken into account. Arguably, this would mean that giving those banks the ability to opt out of risk-based requirements could expose them and the banking system to unacceptably high failure risks.
Table 1. Balance Sheet Averages: Qualifying Versus Nonqualifying Banks
(As of June 30, 2019 [before CBLR implementation])
|
Qualifying |
Nonqualifying |
|
|
Number |
5,078 |
133 |
|
Assets ($millions) |
$542 |
$1,052 |
|
Loans (as % of total assets) |
65.5% |
70.6% |
|
Deposits (as % of total liabilities) |
93.8% |
91.6% |
|
Trading assets & liabilities (as % of total assets) |
0.0% |
1.1% |
|
Off-balance-sheet exposures (as % of total assets) |
8.5% |
37.2% |
|
Common equity tier one ratio (risk-weighted) |
24.5% |
18.5% |
|
Tier one ratio (risk-weighted) |
24.5% |
18.5% |
|
Total capital ratio (risk-weighted) |
25.6% |
19.5% |
|
Tier one leverage ratio (not risk-weighted) |
13.2% |
14.5% |
Source: Congressional Research Service calculations using data from the Federal Financial Institutions Examination Council, Bulk Data Download website, at https://cdr.ffiec.gov/public/PWS/DownloadBulkData.aspx, accessed on September 14, 2019.
Table 2 compares banks that would have exceeded the 9% CBLR threshold, those that would have only met the threshold if it was set at 8%, and those that would not have met any threshold allowable given the Section 201 mandated range (i.e., 8%-10%). When banks compliant at a 9% threshold are compared to those compliant at the 8% threshold, there is a great deal of similarity in size, activities, and off-balance-sheet exposure. However, the 8% banks' risk-based capital ratios were lower by about half when compared to the 9% banks. In this way, banks compliant at 8% were quite similar to the banks that would not have qualified at the 8% level. These capital characteristics may have been a factor in regulators deciding not to allow these banks to opt out of risk-based capital requirements.
Table 2. Balance Sheet Averages by Possible CBLR Thresholds
(As of June 30, 2019 [before CBLR implementation])
|
>9% |
8%-9% |
<8% |
|
|
Number |
4,440 |
515 |
123 |
|
Assets ($millions) |
$529 |
$655 |
$537 |
|
Loans (as % of total assets) |
65.3% |
68.1% |
60.7% |
|
Deposits (as % of total liabilities) |
93.7% |
94.3% |
95.4% |
|
Trading assets& liabilities (as % of total assets) |
0.0% |
0.0% |
0.0% |
|
Off-balance-sheet exposures (as % of total assets) |
8.6% |
8.7% |
6.1% |
|
Common equity tier one ratio (risk-weighted) |
26.1% |
12.9% |
14.2% |
|
Tier one ratio (risk-weighted) |
26.1% |
13.0% |
14.3% |
|
Total capital ratio (risk-weighted) |
27.2% |
14.0% |
15.3% |
|
Tier one leverage ratio (not risk-weighted) |
13.9% |
8.6% |
7.0% |
Source: Congressional Research Service calculations using data from the Federal Financial Institutions Examination Council, Bulk Data Download website, at https://cdr.ffiec.gov/public/PWS/DownloadBulkData.aspx, accessed on September 14, 2019.
It is also instructive to compare banks with CBLRs between 9% and 10% and those with CBLRs between 8% and 9%. In Table 2, the average risk-based ratios of banks with CBLRs greater than 9% were boosted by banks that held very high levels of capital. Since the regulatory agencies cannot set the threshold above 10%, banks with such CBLRs are not at issue in the implementation. Rather, the agencies have determined that banks with CBLRs between 9% and 10% should be able to benefit from the CBLR regime, whereas 8%-9% banks should not. Table 3 shows that the risked-based differences between 9%-10% banks and 8%-9% banks were not as pronounced as when all CBLR compliant banks are the point of comparison. Instead, the increases in the various risked-based measures closely reflect the 1% increase in the CBLR.
|
>10% |
9%-10% |
8%-9% |
<8% |
|
|
Number |
3,470 |
970 |
515 |
123 |
|
Assets ($millions) |
$529 |
$698 |
$655 |
$537 |
|
Loans (as % of total assets) |
64.1% |
69.7% |
68.1% |
60.7% |
|
Deposits (as % of total liabilities) |
93.5% |
94.4% |
94.3% |
95.4% |
|
Trading assets & liabilities (as % of total assets) |
0.0% |
0.0% |
0.0% |
0.0% |
|
Off-balance-sheet exposures (as % of total assets) |
8.3% |
9.5% |
8.7% |
6.1% |
|
Common equity tier one ratio (risk-weighted) |
29.6% |
13.8% |
12.9% |
14.2% |
|
Tier one ratio (risk-weighted) |
29.6% |
13.8% |
13.0% |
14.3% |
|
Total capital ratio (risk-weighted) |
30.6% |
14.9% |
14.0% |
15.3% |
|
Tier one leverage ratio (not risk-weighted) |
15.1% |
9.5% |
8.6% |
7.0% |
Source: Congressional Research Service calculations using data from the Federal Financial Institutions Examination Council, Bulk Data Download website, at https://cdr.ffiec.gov/public/PWS/DownloadBulkData.aspx, accessed on September 14, 2019.
Key Findings
- CRS estimates that of the 5,352 U.S. depositories, 5,078 (95% of all banks) would have been CBLR compliant provided their capital exceeds the 9% threshold set by regulators. Of those, about 4,440 (83% of all banks) currently exceed that threshold.
- Regulators are statutorily authorized to set the threshold as low as 8%. If they did so, about 515 additional qualifying banks (10% of all banks) would have exceeded the threshold, and thus been eligible for exemption from risk-based ratio compliance.
- Under the risk-profile criteria set by regulators, nonqualifying banks were on average larger (though still relatively small by industry standards), had significantly larger off-balance-sheet exposures, and held about a quarter less capital than qualifying banks, as measured by risk-based ratios.
- Banks that would have been CBLR compliant at a 9% threshold were similar in size, activities, and off-balance-sheet exposures to 8% threshold banks. However, the latter group held about half the risk-based capital that the former did.
- The difference in risk-based measures between 9%-10% CBLR banks and 8%-9% CBLR banks was not as pronounced. The 1 percentage point increase in the CBLR threshold is more or less reflected in the difference in the risk-based measures.
Appendix A. Qualifying Banks by CBLR and State
|
State |
Banks Meeting Qualifying Criteria |
Greater than 9% |
CBLRs Categories 8% to 9% |
Less Than 8% |
|
Alabama |
113 |
106 |
4 |
3 |
|
Alaska |
5 |
5 |
0 |
0 |
|
Arizona |
14 |
13 |
1 |
0 |
|
Arkansas |
88 |
80 |
7 |
1 |
|
California |
134 |
123 |
8 |
3 |
|
Colorado |
72 |
63 |
8 |
1 |
|
Connecticut |
35 |
28 |
7 |
0 |
|
Delaware |
21 |
19 |
2 |
0 |
|
District of Columbia |
3 |
1 |
2 |
0 |
|
Florida |
109 |
86 |
17 |
6 |
|
Georgia |
160 |
135 |
17 |
8 |
|
Guam |
3 |
2 |
0 |
1 |
|
Hawaii |
6 |
5 |
1 |
0 |
|
Idaho |
9 |
7 |
2 |
0 |
|
Illinois |
413 |
368 |
40 |
5 |
|
Indiana |
101 |
95 |
6 |
0 |
|
Iowa |
273 |
232 |
35 |
6 |
|
Kansas |
217 |
186 |
24 |
7 |
|
Kentucky |
146 |
127 |
15 |
4 |
|
Louisiana |
114 |
108 |
6 |
0 |
|
Maine |
26 |
22 |
4 |
0 |
|
Maryland |
43 |
38 |
2 |
3 |
|
Massachusetts |
112 |
92 |
17 |
3 |
|
Michigan |
87 |
72 |
12 |
3 |
|
Minnesota |
276 |
231 |
38 |
7 |
|
Mississippi |
68 |
65 |
3 |
0 |
|
Missouri |
247 |
201 |
35 |
11 |
|
Montana |
44 |
43 |
0 |
1 |
|
Nebraska |
154 |
133 |
19 |
2 |
|
Nevada |
16 |
16 |
0 |
0 |
|
New Hampshire |
16 |
13 |
3 |
0 |
|
New Jersey |
66 |
58 |
5 |
3 |
|
New Mexico |
35 |
33 |
1 |
1 |
|
New York |
130 |
107 |
16 |
7 |
|
North Carolina |
45 |
39 |
6 |
0 |
|
North Dakota |
73 |
64 |
8 |
1 |
|
Ohio |
173 |
148 |
20 |
5 |
|
Oklahoma |
197 |
170 |
19 |
8 |
|
Oregon |
15 |
15 |
0 |
0 |
|
Pennsylvania |
138 |
112 |
20 |
6 |
|
Puerto Rico |
3 |
3 |
0 |
0 |
|
Rhode Island |
7 |
6 |
1 |
0 |
|
South Carolina |
45 |
43 |
1 |
1 |
|
South Dakota |
59 |
52 |
6 |
1 |
|
Tennessee |
140 |
120 |
14 |
6 |
|
Texas |
416 |
375 |
35 |
6 |
|
Utah |
30 |
30 |
0 |
0 |
|
Vermont |
11 |
8 |
3 |
0 |
|
Virgin Islands |
1 |
0 |
1 |
0 |
|
Virginia |
65 |
63 |
2 |
0 |
|
Washington |
37 |
37 |
0 |
0 |
|
West Virginia |
50 |
46 |
3 |
1 |
|
Wisconsin |
186 |
168 |
17 |
1 |
|
Wyoming |
30 |
27 |
2 |
1 |
Source: Congressional Research Service calculations using data from the Federal Financial Institutions Examination Council, Bulk Data Download website, at https://cdr.ffiec.gov/public/PWS/DownloadBulkData.aspx, accessed on September 14, 2019.
Notes: List of bank names available to congressional clients by state upon request. Contact report author. One qualifying bank had null value in the "State" data field and has been omitted from this table.
To produce the statistics and estimates presented in this report, CRS used (1) information from the bank regulator Notice of Proposed Rulemaking: Regulatory Capital Rule: Capital Simplification for Qualifying Community Banking Organizations, published in the Federal Register on February 8, 2019;51 and (2) data from Consolidated Reports on Condition and Income as of June 30, 2019, which was downloaded from the Federal Financial Institution Examination Council bulk data download website on September 14, 2019.52
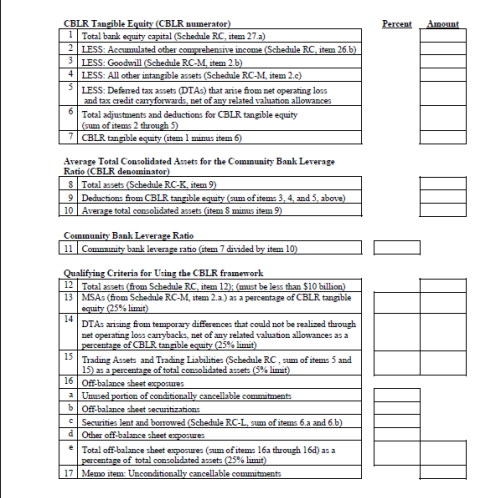
In the proposed rule notice, bank regulators provided this proposed format for reporting the CBLR, which indicates which measures the regulators were intending to use for qualifying criteria and to calculate the CBLR:
 |
|
Source: OCC, Fed, and FDIC, "Regulatory Capital Rule: Capital Simplification for Qualifying Community Banking Organizations," 84 Federal Register 3074, February 8, 2019. |
The estimates in this report may differ from the actual numbers due to two challenges with data availability.
First, exactly how deferred tax assets are counted in the proposals and what deductions from those figures would be permitted differ from the deferred tax asset values banks entered at call report Schedule RC-R, Part I, line 8. However, CRS was unable to locate the exact data identified in the proposal, and so used the deferred tax asset value available in the call report as a proxy. CRS judged that using this proxy was unlikely to cause the estimated bank counts and statistics presented in this report to differ substantively from the actual figures, because the vast majority of qualifying banks reported little or no deferred tax assets. Nevertheless, the difference could cause a bank near the 25% DTA-to-assets qualifying threshold to be erroneously classified as qualifying or nonqualifying. In addition, using this proxy could cause the CBLRs estimated for this report to be slightly different from certain banks' actual CBLRs.
Second, while CRS was able to locate values in the call report data for a number of off-balance-sheet exposures identified in the proposal, it was not able to locate others. The exposures included in the proposal are
the unused portions of commitments (except for unconditionally cancellable commitments); self-liquidating, trade-related contingent items that arise from the movement of goods, transaction-related contingent items (i.e., performance bond, bid bonds and warranties); sold credit protection in the form of guarantees and credit derivatives; credit enhancing representations and guarantees; off-balance sheet securitization exposures; letters of credit; forward agreements that are not derivatives contracts; and securities lending and borrowing transactions.53
CRS used the following values banks entered in call reports: (1) Schedule RC-L, lines 1a, 1b, 1c(1)-(2), 1d, and 1e as "unused portions of commitments"; (2) Schedule RC-R, Part II, line 19, Column A as "unconditionally cancellable commitments"; (3) Schedule RC-L lines 7a(1)-(4) Column A as "sold credit protection in the form of guarantees and credit derivatives"; (4) Schedule RC-R, Part II, line 10, Column A as "off balance sheet securitization exposures"; (5) Schedule RC-L line 2, 3, and 4 as "letters of credit"; and (6) Schedule RC-L, line 6a and 6b as "securities lending and borrowing transactions."
CRS was unable to locate values for (1) "trade self-liquidating, trade-related contingent items that arise from the movement of goods"; (2) "transaction-related contingent items"; (3) "credit enhancing representations and guarantees"; and (4) "forward agreements that are not derivatives contracts."
Thus, the CRS-calculated off-balance-sheet exposures used for this report are underestimates for banks that had any of the latter set of exposures. CRS judges that the number of banks that have these exposures and for which the underestimation is the difference between falling above or below the 25% off-balance-sheet exposures to total assets threshold is likely relatively small. Nevertheless, by omitting the latter set of exposures, the CRS estimate of qualifying banks may be an overcount.
To calculate the CBLRs, CRS used the following calculations and call report items (the item number is an identifying number assigned to each line item in the call report data set):
|
Variable |
Item number (see note for four-character prefixes) |
|
Identifying Qualified Banks |
|
|
Total assets: TA |
2170 |
|
Mortgage servicing assets: MSA |
3164 |
|
Deferred tax assets: DTA |
P843 |
|
Trading assets: TRDA |
3545 |
|
Trading liabilities: TRDL |
3548 |
|
Unused commitments: UNCM |
(3814 + 3815+ F164 + F165 + 6550 + 3817 + J457 +J458 + J459 + 3819 + 3821 + 3411) |
|
Unconditionally cancellable commitments: UNCC |
S540 |
|
Off-balance sheet securitizations: OSEC |
S495 |
|
Sold protection credit derivatives: CD |
(C968 + C970 + C972 + C974) |
|
Securities lent: SL |
3433 |
|
Securities borrowed: SB |
3432 |
|
=Qualified IF [(TA<$10bn) AND (MSA/TA<0.25) AND (DTA/TA<0.25) AND ((TRDA+TRDL)/TA<0.05) AND ((UNCM + OSEC + CD + SL+SB - UNCC)/TA)<0.25)] |
|
|
Calculating Community Bank Leverage Ratios |
|
|
Total bank equity capital: TE |
3210 |
|
Accumulated other comprehensive income: AOCI |
B530 |
|
Goodwill: G |
3163 |
|
All other intangible assets: AOIA |
JF76 |
|
Deferred tax assets: DTA |
P843 |
|
Four-quarter average total assets: ATA |
3368 |
|
Community Bank Leverage Ratio = [TE-(AOCI+G+AOIA+DTA)]/ [ATA-(G+AOIA+DTA)] |
|
Source: OCC, Fed, and FDIC, "Regulatory Capital Rule: Capital Simplification for Qualifying Community Banking Organizations," 84 Federal Register 3074, February 8, 2019; Federal Financial Institution Examination Council bulk data download website, at https://cdr.ffiec.gov/public/PWS/DownloadBulkData.aspx, on September 17, 2019; CRS calculations.
Notes: Prefix RCON- for Form 031 reporters and RCFD- for Form 041 reporters, except for deferred tax assets and existing capital ratios which have prefixes of RCOA- for 031 filers and RCFA- for 041 filers.