The global carbon cycle is the biogeochemical process by which the element carbon (C) moves in a balanced exchange between the atmosphere (i.e., air), terrestrial biosphere (i.e., land), ocean, and Earth's crust (i.e., rocks, fossil fuel deposits).1 Within those pools,2 carbon exists in different inorganic (i.e., nonliving, such as carbon dioxide) and organic (i.e., living, such as plant tissue) forms. When carbon moves out of one pool, it is recycled into one or more of the other pools; this movement is known as a flux. The flux of carbon into the atmosphere, particularly as the greenhouse gas (GHG) carbon dioxide (CO2), is the dominant contributor to the observed warming trend in global temperatures.3 Consequently, climate mitigation strategies have generally focused on both reducing emissions of GHGs into the atmosphere and removing more carbon out of the atmosphere.
Forests are a significant part of the global carbon cycle. The forest carbon cycle consists primarily of the movement of carbon between the atmosphere and the terrestrial biosphere. Trees and other plants convert atmospheric carbon (in the form of CO2) into terrestrial organic carbon, which is stored as biomass (e.g., vegetation).4 This process of carbon uptake and storage is referred to as sequestration. Trees also release (or emit) carbon back into the atmosphere. Over time, however, forests accumulate significant stores of carbon, both above and below ground. Thus, forest ecosystems uptake, store, cycle, and release carbon.5
Congressional debates over climate policy have often included ideas for optimizing carbon sequestration in forests as a potential mitigation strategy for global warming. To facilitate those debates, this report addresses basic questions concerning carbon sequestration in forests. The first section describes the carbon cycle in forests, with an overview of where carbon is stored and how carbon moves through the forest ecosystem. The second section provides a snapshot of data on carbon in U.S. forests and an overview of the methodologies used for estimating and reporting those measurements. The third section discusses some of the broad issues and challenges associated with managing forests for carbon optimization.
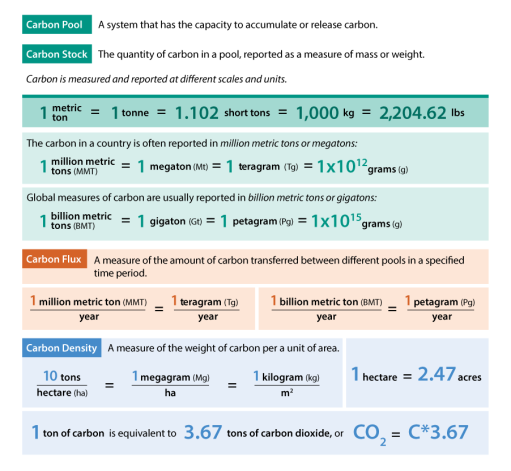
Figure 1 introduces some of the terms and units used for measuring and reporting carbon. In addition, the Appendix contains a more comprehensive glossary of relevant terms used throughout the report. An accompanying report, CRS Report R46313, U.S. Forest Carbon Data: In Brief, provides data on carbon in U.S. forests and will be maintained with annual updates.
 |
|
Source: CRS, adapted from Maria Janowiak et al., Considering Forest and Grassland Carbon in Land Management, U.S. Department of Agriculture (USDA) Forest Service, GTR-WO-95, June 2017, p. 4. Notes: Because much of the data for this report are based on international standards, this report uses the metric system for consistency purposes. Forest carbon stocks are reported as measures of carbon, whereas greenhouse gas emissions and removals (e.g., sequestration) are reported as measures of carbon dioxide or carbon dioxide equivalents (to facilitate comparisons with other greenhouse gases). As a chemical element, the mass of carbon (C) is based on its molecular weight. Carbon dioxide (CO2) is a compound consisting of one part carbon and two parts of the element oxygen (O). The conversion factor between C and CO2 is the ratio of their molecular weights. The molecular weight of carbon is 12 atomic mass units (amu), and the molecular weight of CO2 is 44 amu, which equals a ratio of 3.67. The same method is used to convert measurements of other greenhouse gases to carbon dioxide equivalents (CO2 eq.). |
The Forest Carbon Cycle
Forests are a significant part of the global carbon cycle, in that they contain the largest store of terrestrial carbon and are continuously cycling carbon between the terrestrial biosphere and the atmosphere.6 Through photosynthesis, trees use sunlight to sequester carbon from the atmosphere and accumulate organic carbon-based molecules in their plant tissue (i.e., leaves, flowers, stems, and roots) above and below ground. Trees also respire: they use oxygen to break down the molecules they created through photosynthesis, and in the process they emit CO2 to the atmosphere. The balance between photosynthesis and respiration varies daily and seasonally.7
Over time, individual trees and forests accrue significant stores of carbon. When trees die, the accumulated carbon is released, some into the soil (where it may be stored for millennia) and the rest into the atmosphere. This release can occur quickly, through combustion in a fire,8 or slowly, as fallen trees, leaves, and other detritus decompose. Some of the woody biomass from a tree may continue to store carbon for extended periods of time after death, due to long decomposition times or because it was removed (e.g., harvested) from the forest ecosystem and used, for example, in construction or in manufactured products. The carbon in harvested wood products eventually will be released, but the time scale varies considerably.
The amount of carbon sequestered in a forest is constantly changing with growth, death, and decomposition of vegetation. If the total amount of carbon released into the atmosphere is greater than the amount of carbon being sequestered in the forest, the forest is a net source of CO2 emissions. If the forest sequesters more carbon than it releases into the atmosphere, the forest is a net sink of CO2. Whether a given forest is a net source or sink, however, depends on the time and spatial scale (e.g., geographic boundaries) considered. Globally, forests are estimated to be a net carbon sink, with regional variations.9
The following sections describe in more detail where carbon is stored and how it moves in a forest ecosystem, as well as how ecological events and anthropogenic (i.e., human-caused) activities and changing land uses can influence the balance and cycle of carbon (e.g., the forest carbon budget).
Forest Carbon Pools: Where Carbon Is Stored in a Forest
In a forest ecosystem, carbon is stored both above and below ground and exists in living and nonliving forms. All parts of a tree—the leaves, limbs, stems, and roots—contain carbon. The proportion of carbon in each part varies, depending on the species and the individual specimen's age and growth pattern.
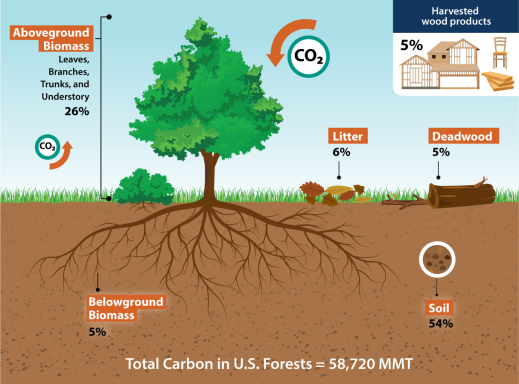
The U.S. Environmental Protection Agency (EPA)—consistent with international guidelines for measuring and accounting for carbon—reports forest carbon in seven different pools (see Figure 2).10 Five of these pools are part of the ecosystem pool:
- Aboveground biomass includes all living biomass above the soil, including stems, stumps, branches, bark, seeds, and foliage. Aboveground biomass also includes living understory plants.
- Belowground biomass includes all living root biomass of trees or understory plants, for roots thicker than two millimeters in diameter.11
- Deadwood includes all dead woody biomass either standing, down (i.e., lying on the ground), or in the soil.
- Forest floor litter includes leaves, needles, twigs, and all other dead biomass with a diameter less than 7.5 centimeters, lying on the ground. This includes small-sized dead biomass that is decomposed but has not yet become part of the soil.
- Soil carbon includes all carbon-based material in soil to a depth of one meter, including small roots. EPA divides this category further into mineral (based on rocks) and organic (based on decomposed organic matter) soils.
In addition to the ecosystem carbon pools, EPA includes two additional pools in measuring forest carbon, consisting of products made of harvested wood at different stages of use. The carbon in these pools was once forest ecosystem carbon, which was then transported out of the forest ecosystem. These pools are sometimes called the product pool or referred to as harvested wood products (HWPs):
- Harvested wood products in use, or products made from harvested wood (e.g., paper, beams, boards, poles, furniture, etc.) that are currently being used. Wood also may be harvested for energy purposes (e.g., wood chips, wood pellets, firewood, etc.).12
- Harvested wood products in solid waste disposal sites, or harvested wood products that are in a landfill or other waste disposal site, where they may eventually break down and release their stored carbon or remain intact for significant periods of time.
Carbon is stored within the different forest ecosystem and product pools at different time scales.13 A tree's life span tree can range from decades to thousands of years.14 Carbon in leaf litter may be released into the atmosphere or decay into soil within months or years, whereas carbon in bark or wood may remain for decades to centuries after the tree dies. Soil carbon may persist in the pool for years to millennia.15 Thus, the carbon turnover, or length of time carbon stays in each pool or the forest ecosystem broadly, varies for several reasons, such as the climate, hydrology, nutrient availability, and forest age and type, among others. The amount of carbon stored (e.g., carbon stock) in the different pools also varies.
 |
|
Source: CRS, using data for 2019 from EPA, Table 6-12 in Chapter 6, "Land Use, Land-Use Change, and Forestry," in U.S. National Greenhouse Gas Inventory, EPA 430-R-20-002, April 13, 2020. Notes: MMT = million metric tons. Percentages based on the total forest carbon stock estimate for 2019 (see Table 3). |
For various research or reporting purposes, the forest carbon pools are sometimes combined in different ways. In particular, the forest ecosystem pools are combined into categories such as aboveground versus belowground, or living and nonliving, or dead pools. This is especially useful when examining how various activities influence the flow of carbon between the ecosystem pools. In addition, some of the pools may be further categorized into smaller pools. For example, the aboveground biomass pool may be further classified into the amount of carbon stored in trees versus understory plants, or the amount of carbon stored in tree components (e.g., leaves, branches, and trunks). As another example, the deadwood pool may be further classified into standing dead and downed dead, in part to reflect the variation and relative importance of each in different forest types. See Table 1 for a crosswalk of terminology and classifications used in this report. However, these categories are not always comprehensive or mutually exclusive.
|
Standard Forest Ecosystem Pools |
Further Classification |
Live or Dead Biomassa |
Aboveground or Belowground |
|
Aboveground Biomass |
Trees: trees of at least 2.5 cm in diameter. This category may be further classified into tree components (e.g., leaves, branches, stems). Understory: all biomass of undergrowth plants in a forest, including woody shrubs and trees less than 2.5 cm in diameter. |
Live |
Aboveground |
|
Belowground Biomass |
Tree roots greater than 2 mm in thickness. Understory roots greater than 2 mm in thickness. |
Live |
Belowground |
|
Deadwood |
Standing dead: dead trees of at least 12.7 cm diameter that remain standing, including the associated root mass. Downed dead: pieces of deadwood greater than 7.5 cm in diameter that are not attached to live or standing dead trees; includes stumps and roots of harvested trees. |
Dead |
Both, but usually included in abovegroundb |
|
Litter |
Not further classified. |
Dead |
Both, but usually included in abovegroundb |
|
Soil Carbon |
Organic soils: any soil in which the layer made of organic materials is greater than 20 cm in thickness. Mineral soils: any soil in which the layer derived from organic materials is less than 20 cm in thickness and is therefore derived mostly from weathering of rocks. Mineral soils still contain components made from organic matter. |
Deadc |
Belowground |
Sources: Compiled by CRS, based on EPA, "Annex 3 – Part B: Methodological Descriptions for Additional Source or Sink Categories," in Inventory of U.S. Greenhouse Gas Emissions and Sinks, 1990-2018, EPA 430-R-20-002, April 13, 2020, and EPA, Chapter 6, "Land Use, Land Use Change, and Forestry," in Inventory of U.S. Greenhouse Gas Emissions and Sinks, 1990-2018 , EPA 430-R-20-002, April 13, 2020.
Notes: The table reflects only carbon in the forest ecosystem pools and does not include carbon in the forest product pool (e.g., harvested wood products). In some cases, the categories are not comprehensive or mutually exclusive.
a. Some may refer to dead biomass as nonliving biomass.
b. The carbon is stored mostly aboveground but does include some belowground carbon, such as dead roots. Current methods are unable to estimate the proportional distribution. For purposes of this report and unless otherwise specified, this is included in the aboveground pool.
c. Although soils contain carbon derived from both living and nonliving sources, they are not considered live biomass. To the extent soil carbon is included in such comparisons, it is generally included as part of the dead pool.
Global Forest Area and Carbon Distribution
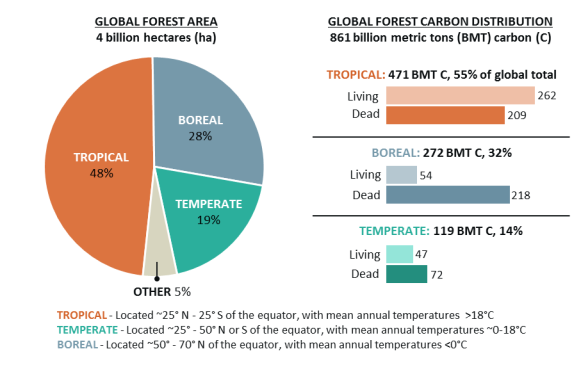
Because of variations in carbon turnover, climate, hydrology, and nutrient availability (among other factors), carbon sequestration and release vary substantially by forest. The proportion of carbon stored in the various pools varies by forest type (e.g., tree species) and age class. Nonetheless, some broad generalizations are possible because of the relative similarity of forests in specific biomes—tropical, temperate, and boreal forests (see Figure 3).16
Tropical forests represent around half the global forest area and store more than half the global forest carbon. The carbon in tropical forests is relatively evenly distributed between living and dead biomass, though more is contained in living biomass. Boreal forests represent around 29% of global forest area and store about one-third of the global forest carbon. Most of the carbon in boreal forests is in the belowground dead pools, particularly soil. Globally, temperate forests store the least amount of forest carbon and represent the smallest area, although most forests in the United States fall within the temperate zone. (Some of the forests in Alaska are in the boreal zone.) Carbon in temperate forests is also relatively evenly stored between the living and dead pools, but more is contained in the dead pools, also mostly in the soil. Because of where the carbon is stored in the different types of forest biomes, the drivers affecting the carbon balance in tropical, temperate, and boreal forests vary considerably.
|
Figure 3. Global Forest Area and Carbon Distribution, 2007 (by major forest biome) |
 |
|
Source: Data from Table S3 in the online supporting material for Yude Pan et al., "A Large and Persistent Carbon Sink in the World's Forests," Science, vol. 333, no. 6045 (August 19, 2011), pp. 989-993, at https://science.sciencemag.org/content/333/6045/988. Notes: Figures may not add due to rounding. Forest biomes also are defined by precipitation and vegetation type. The living pool includes carbon in living biomass. The dead pool includes carbon in deadwood, litter, and soil. More recent data on forest carbon estimates are available at different regional or national scales, but those estimates may not include estimates across the different forest pools. |
Forest Carbon Dynamics: How Carbon Moves Through a Forest
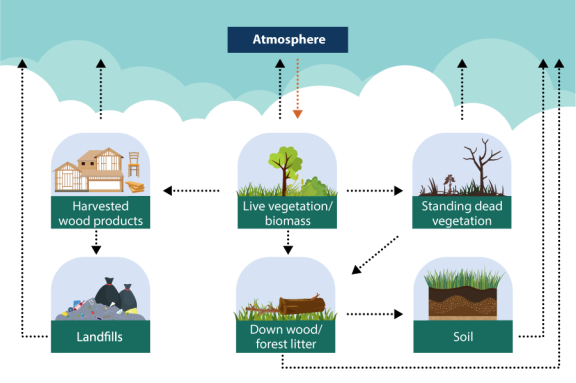
The essence of the forest carbon cycle is the sequestration and accumulation of atmospheric carbon with vegetative growth and the release of carbon back into the atmosphere when the vegetation dies and decomposes or during a wildfire.17 This section discusses how carbon flows between the atmosphere and the different forest carbon pools (see Figure 4) and some of the factors that affect the cycle.
 |
|
Source: CRS, adapted from Maria Janowiak et al., Considering Forest and Grassland Carbon in Land Management, USDA Forest Service, GTR-WO-95, June 2017, p. 4. Notes: This figure reflects a stylized diagram of the multiple pathways through which forest carbon flows, but it does not reflect the amount or time frame of the carbon exchange. Standing dead vegetation and down wood/forest litter are represented separately to illustrate the different pathways through which the carbon in aboveground biomass flows upon death. |
Carbon enters the forest ecosystem through photosynthesis and accumulates in living biomass both above and below ground. Carbon leaves the forest ecosystem and returns to the atmosphere through several processes: respiration, combustion, and decomposition. Respiration occurs from living biomass both above and below ground (where it is known as soil respiration). Combustion (e.g., fire) immediately releases carbon from living and dead pools.18 Decomposition occurs after the tree dies and slowly releases carbon to both the atmosphere and the soil. Decomposition rates are influenced by several factors (e.g., precipitation, temperature), and trees may remain standing for several years after death before falling to the ground and continuing to decay.
In addition, human activities facilitate the flux of carbon out of the forest ecosystem. For example, timber harvests remove carbon from the forest ecosystem (and move it into the product pool). This carbon remains stored in the harvested product while the product is in use, but it will eventually return to the atmosphere in most cases. The delay between harvest and release could be relatively instantaneous if the wood is used for energy, for example, or the delay could be more than a century if the wood is used for construction and then disposed in a landfill, where it could take several decades to even partially decompose.
The difference between carbon sequestration and release (e.g., emissions) determines if a forest is a net source of carbon into the atmosphere or a net sink absorbing carbon out of the atmosphere. Forest ecosystems are dynamic, however, and the balance of carbon pools and carbon flow varies over different time and spatial scales. These forest carbon dynamics are driven in large part by disturbances to the forest ecosystem.19
- Anthropogenic disturbances are planned activities, such as timber harvests, prescribed wildland fires, or planned land-use conversion.
- Ecological disturbances are unplanned and include weather events (e.g., hurricanes, ice storms, droughts), insect and disease infestations, and naturally occurring wildfires. Ecological disturbances are a natural part of forest ecosystems, though anthropogenic factors may influence their severity and duration.
The type, duration, and severity of the disturbance contribute to the extent of its impact on carbon cycling.20 Most disturbances result in some levels of tree mortality and associated carbon fluxes. Disturbances may have additional impacts if the land cover changes. Post-disturbance, forests will often regenerate with trees (e.g., reforestation) or other vegetation. In this case, the disturbance influences carbon fluxes and stocks in the short to medium term. If the land changes from forest to grassland, or if the area is intentionally developed for agricultural production or human use (e.g., houses), then the effects on the forest carbon cycle are more permanent (e.g., deforestation).
The following sections explore the forest carbon dynamics related to both anthropogenic and ecological disturbances and land-use changes in more detail.
Disturbances
Generally, disturbances result in tree mortality and thus transfer carbon from the living pools to the dead pools and eventually to the atmosphere. The impacts to the forest carbon budget, however, occur over different temporal and spatial scales.
For example, the onset of a disturbance's effects may be immediate (e.g., through combustion) or delayed (e.g., through decomposition). Regardless, since there is less living vegetation, the rate of photosynthesis decreases and reduces the amount of carbon sequestered on-site. At the same time, more carbon is released into the atmosphere as the dead vegetation decays. Because of this, many forests may be net sources of carbon emissions in the initial period after a disturbance. Over time, however, the carbon impacts from most disturbances will begin to reverse as the forest regenerates and gradually replaces the carbon stocks (e.g., the amount of carbon in a pool). The lagging recovery and associated increase in carbon uptake and storage are sometimes referred to as legacy effects. Forest carbon stocks in the United States, for example, have been increasing related in part to legacy effects from past disturbances (e.g., harvests).21 In other words, "a sizeable portion of today's sequestration is compensating for losses from yesterday's disturbances."22
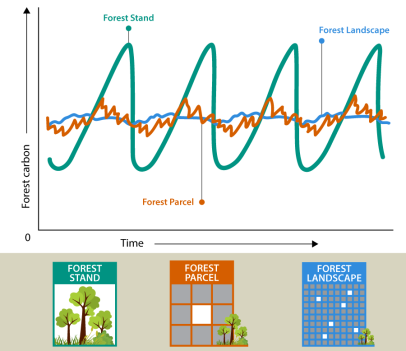
Forest carbon dynamics are also influenced by disturbances over different spatial scales. Disturbances generally occur at the stand level (i.e., a group of trees) within a forest,23 but they rarely occur across an entire forest at the same time.24 For example, a wildfire may result in significant mortality in one stand, moderate mortality in another stand, and no mortality in a third stand, all within the same forest. That same wildfire may not burn across other areas within the same forest at all. This means that at any given time, different stands within a forest may be in various stages of post-disturbance recovery.
Because disturbance effects vary both temporally and spatially, they can be in relative balance. This means that forest carbon stocks are generally stable over large areas and over long time scales, assuming the sites are reforested (see Figure 5).25 A shift in the overall pattern of disturbance events, however, could have long-term impacts to forest carbon dynamics. Disturbances are generally increasing in frequency and severity throughout the United States. (with regional variations).26 For example, a pattern of increasing frequency and severity of disturbances could result in lower sequestration rates and less forest carbon stocks over time. This is in part because disturbance events can interact and compound with each other. For example, drought can make trees more susceptible to insect or disease infestations or to sustaining greater damage during a wildfire. After a wildfire, drought may prevent or delay regeneration. These interactions would then have associated impacts to the forest carbon cycle.
In the United States, disturbances account for the loss of about 1% of the carbon stock from the aboveground biomass pool annually.27 However, timber harvests account for the majority of that change, meaning that some of this "loss" enters the product pool. Wildfire, wind or ice storms, bark beetles, drought, and other disturbances account for the remainder of the loss. However, little research exists on the carbon-related impacts of insect and disease infestations generally or on the impacts of specific insects other than bark beetles. In addition, the effects of disturbances on other carbon pools—soil carbon in particular—are not well understood. Thus, the current understanding may not accurately estimate the degree of these impacts.
The following sections discuss the specific carbon-related effects and issues associated with several types of disturbances, listed in order of decreasing impacts to the forest carbon budget.
Timber Harvests
Timber harvests are a planned management activity, and as such they represent an anthropogenic disturbance. Timber harvests result in the direct transfer of carbon from the aboveground, living biomass pool to other pools. Although some carbon remains on-site as deadwood or litter, a portion of the carbon is removed from the forest ecosystem entirely and becomes part of the product pool. Carbon in the product pool eventually will be released, but the lifecycle varies considerably based on end-use and disposal methods. The carbon that remains on-site as deadwood or litter will decompose and eventually be released into the atmosphere (and some may be absorbed into the soil). In addition, timber harvests have the potential to degrade or damage soils, which also could release carbon into the atmosphere.
End-uses of harvested wood products include lumber, paper, panels, and wood used for energy purposes. Energy is derived from wood through combustion, so the carbon in that product pool is released almost immediately.28 In contrast, lumber used for housing construction may remain in use for nearly a century before being discarded.29 In some areas, wood products are incinerated upon disposal, releasing the stored carbon into the atmosphere. In the United States, however, most wood products are discarded in solid waste disposal sites (e.g., landfills). In those environments, paper products may take several years and wood products may take several decades to decompose and release the stored carbon into the atmosphere. In some cases, products may decompose only partially, so some carbon may persist in discarded wood products indefinitely. The flux of carbon into the product pool does not consider any emissions related to the harvesting process or the transporting of the wood product.
Wildfires
Although most wildfires are unplanned ecological disturbances, some may occur as a planned forest management activity (e.g., prescribed fire).30 Wildfires result in the immediate release of some carbon dioxide—and other GHGs—through combustion.31 There is also a transfer of carbon from living to dead pools, where carbon continues to be released over time (or some may be absorbed into the soil). The severity of the fire influences the extent of tree mortality and has implications for the timing and type of post-fire recovery.32 For example, forest regeneration may take longer if the soil damage is severe. More wildfires occur in the eastern United States (including the central states), but the wildfires in the West are larger and burn more acreage.33 Although wildfire activity varies widely in scale and severity, wildfires have been increasing in frequency and size, particularly in the western United States.34
Other Disturbances: Insect and Disease Infestations, Wind, Drought
Other ecological disturbances, such as insect and disease infestations, wind events, and droughts, have similar effects on forest carbon dynamics: transferring carbon from the live pools to the dead pools and releasing the carbon into the atmosphere over time.
The carbon effects from insect and diseases vary considerably, depending on the type of infestation. Some infestations result in widespread tree mortality, similar to other disturbance events. In cases when the infestation is species- or site-specific, the forest may regenerate with a different species mix, altering the forest composition and carbon storage potential. Other infestations, however, may primarily result in defoliation (e.g., loss of leaves). Defoliation increases the amount of forest litter and reduces the rate of carbon uptake but does not necessarily result in a large loss of forest carbon stocks. Indirectly, defoliation may weaken trees and make them more susceptible to impacts from other disturbances. Little research is available on the carbon-related effects of insect and disease infestations generally or on the impacts of specific insects other than bark beetles, so the current understanding may not accurately estimate the degree of this impact.
A hurricane or other wind event may uproot, knock over, or break trees (e.g., windthrow or blowdown) increasing the amount of deadwood and forest litter, which could then hasten the spread of a wildfire.35 These impacts may occur across individual trees or across significantly larger areas. Ice storms have similar effects. Although the carbon cycling effects of a single event may be significant, there is considerable annual variability and the net effect usually is mitigated over time as the site regenerates.36
Droughts are prolonged events with direct and indirect effects on forest carbon. Droughts can weaken individual trees, reducing carbon uptake, and can lead to tree mortality. Droughts also can prolong regeneration and/or facilitate the shift to a different species mix. Indirectly, weakened trees may be more susceptible to damage or death from other disturbance events. In this way, droughts can enhance or exacerbate other disturbance events.
Land-Use Change
What happens to a site after a disturbance influences the longer-term effect of that disturbance on the global carbon cycle. Reforestation occurs if the site regenerates with trees (naturally or through manual seeding or planting). In this case, the effects on the carbon cycle would be generally mitigated over time. If the site converts to a different land cover or land use, however, more significant and longer-term impacts to the carbon cycle may occur.37 Land-use changes may occur with or without a separate precipitating disturbance event or, in the case of planned land-use changes, may be the disturbance event.
Deforestation occurs when the site converts to a non-forest use; it generally results in the loss of significant amounts of carbon at one time. In most cases, deforestation means the sudden removal of all aboveground carbon, followed by a more gradual loss of belowground carbon. Deforestation also results in the loss of carbon sequestration potential.38 Deforestation frequently occurs through deliberate human intervention (e.g., to clear the land for development or agricultural purposes). However, deforestation also may occur without human intervention, most commonly when grasses or shrubs populate a post-fire site and prohibit the succession of tree species.
Afforestation is the conversion of non-forestland to forestland. It results in the potential for new or increased ecosystem carbon storage and sequestration. Afforestation may occur through deliberate human intervention (e.g., planting, irrigation, fertilization) or through natural ecological succession, as trees begin to grow or encroach into grasslands and rangelands.39 Afforestation is most successful on sites that were previously forested. In the United States, for example, afforestation frequently occurs on abandoned cropland that had been forested prior to clearing.40
Globally, forest area generally has been declining since the 1990s.41 The rate of decline, however, has slowed in recent years, and there is considerable regional variation. Most of the net loss is occurring in tropical forests, whereas most of the net gains have been in temperate forests. In the United States, for example, forest area had been expanding for several decades and now is remaining steady, with variation at the region and state levels.42 This trend is generally a result of net afforestation, after accounting for some deforestation (~0.12% per year) and reforestation.43 In 2018, however, slightly more land converted out of forest use (1.29 million hectares) than converted to forest use (1.27 million hectares) in the United States.44 In general, most deforestation in the United States is the result of development or conversion to grassland.45 Conversely, however, more grassland converts to forestland annually and is the largest contributor to afforestation in the United States.
U.S. Forest Carbon Data
The following sections provide data on the annual amount of carbon stored in U.S. forest pools (e.g., carbon stocks) and the net amount of carbon that flows in or out of U.S. forests annually (e.g., carbon flux). First, however, is a brief discussion of the methodology used to estimate and measure forest carbon. The data are primarily derived from EPA's annual Inventory of U.S. Greenhouse Gas Emissions and Sinks (Inventory) for 2020.46
For purposes of this report, the data are intended only to provide context and complement the understanding of carbon dynamics in U.S. forests generally. As such, the data in this report will not be updated in accordance with the publication of the annual Inventory. Rather, an accompanying report, CRS Report R46313, U.S. Forest Carbon Data: In Brief, will be updated to reflect the annual data published in the Inventory and other sources. Because the methodologies used to estimate carbon measurements are constantly being refined, future iterations of the Inventory may result in different stock and flux estimates for the years discussed in this report.
Forest Carbon Accounting Methods
This section describes the forest carbon accounting methodology specific to EPA's annual Inventory. EPA has been publishing the annual Inventory since the early 1990s. Among other purposes, the Inventory fulfills the reporting commitments required of the United States as a signatory to the United Nations Framework Convention on Climate Change. As such, these methods are in accordance with the standards established by the International Panel on Climate Change (IPCC), which is the United Nations body responsible for assessing the science related to climate change.47 Federal agencies, including those within the U.S. Department of Agriculture (USDA), contribute data and analysis to the Inventory. Specifically, much of the data on forests and forest carbon is based on methodologies developed and data collected by the Forest Inventory and Analysis (FIA) Program administered by the USDA Forest Service (FS).48
As the following sections describe, the forest carbon figures reported in the Inventory are derived from estimates of forestland area and carbon stocks. Carbon flux is then measured by comparing changes in forest carbon stocks over time.
|
Methodological Uncertainties EPA's annual Inventory of U.S. Greenhouse Gas Emissions and Sinks (Inventory) reflects estimates, not precise measurements, of the amount of carbon and the extent of U.S. forestland area. There is some degree of uncertainty at each step of the sampling, measurement, and modeling processes. Some of the forest carbon pools are sampled less regularly than others, and some geographic areas, land-use types, or data points are not regularly sampled. For example, interior Alaska has only been inventoried since 2014, and there are fewer sample plots with fewer years of data than other states. However, interior Alaska represents 20% of the forestland in the United States. This means that imprecise measurements for interior Alaska may be more consequential than other missing areas. The data collection, conversion factors, and modeling methods, however, are continuously refined and incorporated into the Inventory as applicable. In some cases, this process may result in updated estimates across the time series (which extends back to 1990). This means that in any given publication year of the Inventory, previous years' data are recalculated using up-to-date methods to provide a consistent time series of data. For example, new land-use data were incorporated into the 2020 Inventory and resulted in updated managed forestland, carbon stock, and carbon flux estimates across the time series relative to the 2019 Inventory. Because of this, future iterations of the Inventory may result in different stock and flux estimates for the years discussed in this report. |
Estimating Forestland Area
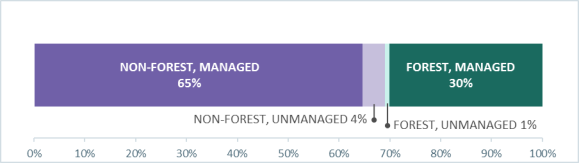
The Inventory measures the net greenhouse gas flux associated with all land uses and types in the United States, in the Land Use, Land-Use Change, and Forestry (LULUCF) sector (see Figure 6). In addition to forestland, LULUCF includes the carbon flux associated with existing agricultural lands, grasslands, wetlands, and developed areas (referred to as settlements). The Inventory also captures the carbon flux associated with changes in land uses, such as grasslands converting to forestland (e.g., afforestation). These converted lands are reflected in the "converted" LULUCF category for 20 years, after which they are counted with the existing LULUCF land-use categories. Forests represent about one-third of the area included in the sector (see Figure 6), but they generally contain the most carbon stocks and are responsible for most of the carbon sink associated with the sector. This report focuses only on carbon stocks and fluxes associated with forestland.49
For the Inventory, forestland includes "land at least 120 feet wide and at least 1 acre (0.4 hectares) in size with at least 10 percent cover (or equivalent stocking) by live trees including land that formerly had such tree cover and that will be naturally or artificially regenerated."50 This definition does not include forested areas completely surrounded by urban or developed lands, which are classified as settlements.51 This definition also does not include woodlands, which are included in the grassland category.52
The Inventory reflects lands that are considered managed, (i.e., direct human intervention has influenced their condition). In contrast, unmanaged land is composed largely of areas inaccessible to society; the carbon associated with those lands is not reflected in the Inventory. For the United States, managed forests are those that are designated for timber harvests and/or with active fire protection, which includes all forestland within the conterminous U.S. and significant portions of forestland in Alaska. As of 2020, the Inventory did not include forestland in Hawaii and the U.S. territories as part of the carbon stock and flux estimates, although Hawaii forestland was included in some estimates of forestland use. Land area estimates are derived from a combination of FIA data and other sources.53 See Figure 6 and Table 3.
|
Land-Use Category |
1990 |
2018 |
|
Forestland Remaining Forestland (FRF) |
280.4 |
280.3 |
|
Land Converted to Forestland (LCF) |
1.2 |
1.3 |
|
Forestland Converted to Other Land Uses |
-1.2 |
-1.3 |
|
Total Managed Forest Area |
281.6 |
281.5 |
Source: Data from EPA, Tables 6-6 and 6-7 in Chapter 6, "Land Use, Land-Use Change, and Forestry," in U.S. National Greenhouse Gas Inventory, April 13, 2020.
Notes: Data do not include land in the U.S. territories, which are estimated to contain around 483,000 hectares of total forest area.
The Inventory reports carbon stocks for total managed forest area, but it accounts for carbon flux across two different categories: Forestland Remaining Forestland (FRF) and Land Converted to Forestland (LCF). FRF captures the carbon flux associated with existing forestland or forests that have been forestland for at least 20 years. LCF captures the carbon flux associated with land that has been converted to forestland within the past 20 years. In other words, this category captures the carbon flows associated with afforestation. Land area data on forestland converted to other uses (e.g., deforestation), such as grassland, settlements (e.g., development), and agriculture uses, are captured in the respective new land-use category as reported in the LULUCF sector.
Estimating Forest Carbon Stocks and Fluxes
To generate estimates of the carbon stocks in the Inventory, estimates of forestland area are combined with site-specific estimates of forest carbon. These estimates are based primarily on the data collected through the FS's FIA Program, its continuous census of the U.S. forests.54 The FIA uses remote sensing data and field data collected from a series of permanently established research sites (called plots), which cover most forested lands of the United States.55 Field data include a variety of tree measurements, such as height and species. Additional measurements of downed deadwood, litter, and soil variables are taken on a subset of plots. The data are collected through a three-stage, systematic sample, as follows:
- 1. FS uses remotely sensed data to classify land cover as forest or non-forest and chooses a systematic sample of forested plots for field data collection.
- 2. FS collects field data at one forest plot for every 6,000 acres. The data include forest type, tree species, size, and condition. It also collects site attributes, such as slope and elevation.
- 3. FS collects a broad suite of forest health data from a subset of Phase 2 plots, such as understory vegetation, deadwood, woody debris, soil attributes, and others.56
The data are collected through an annualized sampling process in which a representative sample of plots in each state is surveyed at regular intervals, with the goal of each plot being sampled every 5 to 10 years.57
After field collection, FS applies mathematical conversion factors or models to calculate carbon content for each ecosystem pool.58 The conversion factors and models generally are species-specific and based on other research or internationally accepted methodologies based on peer-reviewed research. They relate data that are easily collected to data that are difficult (or impossible) to collect in the field. For example, FS calculates aboveground carbon by using species-specific equations that give aboveground carbon estimates from simple field data, such as tree height and diameter.59 It uses similar principles to derive estimates of carbon in belowground biomass, soils, litter, and deadwood. For the Inventory, the site-specific FIA data are scaled up to derive state and national forest carbon estimates using measures of forestland area.
Carbon in the product pool, or in harvested wood products (HWPs), is calculated according to a mathematical model with conversion factors for several variables.60 These variables include the amount of carbon in various HWPs, the length of time HWPs remain in active use, and how long it takes for HWPs to decompose and release carbon based on the method of disposal. Other variables account for how many HWPs are imported and exported out of the United States annually, with adjustments for the associated carbon estimates.
The Inventory reports annual GHG emissions (i.e., sources) and removals (i.e., sinks), expressed in terms of CO2 equivalents, aggregated to millions of metric tons (MMT CO2 eq.). CO2 equivalents convert an amount of another GHG to the amount of CO2 that could have a similar impact on global temperature over a specific duration (100 years in the Inventory). This common measurement can help to compare the magnitudes of various GHG sources and sinks. See Figure 1 for information on calculating CO2 equivalents.
The Inventory measures net flux by comparing the annual difference in forest carbon stocks for existing forestlands as well as carbon sequestered as land converts to forestland. Specifically, net carbon flux is estimated by subtracting carbon stock estimates in consecutive years. Comparing the annual difference in carbon stocks reflects any carbon stock changes associated with disturbances, although it does not attribute any changes to specific disturbance events. The net effect of disturbances are reflected in the different total carbon stocks measures and in how the distribution of carbon between the stocks changes annually. For example, a timber harvest removes carbon from the forest ecosystem and transfers some carbon from the living pools to the dead and product pools. Annual estimates of carbon stock changes would reflect the loss of carbon from the aboveground biomass pool and transfer to the deadwood, litter, and product pools. The Inventory also reports emissions of other GHGs, particularly those associated with wildfires, fertilizer application, and other soil emissions (all accounted for in CO2 equivalents).61
U.S. Forest Carbon Stocks
According to the Inventory, U.S. forests stored 58.7 billion metric tons (BMT) of carbon in 2019 (see Table 3 and Figure 7 for data from 1990, 2000, 2010, and 2019).62 The majority of forest carbon was stored in the forest ecosystem pools (95%); the remainder was stored in the product pool (e.g., HWP). The largest pool of carbon was forest soils, which contained approximately 54% of total forest carbon in 2019. The next-largest pool was aboveground biomass, which contained approximately 26% of total. Each of the other pools stored less than 6% of the total carbon.
|
Carbon Pool |
1990 |
2000 |
2010 |
2019 |
|
|
MMT C |
% of Total |
||||
|
Forest Ecosystem |
51,527 |
53,161 |
54,663 |
56,051 |
95% |
|
Aboveground Biomass |
11,833 |
12,962 |
14,020 |
14,989 |
26% |
|
Belowground Biomass |
2,350 |
2,612 |
2,858 |
3,081 |
5% |
|
Deadwood |
2,120 |
2,346 |
2,568 |
2,777 |
5% |
|
Litter |
3,662 |
3,676 |
3,646 |
3,641 |
6% |
|
Soil |
31,563 |
31,565 |
31,570 |
31,564 |
54% |
|
Harvested Wood Products (HWP) |
1,895 |
2,218 |
2,462 |
2,669 |
5% |
|
HWP in Use |
1,249 |
1,395 |
1,471 |
1,521 |
3% |
|
HWP in Disposal |
646 |
823 |
991 |
1,148 |
2% |
|
Total Carbon Stock |
53,423 |
55,380 |
57,124 |
58,720 |
100% |
Sources: Data for 2019 from EPA, Table 6-12 in Chapter 6, "Land Use, Land-Use Change, and Forestry," in U.S. National Greenhouse Gas Inventory, April 13, 2020. Data for all other years from EPA, Table A-230 in Annex 3 Part B: "Methodological Descriptions for Additional Source or Sink Categories," in U.S. National Greenhouse Gas Inventory, April 13, 2020.
Notes: Data reflect carbon stocks for managed forestland remaining forestland in Alaska and the conterminous 48 states and do not include Hawaii or the U.S. territories. The years 1990, 2000, and 2010 were selected to show the trend in carbon stocks over time; 2019 is the most recent year data are available. Columns may not add due to rounding.
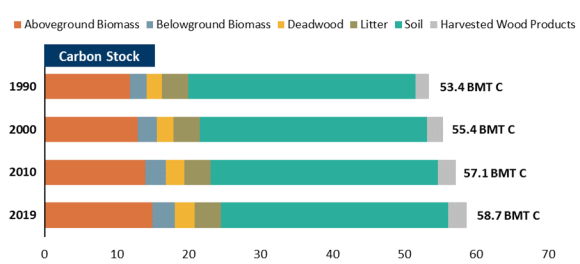
Since 1990, U.S. forest carbon stocks have increased 10%. Nearly all forest pools have gained more carbon as of 2019. The exceptions are the litter and soil pools, which each continue to store around the same amount of carbon as they did in previous years. Forest carbon stocks have increased annually, meaning U.S. forests have been a net carbon sink, absorbing more carbon out of the atmosphere than they release (carbon flux data are discussed in the "Carbon Emissions and Sinks from U.S. Forests" section below).
Regional Variations
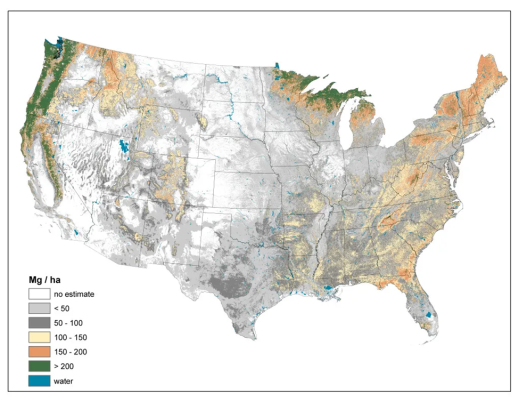
About one-third of the United States is forested.63 These forested areas vary considerably by location, climate, vegetation type, and disturbance histories, among other factors. Because of this variation, U.S. forests contain varying amounts of carbon, stored in varying proportions across the different forest pools. See Figure 8 for an example of how carbon density, or the amount of carbon within a certain area, varies across the 48 conterminous states.
Excluding Alaska, the forests in the Pacific Northwest and Great Lakes regions contain the highest carbon density.64 The distribution of the carbon across different pools differs between those two regions, however. In the Pacific Northwest and along the West Coast generally, most of the carbon is stored in the living biomass pools; in the Great Lakes region, most of the carbon is stored in the soil. Forests in New England, the Great Plains, and along the Southeastern Coast also store most of their carbon in soil, whereas the forests along the Appalachian Mountains store most of their carbon in live biomass. In some areas of the Rocky Mountains, most of the carbon is stored in live biomass; in other areas of the Rocky Mountains, most of the carbon is stored in the deadwood and litter pools.
The carbon balance and dynamics in Alaska are not as comprehensively inventoried as those in other states in the conterminous United States. However, Alaska is estimated to contain significant carbon stocks, with the vast majority in the soil.65 Alaska includes multiple biomes: temperate forests along the southeast coast, boreal forests in the state's interior, and areas of tundra in the north.
Carbon Emissions and Sinks from U.S. Forests
Carbon flux is the annual change in carbon stocks. The flux estimate for any given year (e.g., 2018) is the change between stock estimates for that year (2018) and the following year (2019). Negative values indicate more carbon was sequestered than was released in that year (e.g., net carbon sink); positive values indicate more carbon was released than was sequestered in that year (e.g., net carbon source).
According to the Inventory, U.S. forests were a net carbon sink in 2018, having sequestered 774 MMT CO2 equivalents (or 211 MMT of C) that year (see Table 4 and Figure 9 for flux data from 1990, 2001, 2010, and 2018).66 This represents an offset of approximately 12% of the gross GHG emissions from the United States in 2018.67
The net sink reflects carbon accumulation on existing forestland and carbon accumulation associated with land converted to forestland within the past 20 years, though most of the sink is associated with existing forests (86%). Within the carbon pools, most of the flux is associated with aboveground biomass (58%). The carbon flux into the living biomass pools (above and below ground) reflects net carbon accumulation from the atmosphere; the carbon flux into the other pools represents the net of the flux of carbon from the living biomass pools into the dead pools relative to the flux of carbon out of those pools. Although soils store significant amounts of carbon, the carbon accumulates slowly over long periods, so the annual flux is minimal. In some years, soils are a net source of carbon to the atmosphere.
Overall, the annual net flux of carbon into U.S. forests is small relative to the amount of carbon they store. For example, U.S. forests gained an additional 211 MMT of carbon between 2018 and 2019, but that represents only a 0.3% increase to the total forest carbon stock (58.7 BMT of carbon). In addition, the total stock of carbon stored in forests is equivalent to the sum of several decades of U.S. GHG emissions.68
Table 4. U.S. Forest Carbon Flux by Pool
(million metric tons [MMT] per year, in both carbon dioxide equivalents [CO2 eq.] and carbon [C])
|
Carbon Pool |
1990 |
2001 |
2010 |
2018 |
||||
|
CO2 eq. |
C |
CO2 eq. |
C |
CO2 eq. |
C |
CO2 eq. |
C |
|
|
Forest Ecosystem |
-720 |
-196 |
-653 |
-178 |
-666 |
-182 |
-675 |
-184 |
|
Aboveground Biomass |
-486 |
-132 |
-444 |
-121 |
-452 |
-123 |
-446 |
-122 |
|
Belowground Biomass |
-110 |
-30 |
-102 |
-28 |
-102 |
-28 |
-101 |
-27 |
|
Deadwood |
-95 |
-26 |
-94 |
-26 |
-97 |
-26 |
-100 |
-27 |
|
Litter |
-28 |
-8 |
-12 |
-3 |
-25 |
-7 |
-26 |
-7 |
|
Soil |
-0.3 |
-0.1 |
-2 |
-0.5 |
9 |
3 |
-2 |
-0.6 |
|
Harvested Wood Products (HWP) |
-124 |
-34 |
-98 |
-27 |
-69 |
-19 |
-99 |
-27 |
|
HWP in Use |
-55 |
-15 |
-35 |
-10 |
-7 |
-2 |
-32 |
-9 |
|
HWP in Disposal |
-69 |
-19 |
-63 |
-17 |
-62 |
-17 |
-67 |
-18 |
|
Total Carbon Flux |
-843 |
-230 |
-751 |
-205 |
-736 |
-201 |
-774 |
-211 |
Sources: Data for 2018 from EPA, Tables 6-10, 6-11, 6-26, and 6-27 in Chapter 6, "Land Use, Land-Use Change, and Forestry," in U.S. National Greenhouse Gas Inventory, April 13, 2020. Data for all other years from EPA, Table A-230 in Annex 3 Part B: "Methodological Descriptions for Additional Source or Sink Categories," in U.S. National Greenhouse Gas Inventory, April 13, 2020.
Notes: Negative values indicate more carbon was sequestered than was released in that year (e.g., carbon sink); positive values indicate more carbon was released than was sequestered in that year (e.g., carbon source). Data reported to the tenths only for values between -1 and 1. Data reflect flux estimates for forestland remaining forestland and land converted to forestland (forest ecosystem pools only) for managed forestland in Alaska and the conterminous 48 states and do not include Hawaii or the U.S. territories. The years 1990, 2001, and 2010 were selected to show the trend in carbon stocks over time and based on data availability; 2018 is the most recent year data are available. Columns may not add due to rounding.
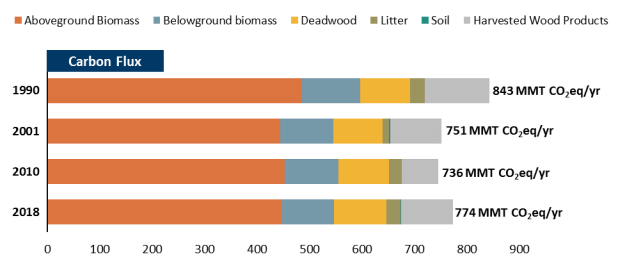
Over the time series (1990 to 2018, U.S. forests have been a net carbon sink. However, the net amount of carbon sequestered by U.S. forests varies annually, depending in large part on disturbance activity and location in any given year. For example, wildfire activity in Alaska drives a significant portion of the interannual variability. This is due in part to fluctuations in the size of the area affected by wildfire each year and because more of the carbon in Alaska is stored in pools that are likely to be combusted in a fire (e.g., litter) as compared to other states.69
Although the Inventory reflects the net carbon flux associated with forest disturbances through annual changes in the carbon stock, recent iterations of the Inventory also have included the estimated emissions specifically associated with wildfires. The Inventory reports that wildfires, including prescribed fires, resulted in emissions of 170 MMT CO2 equivalents in 2017, the most recent year available.70 Annual forest carbon emissions vary significantly, because wildfire activity varies annually. For example, the Inventory reports that wildfire-related emissions in the previous year (2016) were significantly lower: 51 MMT CO2 equivalents.
Considerations for Forest Carbon Management
This section discusses policy issues related to managing forest carbon. Forests are generally managed for multiple reasons, often simultaneously. For example, the Forest Service manages the National Forest System under a congressional mandate to provide sustained yields of multiple uses, some of which may compete and require tradeoffs.71 In many cases, optimizing carbon sequestration and storage could be one of many forest management objectives.72
There are three primary strategic approaches for optimizing forest carbon sequestration and storage: (1) maintain or increase the area of forestland, (2) maintain or increase forest carbon stocks, and (3) increase the use of wood products.73 The applicability of each approach will vary depending on existing site characteristics and land management objectives. In addition, each of these approaches comes with varying levels of uncertainty related to effectiveness, potential for co-benefits, and tradeoffs.74
- Maintain or increase forestland area. This approach involves avoiding and reducing deforestation and maintaining or increasing afforestation. (This approach also could include increasing tree cover in urban areas, although the overall carbon benefits would be uncertain and likely highly variable based on site-specific characteristics.)75 Increasing forest area could provide a range of co-benefits (e.g., watershed protection, wildlife habitat), but in some cases it also could require substantial resources (e.g., fertilization, irrigation). In addition, increasing forest area could require economic tradeoffs, such as income loss from reduced agricultural production in areas of increased afforestation, for example.76
- Maintain or increase forest carbon stocks. This approach involves managing forests to maximize tree growth potential, rehabilitating degraded forests, or otherwise mitigating potential carbon losses. This could involve activities such as extending the time between timber harvests and/or implementing harvesting methods to increase the protection of remaining trees and soils. This also could include restoring degraded forests whose biomass and soil carbon densities are less than their maximum potential value. Forest restoration could have additional benefits in terms of improving forest resilience to and recovery from ecological disturbances (e.g., mitigating the risk of catastrophic wildfires). These activities all could require substantial resources (e.g., forest thinning, fertilization, irrigation) and economic tradeoffs (e.g., loss of timber-related income).
- Increase use of wood products. To have net impacts on the carbon balance, this approach requires substituting wood products as an alternative to materials that are more carbon intensive to produce (e.g., steel) or using wood as a substitute for fossil fuel. In some cases, these measures could require significant technological advances. Generally, a full lifecycle accounting of both products likely would be necessary to determine whether the use of wood generates net carbon benefits. Increasing the use of wood products could result in increased economic activity that incentivizes wood product innovation. It also could result in forest management activities that reduce overall carbon storage potential (e.g., increasing, rather than decreasing, harvest cycles).
The above strategies share certain implementation issues and challenges. One of the most fundamental challenges is determining whether an activity actually results in a net carbon benefit, which depends largely on the time and spatial scale of analysis.77 Any approach will encounter issues related to:
- Permanence. In this context, permanence means the extent the activities are reversible. For example, is there potential for a new landowner to reverse previous management decisions and to nullify or reverse the carbon benefits of these practices? This is especially an issue for private lands, which may change ownership status more frequently than public lands and forests. Ecological factors, such as a site's ability to recover post-disturbance, also may influence permanence.
- Leakage. The potential for changes in land management in one area to result in offsetting changes in another area is referred to as leakage. For example, the afforestation of cropland in one area may result in the conversion of forestland to cropland in another to make up for the loss of agricultural production.
- Additionality. Additionality is the extent the activity and associated carbon benefit would not have happened anyway. For example, preserving an area to avoid deforestation is not additional if the forestland was not under threat of deforestation.
Finally, all of these considerations are in the context of the uncertainty related to the future effects of changing climatic conditions on forests broadly. The general scientific consensus is that, under most climate change scenarios, U.S. forests overall would likely continue to serve as a net carbon sink. However, the strength of that sink would diminish over time and, under some scenarios, could reverse.78 Regionally, some forests could be net sources of carbon at various times.79
Part of the uncertainty related to how forests may adapt to climate change is because many of the potential effects are interrelated (particularly in terms of ecological disturbances) and because, in some scenarios, the various effects could amplify or counteract each other.80 For example, more CO2 in the atmosphere could increase forest growth but also could result in drought conditions, which would inhibit forest growth.81
Another source of uncertainty is the maximum extent of U.S. forests. After expanding steadily for several decades, the extent of U.S. forest area may have begun to plateau.82 If forest area begins to decrease, then a net amount of carbon could be lost and U.S. forests would be expected to sequester less carbon annually. If forest area expands further, however, then U.S. forests might be able to sequester more carbon moving forward. Finally, the carbon flux associated with U.S. forests is small relative to the amount of carbon stored in those forests, though U.S. forests offset 12% of GHG emissions in 2018. If U.S. forests sequester less carbon annually in the future, as predicted by some models, then U.S. forests would offset less GHG emissions and could potentially become a source of GHG emissions. Under such a scenario, even if GHG emissions were to remain constant at today's levels, the amount of atmospheric carbon would still increase. Thus, even minor shifts in carbon flux have the potential to significantly affect the nation's carbon balance and the overall global carbon cycle.
Appendix. Glossary of Selected Terms
Below is a glossary of selected terms used throughout this report. Most of the definitions are derived from several, interrelated sources, as listed below. Some terms may have a broad definition established through various international standards, which allow for the definition to be narrowed to fit national specifications. In some cases, the definition has been edited for clarity.
- Food and Agriculture Organization of the United Nations, Global Forest Resources Assessment 2020: Terms and Definitions, Working Paper 188, 2018.
- International Panel on Climate Change (IPCC, which is the United Nations body for assessing the science related to climate change), IPCC Guidelines for National Greenhouse Gas Inventories, 2006.
- U.S. Environmental Protection Agency (EPA), EPA Inventory, 2020, Chapter 6, "Land Use, Land-Use Change, and Forestry (LULUCF)," April 13, 2020.
- Forest Service, The U.S. Forest Carbon Accounting Framework: Stocks and Stock Change, 19902016, GTR-NRS-154, November 2015.
Glossary
|
Aboveground Biomass |
All biomass of living vegetation (both woody and herbaceous) above the soil. Aboveground biomass includes stems, stumps, branches, bark, seeds, and foliage. |
|
Aboveground Pools |
Includes the forest carbon pools that store the carbon above the ground, such as aboveground biomass, deadwood, and litter. |
|
Afforestation |
Establishment of forest through planting or deliberate seeding on land that, until then, was under a different land use. The definition implies a transition of land use from non-forest to forest. |
|
Belowground Biomass |
All biomass of living roots greater than 2 millimeters in diameter. |
|
Belowground Pool |
Includes the forest carbon pools that store the carbon below the ground, such as belowground biomass and soil. |
|
Biomass |
(1) The total mass of living organisms in a given area or of a given species, usually expressed as dry weight, and may exist above or below ground; (2) organic matter consisting of, or recently derived from, living organisms. |
|
Boreal Forests |
Forested regions where mean annual temperature is less than or equal to 0°C, generally located between 50° and 70° north of the equator; mostly in Alaska, Canada, Scandinavia, and Russia. |
|
Carbon (C) |
Carbon is a chemical element that, when combined with oxygen, makes the greenhouse gas carbon dioxide (CO2). Throughout the carbon cycle, carbon may transform into different elemental forms, including carbon dioxide. |
|
Carbon Dioxide (CO2) |
Carbon dioxide (CO2) is a compound consisting of one atom of carbon and two atoms of oxygen. CO2 is a greenhouse gas. |
|
Carbon Dioxide Equivalent |
The amount of a greenhouse gas (GHG) or mixture of GHGs emitted to the atmosphere that would cause the same temperature change, over a given time horizon, as an emitted amount of carbon dioxide. |
|
Carbon Density |
The weight of carbon per unit of area. |
|
Carbon Flux |
The transfer of carbon between different stocks or pools. |
|
Carbon Pool |
A reservoir where carbon is stored in a particular place for a period of time; consisting of individual, nonoverlapping categories (e.g., atmosphere, land, ocean, Earth's crust). Forest carbon pools include aboveground biomass, belowground biomass, deadwood, litter, soil, and harvested wood products. |
|
Carbon Sequestration |
The process of storing carbon in a carbon pool. See also carbon uptake. |
|
Carbon Stock |
The quantity of carbon in a pool. |
|
Carbon Turnover |
The amount of time carbon is cycling in a system in units of years; also referred to as mean residence time. |
|
Carbon Uptake |
The process of storing carbon in a carbon pool. See also carbon sequestration. |
|
Dead Pools |
Includes all of the forest carbon pools that store nonliving forms of carbon, including deadwood, litter, and soil. In some cases, may include carbon store in harvested wood products. |
|
Deadwood |
All nonliving woody biomass that is standing, lying on the ground (but not including litter), or in the soil. |
|
Deforestation |
The conversion of forest to other land use, whether human-induced or not. The definition implies that trees are removed and not reestablished. |
|
Disturbance
|
Any relatively discrete event in time that disrupts ecosystems, community, or population structure and changes resources, substrate availability, or the physical environment. Anthropogenic disturbances include timber harvests, prescribed wildland fires, and planned land-use conversions. Ecological disturbances include weather events, insect and disease infestations, and wildfires. |
|
Ecosystem Pools |
Includes all of the pools of carbon that occur in the forest, including aboveground and belowground biomass, deadwood, litter, and soil. |
|
Forest |
An area at least 120 feet (36.6 meters) wide and at least one acre (0.4 hectares) in size with at least 10% cover (or equivalent stocking) by live trees, including land that formerly had such tree cover and that will be naturally or artificially regenerated. This includes all areas recently having such conditions that are currently regenerating or are capable of attaining such condition in the near future. Forestland does not include land that is predominantly under agricultural (i.e., orchards) or urban (i.e., parks) land use. |
|
Greenhouse Gas (GHG) |
A gas that absorbs and emits radiant energy. Greenhouse gases in the Earth's atmosphere allow solar radiation to warm the Earth's surface to a higher temperature than if the gases were not present. Carbon dioxide is a greenhouse gas. |
|
Harvested Wood Products in Use |
Items made of woody biomass used as a material or for energy purposes that have not been discarded. |
|
Harvested Wood Products in Solid Waste Disposal Sites |
Items made of woody biomass that have been discarded to sanitary landfills, dumps, or other sites where waste is not destroyed or reconstituted (i.e., incinerated, recycled, or other processes). |
|
Litter |
All nonliving biomass with a diameter less than 10 centimeters lying dead in various states of decomposition above the mineral or organic soil. |
|
Living (or Live) Pools |
All of the forest carbon pools that store living forms of carbon, which includes aboveground and belowground biomass. |
|
Managed Land |
Land where human interventions and practices have been applied to perform production, ecological, or social functions. |
|
Photosynthesis |
The process by which plants use light to convert atmospheric carbon dioxide and water into oxygen and carbohydrate molecules. Photosynthesis removes carbon dioxide from the air into the plant's tissues. |
|
Product Pool |
Pools of forest carbon that have been removed from the forest ecosystem and are harvested wood products, either in use or in disposal. |
|
Removal |
Sequestration of carbon dioxide from the atmosphere by a sink. |
|
Reforestation |
Reestablishment of forest through planting and/or deliberate seeding on land classified as forest. |
|
Respiration |
The process by which plants use oxygen to break down stored carbohydrates into energy. Respiration creates carbon dioxide and water as byproducts. Respiration may also occur on below ground, where it is referred to as soil respiration. |
|
Sink |
Any process, activity, or mechanism that removes a greenhouse gas from the atmosphere. A carbon sink is a carbon pool wherein the gains of carbon are greater than the losses of carbon over a specified period. Represented in some reporting with a negative sign. |
|
Soil (Organic) Carbon |
All organic material in soil to a depth of 1 meter, excluding roots greater than 2 millimeters in size. |
|
Source |
Any process or activity that releases greenhouses gasses into the atmosphere; reported with a positive sign. A carbon source is a carbon pool wherein the losses of carbon are greater than the gains of carbon over a specified period. |
|
Temperate Forests |
Forested areas located generally between ~25° and ~50° north and south of the equator, where mean annual temperature is between 0°C and 18°C. |
|
Tropical Forests |
Forested areas located between ~23.5° north and south of the equator (e.g., between the Tropic of Cancer and the Tropic of Capricorn), where mean annual temperature is more than 18°C. |
|
Tree |
Trees are woody plants having a more or less erect perennial stem capable of achieving at least 3 inches in diameter at breast height, or 5 inches in diameter at their base, and a height of at least 16.4 feet at maturity. |
|
Unmanaged Land |
Largely comprised of areas inaccessible to society due to the remoteness of the location. Though these lands may be influenced indirectly by human actions, they are not influenced by a direct human intervention. |
|
Woodland |
Land with sparse trees with a tree canopy cover of 5% to 10%, combined with shrubs to achieve an overall cover of woody vegetation over 10%. Woodland is not included in the definition of forest and is considered to be grassland for the purposes of this report. |