Background
The growth in U.S. exports of petroleum products has fundamentally altered the role of petroleum products in the U.S. trade deficit over the past decade. Notably, in the last four months of 2019, the United States was a net exporter of petroleum products, the first time since such data were collected in the post-war period. Although the U.S. trade deficit is no longer dominated by changes in petroleum prices, the United States continues to experience overall merchandise trade deficits on a monthly and annual basis and continues to be a large net importer of crude oil, one component of the broad category of petroleum products. In September 2019, for instance, the United States imported 194 million barrels of crude oil and exported 3 million barrels. Petroleum products, however, once a key factor in determining the overall trade deficit, have been replaced by a net deficit (imports exceeding exports) of non-petroleum products, which has altered the composition of the trade deficit. Economists argue that the overall size of the U.S. trade deficit is determined by macroeconomic factors that affect interest rates, capital flows, and exchange rates. As a result, absent changes in the underlying macroeconomic factors, changes in prices and trade patterns alone, even for commodities as substantial a part of U.S. trade as petroleum, alter the composition of the U.S. trade account, but are unlikely to eliminate the merchandise trade deficit.
According to data published by the U.S. Commerce Department's Census Bureau,1 the average price of imported crude oil was $53.31 per barrel 2019, or a decrease of 8.4% from 2018. Crude oil prices generally rise during the winter and spring months and then decline in the fall. Oil futures markets in January 2020 indicate that oil traders expect crude oil prices to move in the range of $56 to $60 per barrel in 2020. Average imported crude oil prices rose through much of 2017 and into 2018, rising to nearly $70 per barrel in early April 2018, exceeding the value of oil futures contacts. Imported energy products, primarily crude oil, account for about 15% of the total annual U.S. energy consumption, measured in btus.2 In contrast to crude oil, liquefied natural gas (LNG) prices tend to rise during the winter as consumers use natural gas to heat their homes. A mild start to the 2020 winter season in the United States and parts of Europe and Asia, however, is causing LNG inventories to rise. The rise in inventories combined with planned increases in capacity and export terminals in the United States and elsewhere that exceeds current demand forecasts, has pushed LNG prices in early January 2020 to annual lows.3
Energy prices can fluctuate sharply at times on a monthly and annual basis. For instance, prior to the financial collapse in 2008, the average price of imported crude oil reached nearly $140 per barrel, before falling at a historic rate.4 During the economic recession in 2009, however, average crude oil prices fell each month between August 2008 and February 2009, but then reversed course and rose by 85% between February and December 2009, climbing to nearly $80 per barrel at times. Turmoil in the Middle East, natural disasters, hurricanes, droughts, the rate of economic growth in Asia and Europe, the prospects of Iranian oil exports, and the impact of low oil prices on U.S. investment and production of petroleum and natural gas have led to the United States becoming the world's largest combined producer of oil and natural gas. The United States as the largest producer likely will continue to have a significant impact on the course of oil prices in global and domestic markets for the foreseeable future.
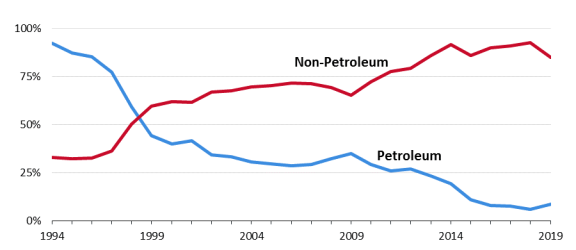
Crude oil comprises the largest component by value within the broad category of energy-related imports. Despite fluctuations in oil prices and sharp drops at times in the average annual price of imported crude oil and the decline in the role of imported crude oil in the value of the U.S. trade deficit, the overall U.S. trade deficit has grown each year since 2013. Instead of the trade deficit declining with the diminished role of petroleum products, the composition of the trade deficit has changed, with the deficit in non-petroleum products replacing the deficit in petroleum products, as indicated in Figure 1.
In isolation from other events, lower energy prices tend to aid the U.S. economy by lowering energy costs for businesses, increasing consumers' real incomes, and making the United States a more attractive destination for foreign investment. Foreign capital inflows, however, place upward pressure on the dollar against a broad range of other currencies. The impact of changing currency prices are mitigated for the United States, however, by the fact that oil in the global market is priced in dollars, so that both U.S. export and import prices of petroleum products (and prices more generally) tend to be affected in similar manners. Also, periods of volatility or uncertainty in the global economy can spur investors to seek out such safe haven currencies as the dollar, which tends to push up the international value of the dollar. To the extent that the additions to the merchandise trade deficit are returned to the U.S. economy as payment for additional U.S. exports or to acquire such assets as securities or U.S. businesses, the overall economic impact of the U.S. trade deficit could be mitigated further.
Lower energy prices are expected to aid consumers by increasing their real incomes and to aid some businesses. How consumers respond to lower energy costs, however, is problematic. For instance, in 2015, consumers reportedly responded to lower energy costs by slightly increasing their overall level of consumption, but also by increasing their saving rate and reducing credit card debt. In contrast, energy producers have responded at times to lower energy prices by curtailing new investments and by trimming payrolls, offsetting some of the stimulus to the economy provided by lower imported petroleum prices.5 In 2019, low energy prices combined with high debt levels reportedly caused U.S. energy producers to reduce their spending on capital equipment, reduced their profits and, in some cases, led to bankruptcies.6 Reportedly, in late 2019 and early 2020, bond and equity investors, as well as banks, reduced their lending to shale oil producers and other energy producers that typically use oil and gas reserves as collateral.7
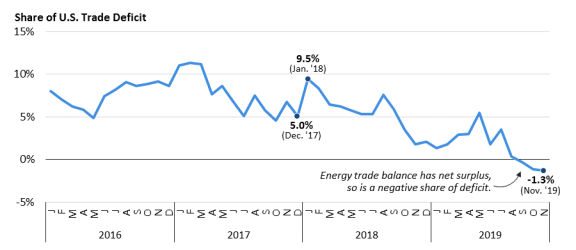
In January 2018, energy imports accounted for about 9% of the total U.S. trade deficit, up from a share of 4% in December 2017, as indicated in Figure 2. As previously noted, in December 2019, the energy trade balance share of the overall U.S. trade deficit, or exports less imports expressed as a share of the overall U.S. trade deficit, turned positive, but is expressed as a negative share of -0.1 % of the overall U.S. trade deficit. Shares of the U.S. trade deficit customarily are expressed as positive numbers, however, the recent shift of the U.S. energy trade balance to a net surplus is expressed as a negative number, indicating that the share of the U.S. trade balance that represents trade in petroleum products has shifted to a positive factor in the overall U.S. trade deficit. This shift in the trade deficit represented by trade in petroleum products reduces the component of the trade deficit comprised of petroleum products and reflects the growth of exports of petroleum products in the U.S. balance of payments.
Recent Trends
Summary data from the Census Bureau for the change in the volume, or quantity, of energy-related petroleum imports and the change in the price, or the value, of those imports for 2018 and 2019, are presented in Table 1. The data indicate that during 2018, the United States imported over 3.5 billion barrels of energy-related petroleum products, down 4.8% in volume terms from the average amount imported in 2017. Energy imports in 2018, however, were valued at $211 billion, up 21% from $175 billion in 2017, largely reflecting a 26% increase in the average import price of crude oil from 2017 to 2018. Data for 2019 indicate that the United States imported over 3.1 billion barrels of energy-related petroleum products, down 10.0% year-over-year. During the same period, average import prices for petroleum products were down 9%. The combination of lower average import prices and lower import volumes in 2019 resulted in a value of imported petroleum of $178 billion, 16% less than the value of imported petroleum products during the comparable period in 2018.
In general, U.S. demand for oil imports responds slowly to changes in oil prices. According to various studies, U.S. demand for oil is correlated more closely with changes in U.S. per capita income than to changes in oil prices.8 While it is difficult to establish direct cause and effect relationships, the drop in U.S. energy imports in 2019 may be explained in part by the slowdown in the rate of growth in the U.S. economy and in changes in per capita income, year-over-year. During 2019, the real rate of economic growth in U.S. gross domestic product (GDP) fell from an annual rate of 2.9% in 2018 to 2.3% in 2019, while the rate of growth in personal consumption fell from an annual rate of 3.0% in 2018 to 2.6% in 2019.9
Table 1. Summary Data of U.S. Imports of Energy-Related Petroleum Products, Including Oil
(not seasonally adjusted)
|
2017 |
2018 |
|||||
|
Jan.-Dec. |
Jan.-Dec. |
|||||
|
Quantity |
Value |
Quantity |
% change 2017 to 2018 |
Value |
% change |
|
|
Total energy-related petroleum products |
3,639.8 |
$174.8 |
3,464.2 |
-4.8% |
$211.4 |
21.0% |
|
Crude oil |
2,883.8 |
$132.6 |
2,694.3 |
-6.6% |
$156.9 |
18.3% |
|
2018 |
2019 |
|||||
|
Jan.-Dec., Actual |
Jan.-Dec., Actual |
|||||
|
Quantity |
Value |
Quantity |
% change 2018 to 2019 |
Value |
% change |
|
|
Total energy-related petroleum products |
3,464.2 |
$211.4 |
3,116.9 |
-10.0% |
$178.3 |
-15.7% |
|
Crude oil |
2,694.3 |
$156.9 |
2,374.0 |
-11.9% |
$126.6 |
-19.3% |
Source: U.S. Department of Commerce, U.S. Census Bureau, Report FT900, U.S. International Trade in Goods and Services, Table 17, February 5, 2020.
Oil Import Volumes
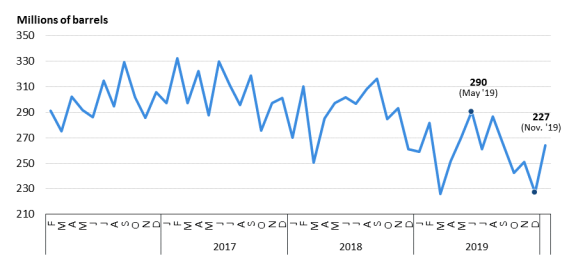
Commerce Department data indicate that in 2019, the volume, or quantity, of energy-related petroleum products imported by the United States totaled 3.1 billion barrels, or 10% below the 3.4 billion barrels imported during 2018. On average, the United States imported 259 million barrels of petroleum products per month in 2019. As Figure 3 shows, average monthly imports of energy-related petroleum products can vary sharply. In May 2019, for instance, the average monthly volume reached 290 million barrels, compared with the average monthly value of 263 million barrels in December 2019. In 2017, U.S. imports of energy products reached their highest average monthly levels since 2013, reaching an average of 331 million barrels in January 2017 and an average of 328 million barrels per month in May 2017.
Oil Import Values
As indicated in Table 2, the nominal dollar value of energy-related petroleum products imports in 2018 was $211 billion, up 21% from the value of similar imports in 2017, which accounted for more than 8% of the value of total U.S. merchandise imports. The average price of imported crude oil in 2018 was $58.22 a barrel, up 26% from an average price of $46 per barrel in 2017. In July 2018, the average price of imported oil stood at $64 per barrel, reflecting increased demand for petroleum products during the summer months. By January 2019, the average monthly price of an imported barrel of oil was $42, the lowest average monthly price recorded during 2019. The average price per barrel of crude oil in 2019 was $53 per barrel, down 8% from the comparable average price of $58 per barrel in 2018. At prevailing prices and volumes, energy imports in 2019 equaled about $178 billion, or about $33 billion less than in 2018.
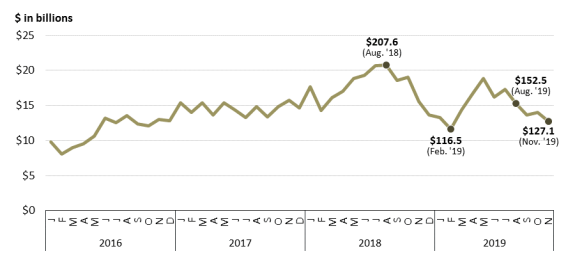
On a monthly basis, energy import prices and, therefore, the total value of energy imports can vary, as indicated in Figure 4. Through 2017, the value of energy-related imports varied within a relatively narrow band, but experienced wider swings on a monthly basis in 2018 and 2019, reflecting changes in average monthly prices. From August 2018 to February 2019, for instance, the value of U.S. energy-related petroleum imports fell from around $20.8 billion to $11.6 billion, before rising again by August 2019.
Table 2. U.S. Imports of Energy-Related Petroleum Products, Including Crude Oil
(not seasonally adjusted)
|
Period |
Total energy-related petroleum productsa |
Crude |
||||
|
Quantity |
Value |
Quantity |
Thousands |
Value |
Unit price |
|
|
2018 |
||||||
|
Jan-Dec |
3,464.2 |
$211.4 |
2,694.3 |
7,382 |
$156.9 |
$58.22 |
|
January |
310.4 |
17.6 |
241.7 |
7,796 |
13.2 |
54.78 |
|
February |
250.5 |
14.3 |
191.3 |
6,834 |
10.5 |
54.83 |
|
March |
284.9 |
16.1 |
219.3 |
7,074 |
11.8 |
54.02 |
|
April |
297.3 |
17.1 |
236.1 |
7,871 |
12.9 |
54.50 |
|
May |
301.7 |
18.9 |
232.0 |
7,485 |
13.5 |
58.38 |
|
June |
296.5 |
19.3 |
237.3 |
7,911 |
14.8 |
62.46 |
|
July |
308.3 |
20.7 |
241.6 |
7,795 |
15.6 |
64.54 |
|
August |
316.2 |
20.8 |
241.9 |
7,804 |
15.2 |
62.64 |
|
September |
284.9 |
18.6 |
213.6 |
7,122 |
13.1 |
61.40 |
|
October |
293.3 |
19.0 |
227.9 |
7,352 |
14.0 |
61.25 |
|
November |
261.2 |
15.6 |
211.3 |
7,043 |
12.2 |
57.54 |
|
December |
259.0 |
13.6 |
200.1 |
6,454 |
10.1 |
50.26 |
|
2019 |
||||||
|
Jan-Dec. |
3,116.9 |
$178.3 |
2,374.0 |
6,504 |
$126.6 |
$53.31 |
|
January |
281.8 |
13.3 |
223.1 |
7,196 |
9.5 |
42.59 |
|
February |
225.8 |
11.6 |
173.7 |
6,205 |
8.1 |
46.89 |
|
March |
251.6 |
14.4 |
195.9 |
6,320 |
10.4 |
53.10 |
|
April |
269.4 |
16.6 |
205.5 |
6,849 |
11.7 |
57.16 |
|
May |
290.7 |
18.8 |
219.5 |
7,081 |
13.3 |
60.56 |
|
June |
261.0 |
16.2 |
204.2 |
6,806 |
12.1 |
59.18 |
|
July |
286.7 |
17.3 |
213.8 |
6,897 |
12.1 |
56.48 |
|
August |
265.3 |
15.2 |
198.8 |
6,414 |
10.8 |
54.13 |
|
September |
242.7 |
13.7 |
185.7 |
6,190 |
9.9 |
53.12 |
|
October |
250.9 |
14.0 |
188.3 |
6,074 |
9.8 |
52.00 |
|
November |
227.4 |
12.7 |
166.4 |
5,546 |
8.6 |
51.92 |
|
December |
263.7 |
14.5 |
199.1 |
6,423 |
10.2 |
51.48 |
Source: U.S. Department of Commerce, U.S. Census Bureau, Report FT900, U.S. International Trade in Goods and Services, Table 17, February 5, 2020.
a. "Energy-related petroleum products" is a term used by the Census Bureau and includes crude oil, petroleum preparations, and liquefied propane and butane gas.
Oil Import Prices
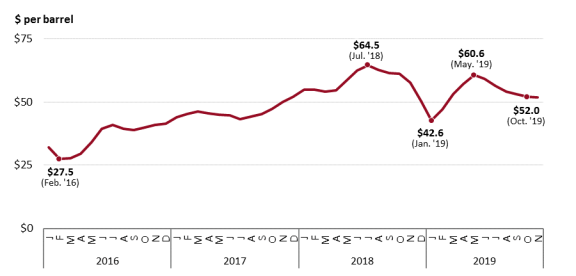
Crude oil comprises the largest share of U.S. total energy-related petroleum products imports, accounting for 76% of such imports. Census Bureau data10 indicate that the price of imported crude oil can fluctuate on a daily and monthly basis, reflecting international political events and economic activity. As shown in Figure 5, average monthly crude oil import prices generally trended up during the 2016 through 2019 period and varied in a range between $27 and $64 per barrel between February 2016 and July 2018, after which average monthly imported oil prices fell to nearly $40 per barrel in January 2019. Since then, crude oil prices rose to about $60 per barrel on an average monthly basis in May 2019, before falling to about $51 per barrel on an average monthly imported price in December 2019.
 |
|
Source: Created by CRS. Data from U.S. Department of Commerce, U.S. Census Bureau, Report FT900, U.S. International Trade in Goods and Services, Table 17, February 5, 2020. |
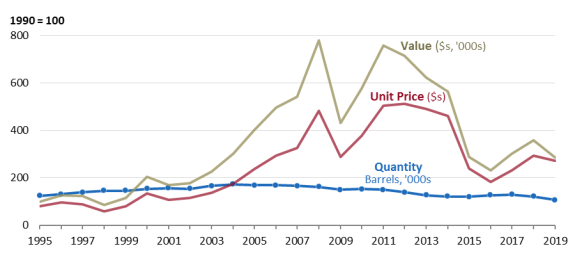
As previously indicated, the combination of changes in the volume, value, and prices of crude oil can have a large impact on the total value of U.S. imports and on the composition of the U.S. trade deficit. Figure 6 shows the annual amounts of the volume, value, and price of U.S. crude oil imports from 1995 to 2019, represented in index terms with 1990 as the base year. The data indicate that the overall quantity, or volume, of U.S. imports of crude oil on an annual basis was about the same in 2019 as it was in 1995, despite large changes in both prices and the overall value of crude oil imports. As a result, changes in the overall value of crude oil imports largely reflects changes in the price per barrel of crude oil. A large run-up in crude oil prices prior to the 2008-2009 global financial crisis and then subsequent sharp decline as a result of the global economic recession had a similar effect on the overall value of crude oil imports.
The overall decline in the average price of energy-related imports has accompanied a drop in the imported volume of crude oil, potentially signaling important changes in the U.S. energy market. The United States has become the world's largest combined producer of oil and natural gas, which has reduced demand for imports of petroleum products as a whole. In addition, improvements in energy efficiency appear to be continuing; such improvements result in less energy being used to sustain a given level of economic activity. A slower rate of economic growth also has consequences for energy consumption in the economy and the role of imported energy products. Lower energy prices, however, are not a panacea for the U.S. economy as a whole. The U.S. energy sector has tended to trim employment and curtail investment projects during periods of low crude oil prices, which potentially negatively affect future energy production. Lower energy prices also negatively affect energy-exporting countries by reducing their rate of economic growth and their demand for imports; this, in turn, negatively affects countries with which they engage in international trade. A slowdown in global trade will have a slightly negative impact on the U.S. economy: exports and imports account for about 13% and 16%, respectively, of U.S. GDP.
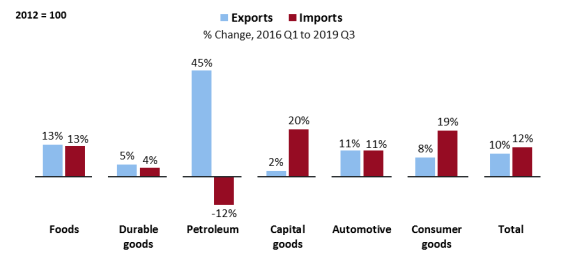
Another view of the U.S. trade balance is presented in Figure 7, which is based on U.S. national income accounts data. These data represent percent changes in export and import volumes in index number terms with 2012 as the base year. The data indicate that on a quarterly basis, between the first quarter of 2016 and the third quarter of 2019, exports of petroleum products increased by 45%, while imports fell by 12%. In contrast, imports of capital and consumer goods each increased by about 20% in volume terms. In total, U.S. import volumes increased by about 12% and export volumes grew by about 10%. The difference in U.S. export and import volumes of petroleum products shows the growth in the United States as an energy exporter while U.S. domestic production filled a greater share of domestic energy demand, thereby reducing overall volumes of petroleum import.
Issues for Congress
In the last four months of 2019, U.S. exports of petroleum products exceeded imports, marking a notable change in the composition of U.S. trade and in the monthly trade balance in petroleum products. As a result, trade in petroleum products, which comprises the single largest commodity group in the U.S. trade deficit, shifted from a net contributor to the trade deficit to a net positive, effectively reducing this component of the trade deficit. The composition of the trade deficit has changed as the deficit in petroleum products has been replaced by trade deficits in other commodities, mostly consumer and capital goods. Overall, however, the U.S. trade deficit in nominal terms has continued to rise. As a share of U.S. gross domestic product (GDP), however, the trade deficit has remained fairly constant since 2013, registering an amount equivalent to about 4% of U.S. GDP in 2019, down from about 6% recorded in 2005 and 2006. The impact of changes in petroleum prices on the U.S. balance of payments and on the economy generally are complicated by the fact that oil is priced in dollars in global energy markets so import and export prices tend to move in tandem, rather than in opposite directions as generally would be expected.
Typically, energy import prices have followed a cyclical pattern as energy prices rise in the summer months and fall in the winter. Among a number of factors that can affect crude oil prices are the impact of Atlantic hurricanes on the production of crude oil in the Gulf of Mexico and droughts in the Midwestern United States that can reduce the production of corn and, therefore, the availability of ethanol, which puts upward pressure on gasoline prices. Recently, the price of oil has been affected by increased energy production in the United States and a combination of global economic events, including the slowdown in the Chinese economy (most recently threatened by coronavirus) and the Indian economy; a sharp drop in commodity prices that has negatively affected commodity producers and their trading partners; the international exchange value of the dollar; the production of crude oil by OPEC oil producers to reduce production in order to drive up prices; and continued turmoil in the Middle East, among other events.
Also, a slightly slower GDP growth rate in the United States in 2019, compared with 2018, and combined with international events added downward pressure on the average import price of crude oil. In turn, economic conditions in the United States and the growth in U.S. energy production reduced slightly U.S. demand for imported oil and the impact of imported petroleum products on the U.S. merchandise trade deficit. Despite this change in the net balance of trade in petroleum products, the U.S. trade deficit as a whole has increased as the composition of the trade deficit has changed. Some of the impact of this deficit could be offset if some of the dollars that accrue abroad are returned to the U.S. economy through increased purchases of U.S. goods and services or through purchases of such other assets as corporate securities or acquisitions of U.S. businesses. Some of the return in dollars likely will come through sovereign wealth funds, or funds controlled and managed by foreign governments, as foreign exchange reserves boost the dollar holdings of such funds. Such investments likely will add to concerns about the national security implications of foreign acquisitions of U.S. firms, especially by state-owned enterprises, and to concerns about the growing share of outstanding U.S. Treasury securities that represents ownership by foreigners.
At times, slower-than-expected rates of economic growth in various regions of the world can reduce slightly the global demand for petroleum products and exert downward pressure on the average price of energy imports. Increased energy production in the United States also reduced the amount of energy imports, which may well have contributed to other forces that have tended at times to reduce the price of energy in world markets. Higher energy prices, however, may have been one factor spurring the economy to improve its energy efficiency, find alternative sources of energy, or search out additional supplies of energy. While lower energy costs should improve conditions for both producers and consumers, lower energy prices could dissuade energy producers from investing in new sources of energy, while the increase in consumers' real incomes from lower energy prices could either spur consumption, or could encourage consumers to use their extra income to increase saving and reduce debts.
Congress, through its direct role in setting tax and spending policies and its oversight role over the Federal Reserve, plays a major role in directing economic policy. With the U.S. economy operating at the theoretical full employment level at the end of 2019, Congress may have to weigh the impact of maintaining current policies or adjusting policies to curtail the prospect of potential inflationary pressures. The impact of such policies on the U.S. trade deficit is not straightforward. While lower imported energy prices reduce the energy component of the trade accounts, the overall value of exports and imports is determined by a number of factors, including the international exchange value of the dollar, the domestic balance of saving and investment, and relative rates of growth in demand for exports and imports. Consequently, while the energy component of the U.S. trade deficit has fallen appreciably, the overall U.S. trade deficit has not. If the rate of growth in the U.S. economy, even at low rates, outpaces that of its trading partners, the overall trade deficit potentially worsens even with lower energy prices due to a relatively stronger U.S. demand for imports than foreign demand for U.S. exports and an inflow of foreign capital that puts upward pressure on the value of the dollar. Under such circumstances, Congress potentially could face pressure to examine the causes of the trade deficit and to address the underlying domestic macroeconomic factors that are generating that deficit.